

Introduction #
The FloodNet 2021: A High Resolution Aerial Imagery Dataset for Post Flood Scene Understanding provides high-resolution UAS imageries with detailed semantic annotation regarding the damages. To advance the damage assessment process for post-disaster scenarios, the authors of the dataset presented a unique challenge considering classification, semantic segmentation, and visual question answering highlighting the UAS imagery-based FloodNet dataset. The Challenge has two tracks: 1) Image Classification and Semantic Segmentation; and 2) Visual Question Answering.
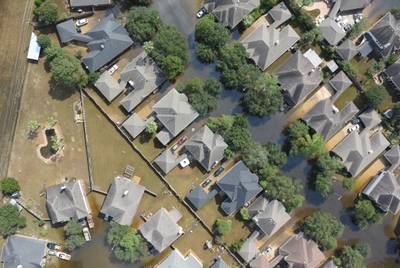
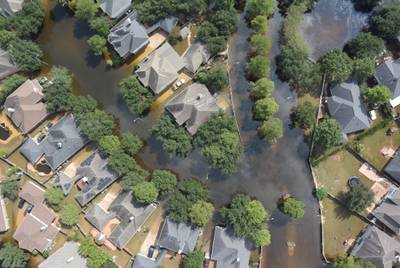
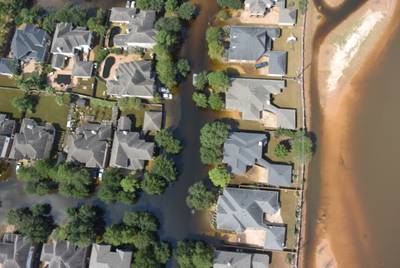
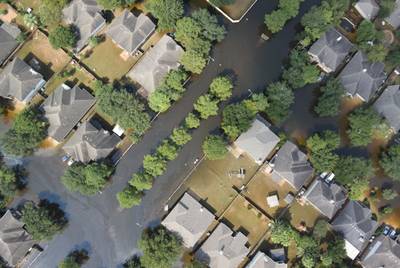
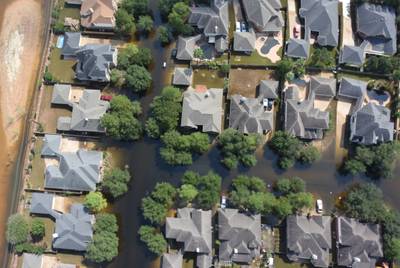
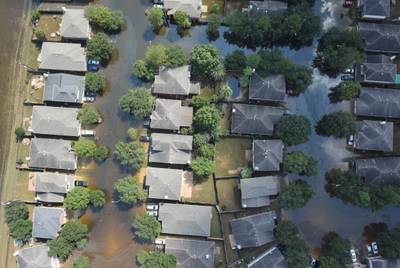
Frequent, and increasingly severe, natural disasters threaten human health, infrastructure, and natural systems. The provision of accurate, timely, and understandable information has the potential to revolutionize disaster management. For quick response and recovery on a large scale, after a natural disaster such as a hurricane, access to aerial images is critically important for the response team. The emergence of small unmanned aerial systems (UAS) along with inexpensive sensors presents the opportunity to collect thousands of images after each natural disaster with high flexibility and easy maneuverability for rapid response and recovery. Moreover, UAS can access hard-to-reach areas and perform data collection tasks that can be unsafe for humans if not impossible. Despite all these advancements and efforts to collect such large datasets, analyzing them and extracting meaningful information remains a significant challenge in scientific communities.
The data was collected with a small UAS platform, DJI Mavic Pro quadcopters, after Hurricane Harvey. The whole dataset has 2343 images, divided into training (~60%), validation (~20%), and test (~20%) sets.
For Track 1 (Semi-supervised Classification and Semantic Segmentation), in the training set, there are around 400 labeled images (~25% of the training set) and around 1050 unlabeled images (~75% of the training set). For Track 2 (Supervised VQA), in the training set, there are around 1450 images and there are a total of 4511 image-question pairs.
The presented dataset contains annotations from Track 1. In this track, participants are required to complete two semi-supervised tasks. The first task is image classification, and the second task is semantic segmentation.
- Semi-Supervised Classification: Classification for the FloodNet dataset requires classifying the images into flooded and non-flooded classes. Only a few of the training images have their labels available, while most of the training images are unlabeled.
- Semi-Supervised Semantic Segmentation: The semantic segmentation labels include: 1) background, 2) building flooded, 3) building non-flooded, 4) road flooded, 5) road non-flooded, 6) water, 7) tree, 8) vehicle, 9) pool, 10) grass. Only a small portion of the training images have their corresponding masks available.
Please note, that some masks in the dataset are cropped relatively to the original image.
 Homepage
 Research Paper
 GitHub
Summary #
FloodNet 2021: A High Resolution Aerial Imagery Dataset for Post Flood Scene Understanding (Track 1) is a dataset for semantic segmentation, classification, and semi supervised learning tasks. It is used in the search and rescue (SAR) and environmental industries.
The dataset consists of 2343 images with 1517 labeled objects belonging to 10 different classes including grass, tree, road non-flooded, and other: water, building non-flooded, vehicle, pool, road flooded, building flooded, and background.
Images in the FloodNet 2021: Track 1 dataset have pixel-level semantic segmentation annotations. There are 1945 (83% of the total) unlabeled images (i.e. without annotations). There are 3 splits in the dataset: train (1445 images), validation (450 images), and test (448 images). Alternatively, the dataset could be split into 2 semi-supervised classification sets: non-flooded (347 images) and flooded (51 images). The dataset was released in 2020 by the UMBC, USA, Texas A&M University, and Dewberry, USA.
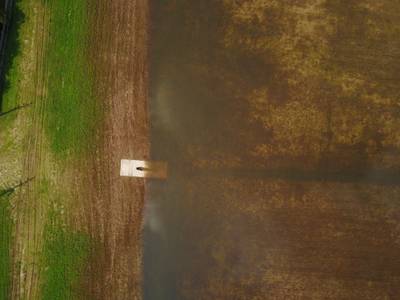
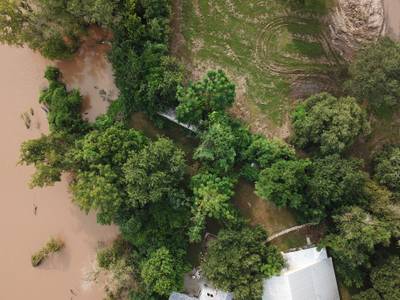
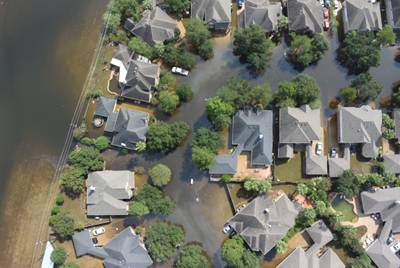
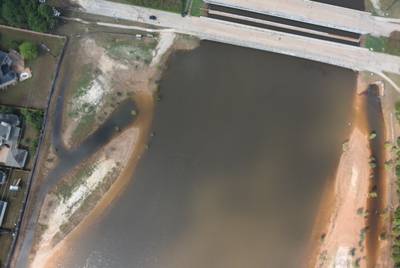
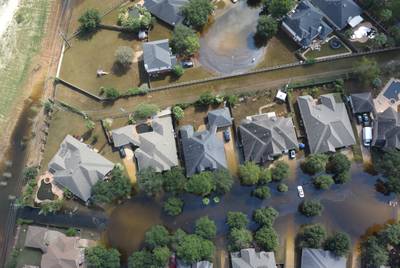
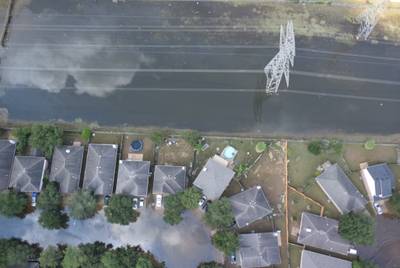
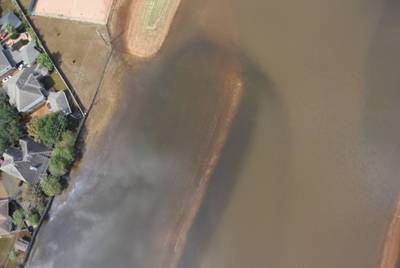
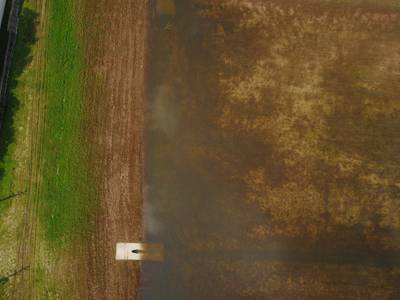
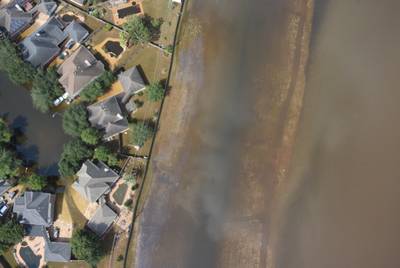
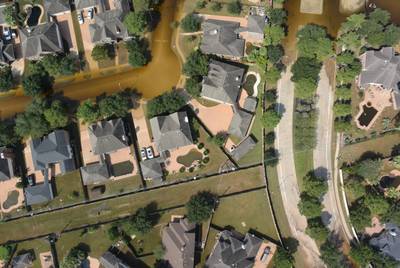
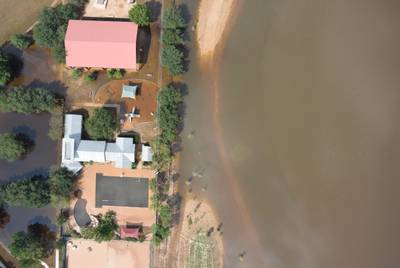
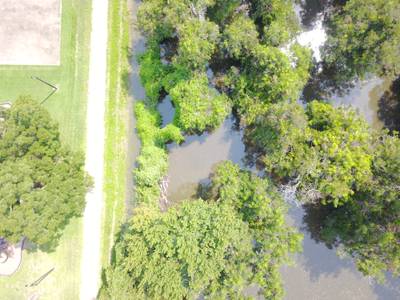
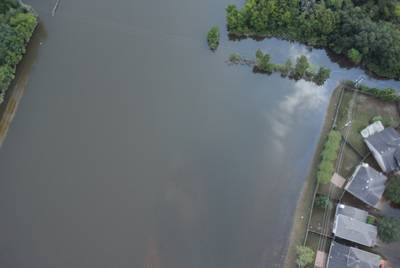
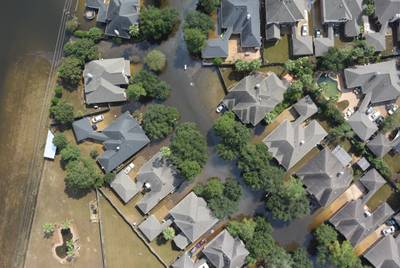
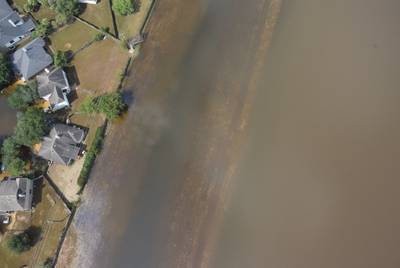
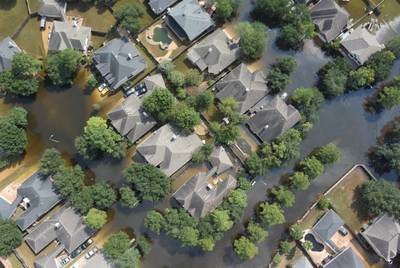
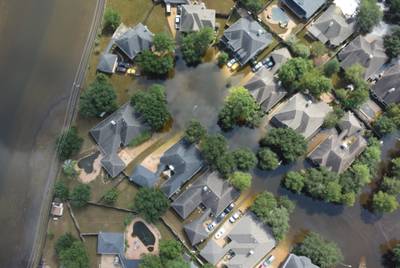
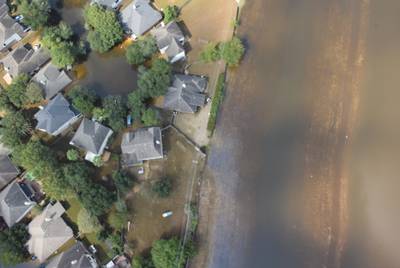
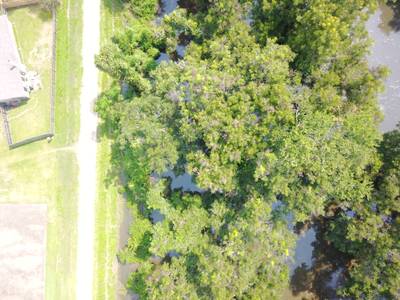
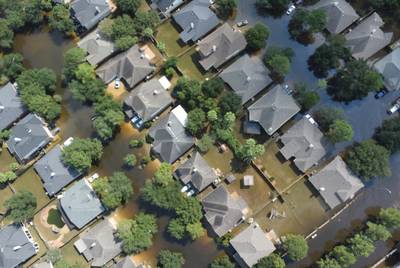
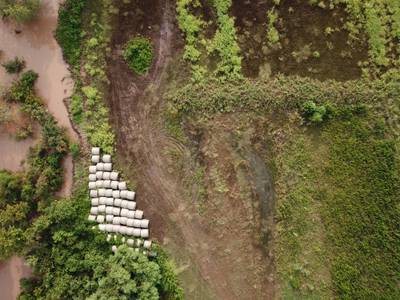
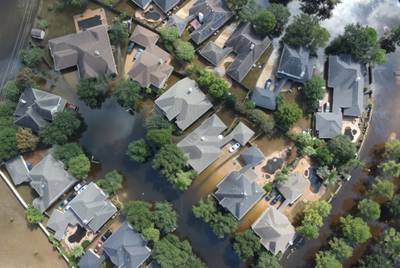
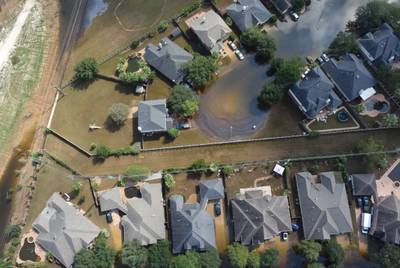
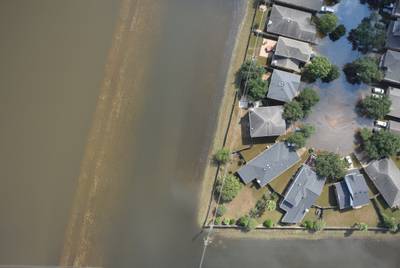
Here are the visualized examples for the classes:
Explore #
FloodNet 2021: Track 1 dataset has 2343 images. Click on one of the examples below or open "Explore" tool anytime you need to view dataset images with annotations. This tool has extended visualization capabilities like zoom, translation, objects table, custom filters and more. Hover the mouse over the images to hide or show annotations.


Class balance #
There are 10 annotation classes in the dataset. Find the general statistics and balances for every class in the table below. Click any row to preview images that have labels of the selected class. Sort by column to find the most rare or prevalent classes.

Class ㅤ | Images ㅤ | Objects ㅤ | Count on image average | Area on image average |
|---|---|---|---|---|
grass➔ mask | 368 | 368 | 1 | 61.61% |
tree➔ mask | 311 | 311 | 1 | 20.69% |
road non-flooded➔ mask | 194 | 194 | 1 | 10.65% |
water➔ mask | 187 | 187 | 1 | 25.31% |
building non-flooded➔ mask | 141 | 141 | 1 | 8.29% |
vehicle➔ mask | 126 | 126 | 1 | 0.55% |
pool➔ mask | 88 | 88 | 1 | 0.83% |
road flooded➔ mask | 37 | 37 | 1 | 17.41% |
building flooded➔ mask | 36 | 36 | 1 | 15.07% |
background➔ mask | 29 | 29 | 1 | 17.67% |
Co-occurrence matrix #
Co-occurrence matrix is an extremely valuable tool that shows you the images for every pair of classes: how many images have objects of both classes at the same time. If you click any cell, you will see those images. We added the tooltip with an explanation for every cell for your convenience, just hover the mouse over a cell to preview the description.
Images #
Explore every single image in the dataset with respect to the number of annotations of each class it has. Click a row to preview selected image. Sort by any column to find anomalies and edge cases. Use horizontal scroll if the table has many columns for a large number of classes in the dataset.
Object distribution #
Interactive heatmap chart for every class with object distribution shows how many images are in the dataset with a certain number of objects of a specific class. Users can click cell and see the list of all corresponding images.
Class sizes #
The table below gives various size properties of objects for every class. Click a row to see the image with annotations of the selected class. Sort columns to find classes with the smallest or largest objects or understand the size differences between classes.
Class | Object count | Avg area | Max area | Min area | Min height | Min height | Max height | Max height | Avg height | Avg height | Min width | Min width | Max width | Max width |
|---|---|---|---|---|---|---|---|---|---|---|---|---|---|---|
grass mask | 368 | 61.61% | 100% | 4.32% | 1616px | 52.6% | 3000px | 100% | 2994px | 99.52% | 1826px | 39.76% | 4000px | 100% |
tree mask | 311 | 20.69% | 83.8% | 0.09% | 80px | 2.67% | 3000px | 100% | 2516px | 83.51% | 126px | 3.15% | 4000px | 100% |
road non-flooded mask | 194 | 10.65% | 45.14% | 0.03% | 132px | 4.4% | 3000px | 100% | 2229px | 74.18% | 64px | 1.6% | 4000px | 100% |
water mask | 187 | 25.31% | 100% | 0.16% | 159px | 5.3% | 3000px | 100% | 2670px | 88.6% | 159px | 3.98% | 4000px | 100% |
building non-flooded mask | 141 | 8.29% | 32.57% | 0.05% | 44px | 1.43% | 3000px | 99.93% | 1758px | 58.44% | 60px | 1.5% | 3998px | 99.95% |
vehicle mask | 126 | 0.55% | 2.6% | 0.02% | 51px | 1.7% | 3000px | 97.66% | 1320px | 43.48% | 60px | 1.5% | 3900px | 97.5% |
pool mask | 88 | 0.83% | 3.33% | 0.01% | 37px | 1.2% | 2998px | 99.93% | 1132px | 37.33% | 59px | 1.28% | 3776px | 94.4% |
road flooded mask | 37 | 17.41% | 60.57% | 0.51% | 744px | 24.22% | 3000px | 97.66% | 2764px | 89.97% | 589px | 12.83% | 4000px | 87.11% |
building flooded mask | 36 | 15.07% | 24.07% | 2.43% | 569px | 18.52% | 3000px | 97.66% | 2573px | 83.76% | 825px | 17.97% | 4000px | 87.11% |
background mask | 29 | 17.68% | 89.79% | 0.13% | 255px | 8.5% | 3000px | 100% | 1772px | 58.75% | 200px | 5% | 4000px | 100% |
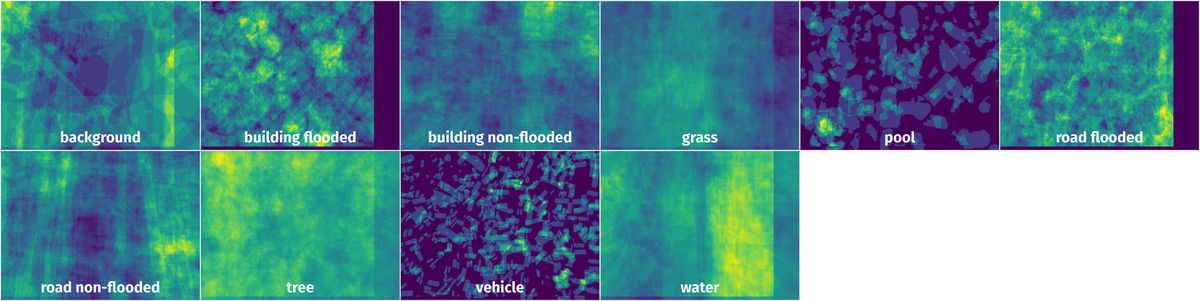
Spatial Heatmap #
The heatmaps below give the spatial distributions of all objects for every class. These visualizations provide insights into the most probable and rare object locations on the image. It helps analyze objects' placements in a dataset.
Objects #
Table contains all 1517 objects. Click a row to preview an image with annotations, and use search or pagination to navigate. Sort columns to find outliers in the dataset.
Object ID ㅤ | Class ㅤ | Image name click row to open | Image size height x width | Height ㅤ | Height ㅤ | Width ㅤ | Width ㅤ | Area ㅤ |
|---|---|---|---|---|---|---|---|---|
1➔ | road non-flooded mask | 8094.jpg | 3000 x 4000 | 3000px | 100% | 1896px | 47.4% | 10.71% |
2➔ | tree mask | 8094.jpg | 3000 x 4000 | 2607px | 86.9% | 2915px | 72.88% | 0.82% |
3➔ | grass mask | 8094.jpg | 3000 x 4000 | 3000px | 100% | 4000px | 100% | 88.48% |
4➔ | water mask | 7081.jpg | 3000 x 4000 | 3000px | 100% | 316px | 7.9% | 5.43% |
5➔ | grass mask | 7081.jpg | 3000 x 4000 | 3000px | 100% | 4000px | 100% | 94.57% |
6➔ | tree mask | 8306.jpg | 3000 x 4000 | 2651px | 88.37% | 3982px | 99.55% | 11.6% |
7➔ | grass mask | 8306.jpg | 3000 x 4000 | 3000px | 100% | 4000px | 100% | 88.4% |
8➔ | building flooded mask | 7434.jpg | 3072 x 4592 | 2982px | 97.07% | 3155px | 68.71% | 20.7% |
9➔ | road flooded mask | 7434.jpg | 3072 x 4592 | 2721px | 88.57% | 3042px | 66.25% | 15.7% |
10➔ | water mask | 7434.jpg | 3072 x 4592 | 3000px | 97.66% | 4000px | 87.11% | 26.98% |
License #
FloodNet 2021: A High Resolution Aerial Imagery Dataset for Post Flood Scene Understanding is under CC BY-SA 4.0 license.
Citation #
If you make use of the FloodNet (Track 1) data, please cite the following reference:
@article{rahnemoonfar2020floodnet,
  title={FloodNet: A High Resolution Aerial Imagery Dataset for Post Flood Scene Understanding},
  author={Rahnemoonfar, Maryam and Chowdhury, Tashnim and Sarkar, Argho and Varshney, Debvrat and Yari, Masoud and Murphy, Robin},
  journal={arXiv preprint arXiv:2012.02951},
  year={2020}
}
If you are happy with Dataset Ninja and use provided visualizations and tools in your work, please cite us:
@misc{ visualization-tools-for-floodnet-dataset,
  title = { Visualization Tools for FloodNet 2021: Track 1 Dataset },
  type = { Computer Vision Tools },
  author = { Dataset Ninja },
  howpublished = { \url{ https://datasetninja.com/floodnet } },
  url = { https://datasetninja.com/floodnet },
  journal = { Dataset Ninja },
  publisher = { Dataset Ninja },
  year = { 2026 },
  month = { jul },
  note = { visited on 2026-07-17 },
}
Download #
Dataset FloodNet 2021: Track 1 can be downloaded in Supervisely format:
As an alternative, it can be downloaded with dataset-tools package:
pip install --upgrade dataset-tools
… using following python code:
import dataset_tools as dtools

dtools.download(dataset='FloodNet 2021: Track 1', dst_dir='~/dataset-ninja/')
Make sure not to overlook the python code example available on the Supervisely Developer Portal. It will give you a clear idea of how to effortlessly work with the downloaded dataset.
The data in original format can be downloaded here.
Disclaimer #
Our gal from the legal dep told us we need to post this:
Dataset Ninja provides visualizations and statistics for some datasets that can be found online and can be downloaded by general audience. Dataset Ninja is not a dataset hosting platform and can only be used for informational purposes. The platform does not claim any rights for the original content, including images, videos, annotations and descriptions. Joint publishing is prohibited.
You take full responsibility when you use datasets presented at Dataset Ninja, as well as other information, including visualizations and statistics we provide. You are in charge of compliance with any dataset license and all other permissions. You are required to navigate datasets homepage and make sure that you can use it. In case of any questions, get in touch with us at hello@datasetninja.com.