

Introduction #
The authors of the Fluorescent Neuronal Cells dataset address the laborious and time-consuming task of cell counting in fluorescent microscopy. While these objects are generally distinguishable, manual annotation can be prone to errors due to fatigue and subjective interpretation of borderline cases. In their research, the authors tackle the challenge of automating cell counting in fluorescent microscopy images, a task essential for assessing the effects of various experimental conditions on biological structures. For example, the brain areas of mice that mediate the entrance into torpor were investigated, showing evidence of which networks of neurons are associated with this process. Knowing and controlling the mechanisms that rule the onset of lethargy may have a significant impact when coming to applications to humans. Artificially inducing hibernation may be crucial for a wide variety of medical purposes, from intensive care to oncology, as well as space travels and more.
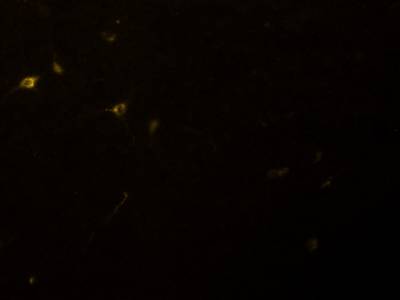
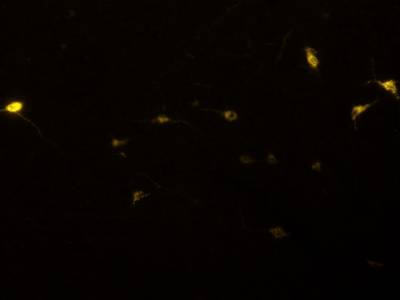
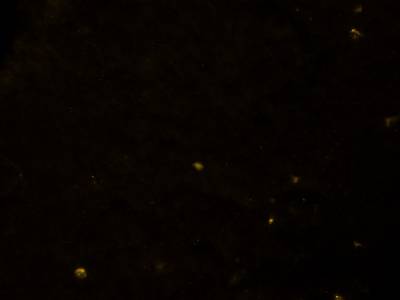
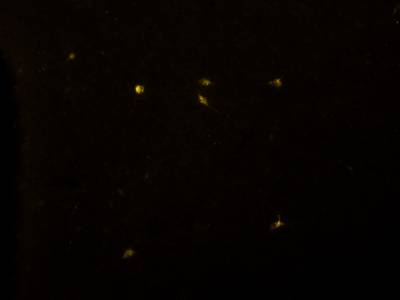
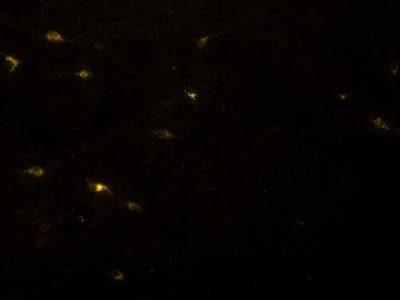
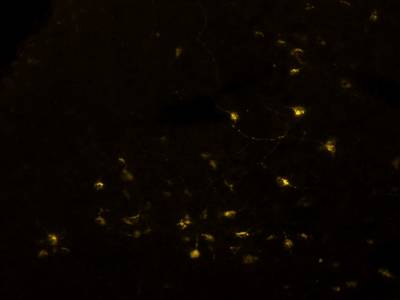
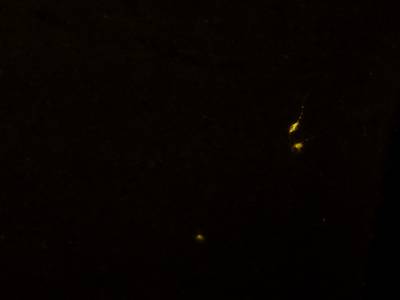
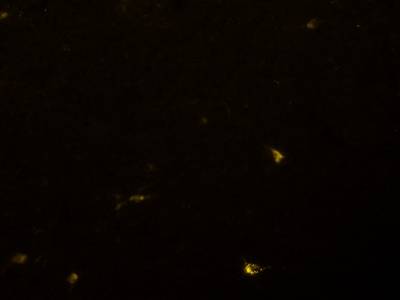
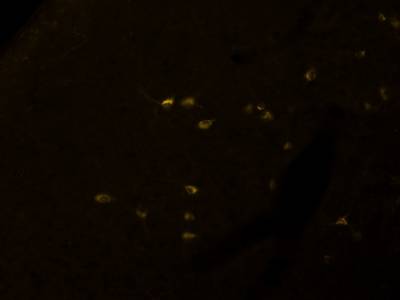
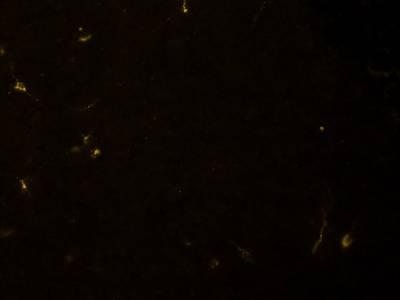
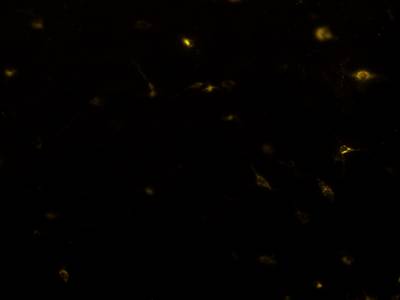
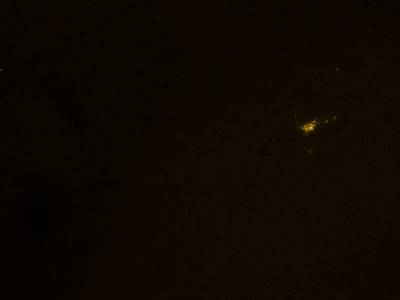
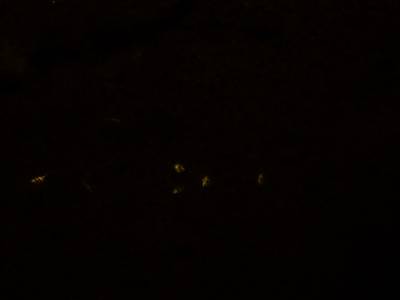
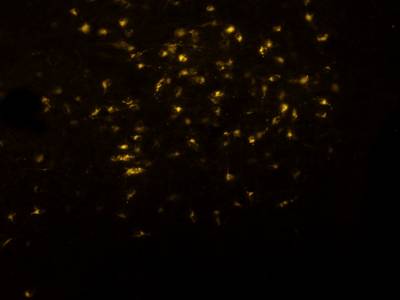
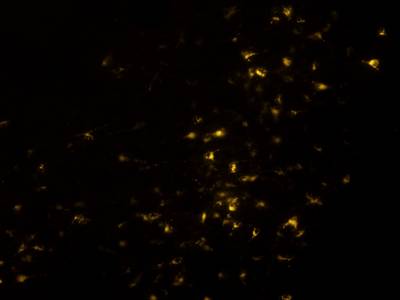
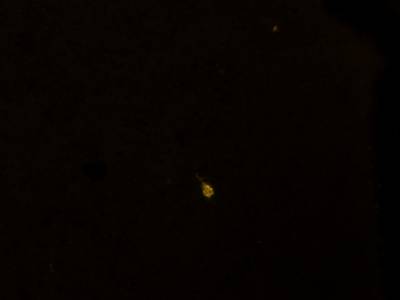
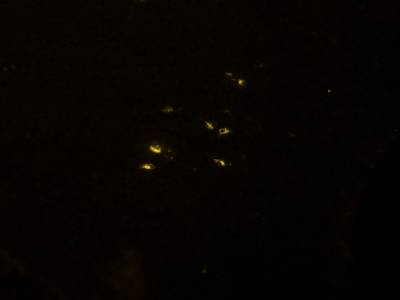
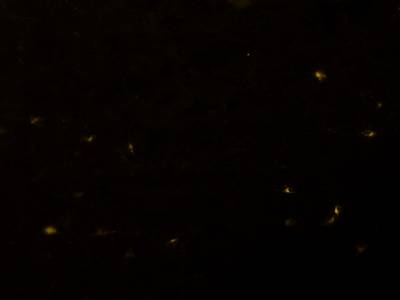
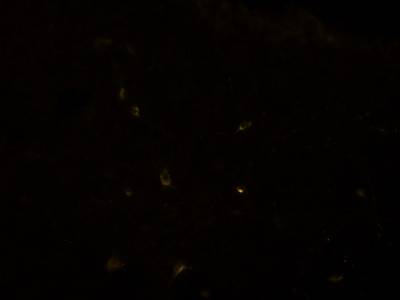
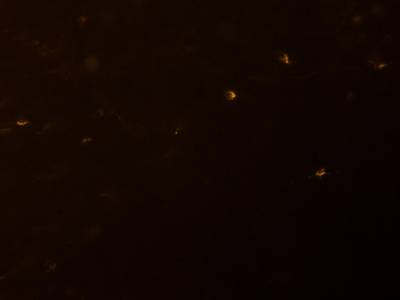
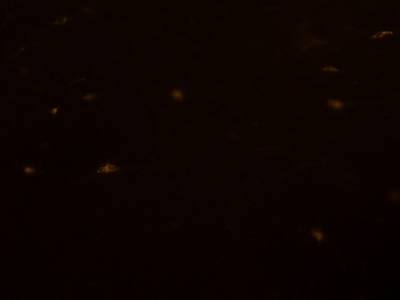
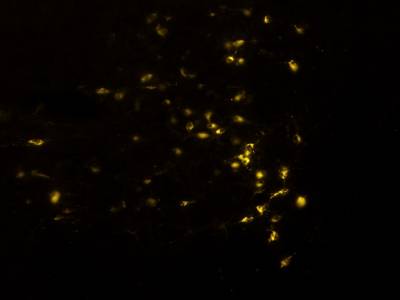
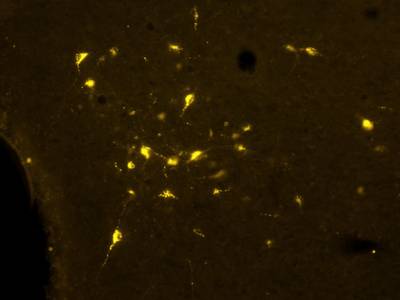
The Fluorescent Neuronal Cells dataset comprises 283 high-resolution images (1600 × 1200 pixels) of mice brain slices along with corresponding ground-truth labels. The experiments involved injecting a retrograde tracer (Cholera Toxin b, CTb) into specific brain structures of mice, highlighting neurons connected to the injection site. Fluorescence microscopy captured the neurons of interest as yellow-ish spots with varying brightness and saturation against a composite background.
Despite efforts to stabilize the acquisition process, the images present challenges due to variability in brightness, contrast, and saturation. The fluid nature of cell structures further complicates detection, as their shapes change significantly. Artifacts, biological structures like neurons’ filaments, and non-marked cells resembling stained ones also hinder recognition. Additionally, the number of target cells varies widely across images, necessitating high precision or recall depending on the density.
In the training phase, ground-truth labels serve as examples for the model to learn from. Binary masks are used for image segmentation, where objects and background are represented by white and black pixels, respectively.
To expedite labeling, an automatic procedure was employed. Gaussian blurring and thresholding were applied to identify potential cell candidates. Operators then reviewed results to remove false positives, and domain experts manually segmented remaining images. The dataset includes challenging examples with artifacts and crowded objects.
While Deep Learning is prominent in computer vision, the lack of annotated data hampers applications involving non-standard pictures. Models pre-trained on natural image datasets may not suit extraneous domains. By releasing their dataset and pre-trained model, the authors aim to accelerate biomedical imaging advancements and spur research on data analysis techniques for fluorescence microscopy and related domains.
 Homepage
 Research Paper
 GitHub
Summary #
Fluorescent Neuronal Cells is a dataset for instance segmentation, semantic segmentation, and object detection tasks. It is used in the neurobiological research.
The dataset consists of 283 images with 5533 labeled objects belonging to 1 single class (stained neuron).
Images in the Fluorescent Neuronal Cells dataset have pixel-level instance segmentation annotations. Due to the nature of the instance segmentation task, it can be automatically transformed into a semantic segmentation (only one mask for every class) or object detection (bounding boxes for every object) tasks. There are 50 (18% of the total) unlabeled images (i.e. without annotations). There are no pre-defined train/val/test splits in the dataset. The dataset was released in 2021 by the University of Bologna, Italy.
Explore #
Fluorescent Neuronal Cells dataset has 283 images. Click on one of the examples below or open "Explore" tool anytime you need to view dataset images with annotations. This tool has extended visualization capabilities like zoom, translation, objects table, custom filters and more. Hover the mouse over the images to hide or show annotations.


Class balance #
There are 1 annotation classes in the dataset. Find the general statistics and balances for every class in the table below. Click any row to preview images that have labels of the selected class. Sort by column to find the most rare or prevalent classes.

Class ㅤ | Images ㅤ | Objects ㅤ | Count on image average | Area on image average |
|---|---|---|---|---|
stained neuron➔ mask | 233 | 5533 | 23.75 | 0.74% |
Images #
Explore every single image in the dataset with respect to the number of annotations of each class it has. Click a row to preview selected image. Sort by any column to find anomalies and edge cases. Use horizontal scroll if the table has many columns for a large number of classes in the dataset.
Class sizes #
The table below gives various size properties of objects for every class. Click a row to see the image with annotations of the selected class. Sort columns to find classes with the smallest or largest objects or understand the size differences between classes.
Class | Object count | Avg area | Max area | Min area | Min height | Min height | Max height | Max height | Avg height | Avg height | Min width | Min width | Max width | Max width |
|---|---|---|---|---|---|---|---|---|---|---|---|---|---|---|
stained neuron mask | 5533 | 0.03% | 0.49% | 0% | 1px | 0.08% | 168px | 14% | 18px | 1.53% | 1px | 0.06% | 240px | 15% |
Spatial Heatmap #
The heatmaps below give the spatial distributions of all objects for every class. These visualizations provide insights into the most probable and rare object locations on the image. It helps analyze objects' placements in a dataset.
Objects #
Table contains all 5533 objects. Click a row to preview an image with annotations, and use search or pagination to navigate. Sort columns to find outliers in the dataset.
Object ID ㅤ | Class ㅤ | Image name click row to open | Image size height x width | Height ㅤ | Height ㅤ | Width ㅤ | Width ㅤ | Area ㅤ |
|---|---|---|---|---|---|---|---|---|
1➔ | stained neuron mask | Mar24bS2C4R3_DMr_200x_y.png | 1200 x 1600 | 83px | 6.92% | 83px | 5.19% | 0.2% |
2➔ | stained neuron mask | Mar24bS2C4R3_DMr_200x_y.png | 1200 x 1600 | 99px | 8.25% | 96px | 6% | 0.2% |
3➔ | stained neuron mask | Mar24bS2C4R3_DMr_200x_y.png | 1200 x 1600 | 65px | 5.42% | 84px | 5.25% | 0.2% |
4➔ | stained neuron mask | Mar24bS2C4R3_DMr_200x_y.png | 1200 x 1600 | 72px | 6% | 65px | 4.06% | 0.11% |
5➔ | stained neuron mask | Mar24bS2C4R3_DMr_200x_y.png | 1200 x 1600 | 87px | 7.25% | 89px | 5.56% | 0.21% |
6➔ | stained neuron mask | Mar20bS2C1R2_LHr_200x_y.png | 1200 x 1600 | 73px | 6.08% | 66px | 4.12% | 0.14% |
7➔ | stained neuron mask | Mar20bS2C1R2_LHr_200x_y.png | 1200 x 1600 | 96px | 8% | 63px | 3.94% | 0.14% |
8➔ | stained neuron mask | Mar20bS2C1R2_LHr_200x_y.png | 1200 x 1600 | 107px | 8.92% | 147px | 9.19% | 0.27% |
9➔ | stained neuron mask | Mar19bS1C5R2_DMr_200x_y.png | 1200 x 1600 | 94px | 7.83% | 79px | 4.94% | 0.22% |
10➔ | stained neuron mask | Mar19bS1C5R2_DMr_200x_y.png | 1200 x 1600 | 29px | 2.42% | 45px | 2.81% | 0.05% |
License #
Fluorescent Neuronal Cells is under CC BY-SA 4.0 license.
Citation #
If you make use of the Fluorescent Neuronal Cells data, please cite the following reference:
@unpublished{amsacta6706,
  title = {Fluorescent Neuronal Cells},
  note = {Unpublished},
  year = {2021},
  publisher = {University of Bologna},
  keywords = {semantic segmentation; object detection; object counting; neuronal cells; fluorescent microscopy},
  author = {Clissa, Luca and Morelli, Roberto and Squarcio, Fabio and Hitrec, Timna and Luppi, Marco and Rinaldi, Lorenzo and Cerri, Matteo and Amici, Roberto and Bastianini, Stefano and Berteotti, Chiara and Lo Martire, Viviana and Martelli, Davide and Occhinegro, Alessandra and Tupone, Domenico and Zoccoli, Giovanna and Zoccoli, Antonio},
  url = {https://amsacta.unibo.it/id/eprint/6706/},
  abstract = {By releasing this dataset, we aim at providing a new testbed for computer vision techniques using Deep Learning. The main peculiarity is the shift from the domain of "natural images" proper of common benchmark dataset to biological imaging. We anticipate that the advantages of doing so could be two-fold: i) fostering research in biomedical-related fields - for which popular pre-trained models perform typically poorly - and ii) promoting methodological research in deep learning by addressing peculiar requirements of these images. Possible applications include but are not limited to semantic segmentation, object detection and object counting. The data consist of 283 high-resolution pictures (1600x1200 pixels) of mice brain slices acquired through a fluorescence microscope. The final goal is to individuate and count neurons highlighted in the pictures by means of a marker, so to assess the result of a biological experiment. The corresponding ground-truth labels were generated through a hybrid approach involving semi-automatic and manual semantic segmentation. The result consists of black (0) and white (255) images having pixel-level annotations of where the stained neurons are located. For more information, please refer to Morelli, R. et al., 2021. Automating cell counting in fluorescent microscopy through deep learning with c-ResUnet. Scientific reports, (in press). https://doi.org/10.1038/s41598-021-01929-5. The collection of original images was supported by funding from the University of Bologna (RFO 2018) and the European Space Agency (Research agreement collaboration 4000123556).}
}
If you are happy with Dataset Ninja and use provided visualizations and tools in your work, please cite us:
@misc{ visualization-tools-for-fluorescent-neuronal-cells-dataset,
  title = { Visualization Tools for Fluorescent Neuronal Cells Dataset },
  type = { Computer Vision Tools },
  author = { Dataset Ninja },
  howpublished = { \url{ https://datasetninja.com/fluorescent-neuronal-cells } },
  url = { https://datasetninja.com/fluorescent-neuronal-cells },
  journal = { Dataset Ninja },
  publisher = { Dataset Ninja },
  year = { 2026 },
  month = { jul },
  note = { visited on 2026-07-31 },
}
Download #
Dataset Fluorescent Neuronal Cells can be downloaded in Supervisely format:
As an alternative, it can be downloaded with dataset-tools package:
pip install --upgrade dataset-tools
… using following python code:
import dataset_tools as dtools

dtools.download(dataset='Fluorescent Neuronal Cells', dst_dir='~/dataset-ninja/')
Make sure not to overlook the python code example available on the Supervisely Developer Portal. It will give you a clear idea of how to effortlessly work with the downloaded dataset.
The data in original format can be downloaded here.
Disclaimer #
Our gal from the legal dep told us we need to post this:
Dataset Ninja provides visualizations and statistics for some datasets that can be found online and can be downloaded by general audience. Dataset Ninja is not a dataset hosting platform and can only be used for informational purposes. The platform does not claim any rights for the original content, including images, videos, annotations and descriptions. Joint publishing is prohibited.
You take full responsibility when you use datasets presented at Dataset Ninja, as well as other information, including visualizations and statistics we provide. You are in charge of compliance with any dataset license and all other permissions. You are required to navigate datasets homepage and make sure that you can use it. In case of any questions, get in touch with us at hello@datasetninja.com.