

Introduction #
The authors built a new food image dataset FoodSeg103 Dataset containing 9,490 images. They annotate these images with 103 ingredient classes and each image has an average of 6 ingredient labels and pixel-wise masks. This dataset encompasses 7,118 images of Western cuisine, meticulously annotated with 103 distinct ingredient classes along with their corresponding segmentation masks.
Motivation
In recent years, food computing has garnered increasing attention from the public, serving as the backbone for advancements in food and health-related research and applications. A key objective within food computing is the automated recognition of various types of food and the profiling of their nutritional and caloric values. In the realm of computer vision, related endeavors encompass dish classification, recipe generation, and food image retrieval. However, the majority of these efforts focus on representing and analyzing food images as a whole entity, without explicitly localizing or classifying the individual ingredients comprising the cooked dish.
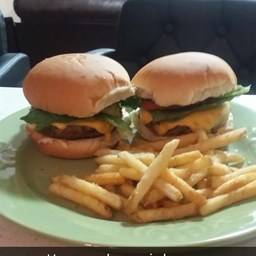
This distinction leads to two primary tasks: food image classification, which addresses the holistic identification of food items, and food image segmentation, which delves into the localization and classification of individual ingredients within the food image. Of the two, food image segmentation presents a greater level of complexity as it endeavors to discern each ingredient category and its respective pixel-wise locations within the food image. For instance, in an image depicting a “hamburger,” a proficient segmentation model would need to accurately delineate and mask out components like “beef,” “tomato,” “lettuce,” “onion,” and the “bread roll.”
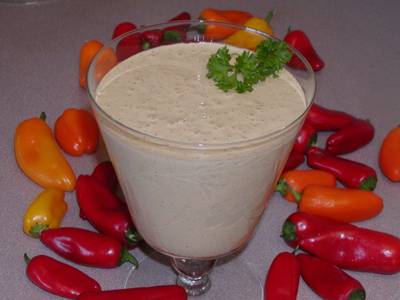
Compared to semantic segmentation tasks involving general object images, food image segmentation poses heightened challenges due to the vast diversity in food appearances and the often imbalanced distribution of ingredient categories. Firstly, ingredients cooked in various manners can exhibit significant visual disparities, complicating their identification. Additionally, certain ingredients may bear striking resemblances; for instance, “pineapples” cooked with meat might closely resemble “potatoes” cooked with meat, posing a challenge for differentiation. Secondly, food datasets commonly grapple with imbalanced distributions, both in terms of overall food classes and individual ingredient categories. This disparity arises due to two primary factors: Firstly, a few popular food classes dominate a large portion of food images, while the majority of food classes remain less represented. Secondly, a selection bias may exist in the construction of food image collections, further exacerbating the imbalance in class distribution.
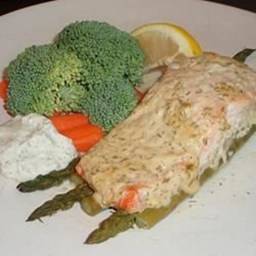
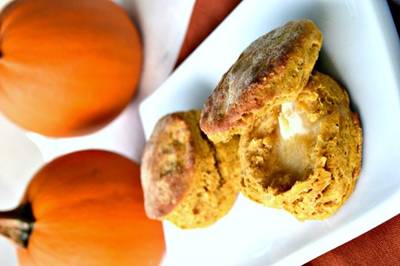
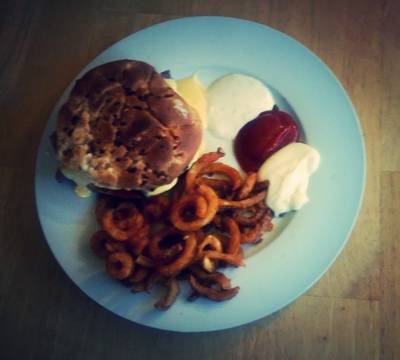
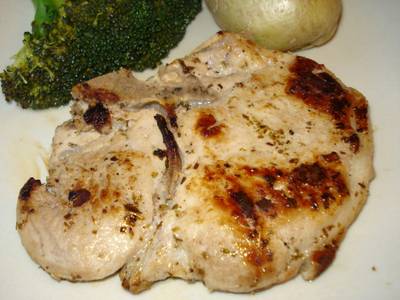
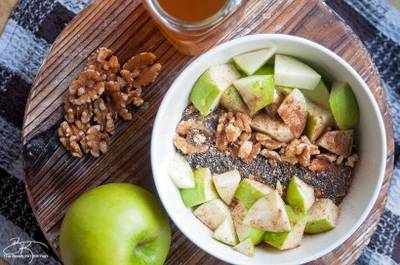
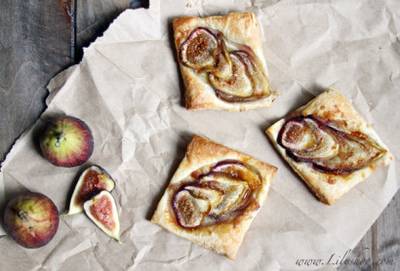
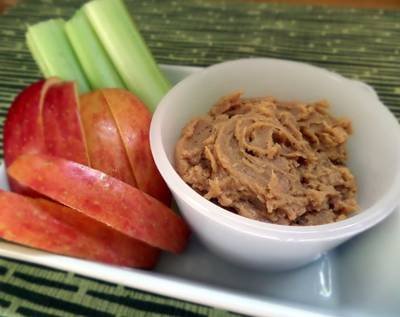
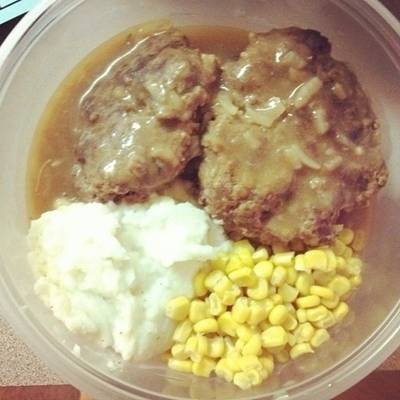
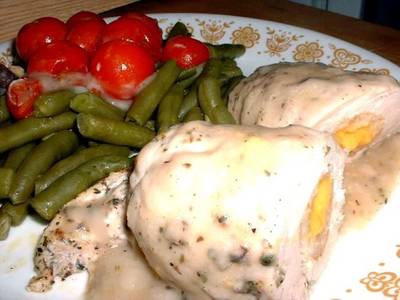
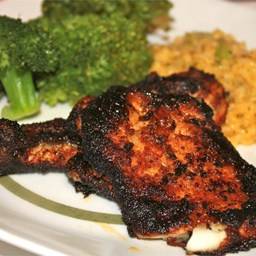
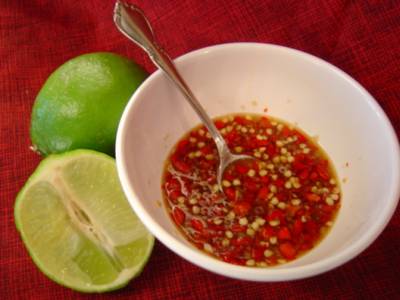
The first row shows a source image and its segmentation masks on our FoodSeg103. The second row shows example images to reveal the difficulties of food image segmentation, e.g., the pineapples in (a) and (b) look different, while the pineapple in (a) and the potato in (c) look quite similar.
Dataset description
To enable precise fine-grained food image segmentation, the authors have developed a comprehensive dataset known as FoodSeg103. This dataset encompasses 7,118 images of Western cuisine, meticulously annotated with 103 distinct ingredient classes along with their corresponding segmentation masks. The annotation process involved a meticulous approach, entailing careful data selection and iterative refinement of labels and masks to ensure the highest quality annotations. However, it’s worth noting that the annotation process undertaken by the authors was both resource-intensive and time-consuming. The source images utilized in constructing the FoodSeg103 dataset were sourced from an existing food dataset known as Recipe1M, which boasts millions of images and accompanying cooking recipes. These recipes not only detail the cooking instructions but also specify the ingredients used. Leveraging this auxiliary information, the authors incorporated recipe details into the training process of semantic segmentation models, thereby enhancing the model’s understanding of food composition and facilitating more accurate segmentation.
FoodSeg103 serves as a subset of the broader FoodSeg154 dataset, which encompasses an additional subset dedicated to Asian cuisine images and annotations. In dataset, the authors meticulously curated 7,118 images, defining 103 distinct ingredient categories and providing corresponding category labels along with segmentation masks. Additionally, within FoodSeg154, the authors collected a supplementary set comprising 2,372 images showcasing diverse Asian culinary offerings. This subset boasts a greater variety compared to the Western food images present in FoodSeg103. The authors specifically utilize this subset to assess the domain adaptation capabilities of their food image segmentation models. While FoodSeg103 is made publicly available to support research endeavors, the subset containing Asian food images cannot be released to the public at this time due to confidentiality constraints associated with the images.
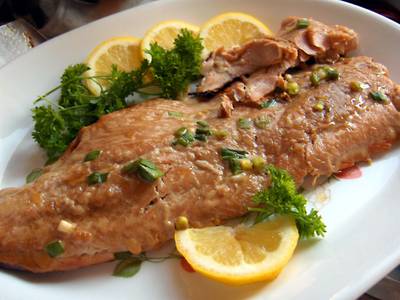
Foodseg103 examples: source images (left) and annotations (right).
The authors utilized FoodSeg103 as a case study to elucidate the process of constructing the dataset. They detailed the origins of the images, the compilation of ingredient categories, and the selection of images as follows:
- Image Source: The authors sourced images from Recipe1M, a dataset comprising 900k images featuring cooking instructions and ingredient labels. This dataset serves various purposes such as food image retrieval and recipe generation tasks.
- Categories: Initially, the authors surveyed the frequency of all ingredient categories within Recipe1M. Despite the dataset containing around 1.5k ingredient categories, many proved challenging to mask out from images effectively. Consequently, the authors streamlined the categories to retain only the top 124 (later refined to 103) ingredients. Any ingredients not falling under these categories were assigned to the other ingredients category.
- Image Selection: Within each fine-grained ingredient category, the authors sampled images from Recipe1M based on two criteria: 1) Each image should feature at least two ingredients, either of the same or different categories, with a maximum of 16 ingredients per image; and 2) The ingredients must be clearly visible and easily annotatable within the images. Following this selection process, the authors obtained 7,118 images for annotation with segmentation masks.
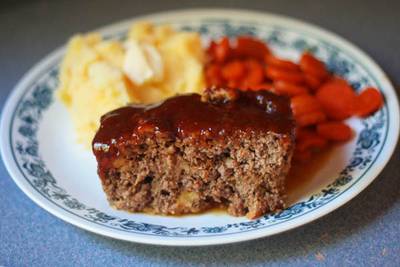
More annotation examples of FoodSeg103. The source images are in the left hand, while the annotation masks are in the right hand.
The subsequent phase involves annotating segmentation masks, which entails delineating polygons to cover the pixel-wise locations of various ingredients. This process comprises two main stages: annotation and refinement.
- Annotation: The authors enlisted the assistance of a data annotation company to undertake the meticulous task of mask annotation. Each image was meticulously examined by a human annotator, who initially identified the ingredient categories present, assigned the appropriate category label to each ingredient, and delineated the pixel-wise mask accordingly. Annotators were instructed to disregard minuscule image regions, even if they contained some ingredients, if their area covered less than 5% of the entire image.
- Refinement: Upon receiving all the masks from the annotation company, the authors proceeded with an extensive refinement process. This involved adhering to three primary refinement criteria: 1) rectifying any mislabeled data; 2) eliminating unpopular category labels assigned to fewer than 5 images; and 3) consolidating visually similar ingredient categories, such as merging “orange” and “citrus.” Following refinement, the initial set of 125 ingredient categories was streamlined to 103. The annotation and refinement endeavors spanned approximately one year.
Examples of dataset refinement. (a) sources images (b) before refinement (wrong or confusing labels exist), and (c) after refinement.
 Homepage
 Research Paper
 GitHub
Summary #
FoodSeg103 Dataset is a dataset for semantic segmentation and object detection tasks. It is used in the food industry.
The dataset consists of 7118 images with 26016 labeled objects belonging to 103 different classes including bread, carrot, chicken duck, and other: sauce, tomato, potato, steak, broccoli, ice cream, cilantro mint, rice, pork, lemon, lettuce, strawberry, pie, cucumber, onion, corn, cake, pepper, cheese butter, french beans, fish, biscuit, egg, asparagus, noodles, and 75 more.
Images in the FoodSeg103 dataset have pixel-level semantic segmentation annotations. All images are labeled (i.e. with annotations). There are 2 splits in the dataset: train (4983 images) and test (2135 images). Alternatively, the dataset could be split into 15 supercategories: vegetable (9635 objects), main (3665 objects), meat (3561 objects), fruit (3007 objects), dessert (2429 objects), sauce (1145 objects), beverage (714 objects), seafood (560 objects), fungus (303 objects), nut (299 objects), egg (292 objects), other ingredients (227 objects), soup (89 objects), tofu (68 objects), and salad (22 objects). The dataset was released in 2021 by the Management University, Singapore and Beijing Jiaotong University, China.
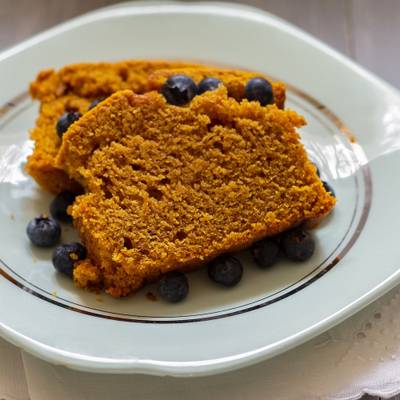
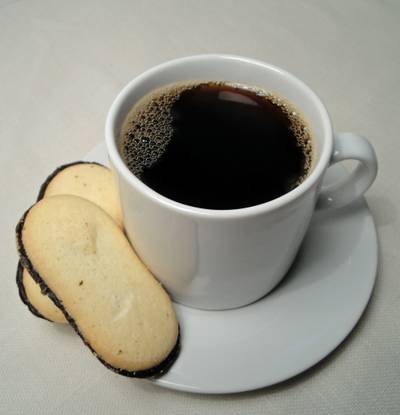
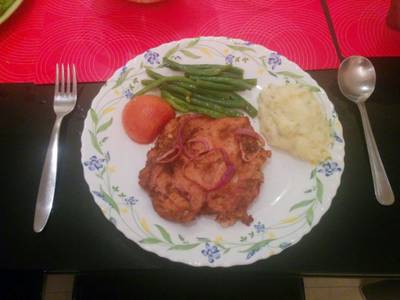
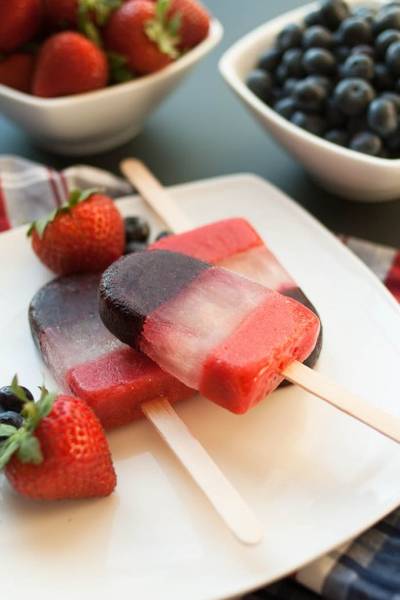
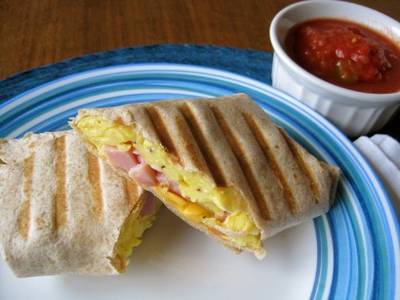
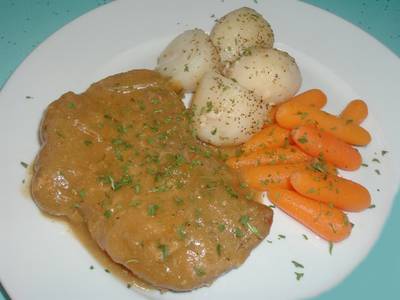
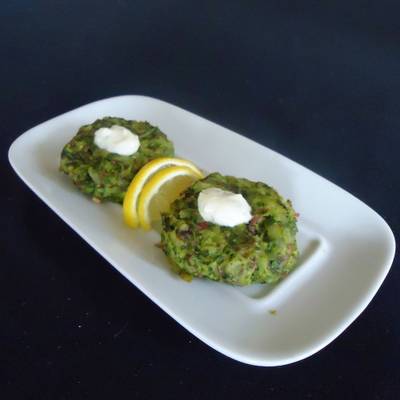
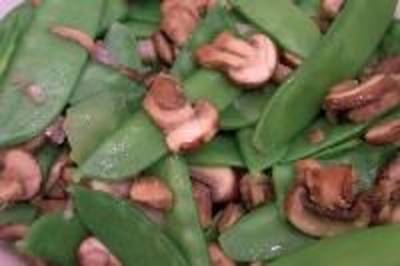
Here is a visualized example for randomly selected sample classes:
Explore #
FoodSeg103 dataset has 7118 images. Click on one of the examples below or open "Explore" tool anytime you need to view dataset images with annotations. This tool has extended visualization capabilities like zoom, translation, objects table, custom filters and more. Hover the mouse over the images to hide or show annotations.


Class balance #
There are 103 annotation classes in the dataset. Find the general statistics and balances for every class in the table below. Click any row to preview images that have labels of the selected class. Sort by column to find the most rare or prevalent classes.

Class ㅤ | Images ㅤ | Objects ㅤ | Count on image average | Area on image average |
|---|---|---|---|---|
bread➔ mask | 1405 | 1405 | 1 | 21.47% |
carrot➔ mask | 1279 | 1279 | 1 | 10.63% |
chicken duck➔ mask | 1242 | 1242 | 1 | 22.54% |
sauce➔ mask | 1145 | 1145 | 1 | 10.25% |
tomato➔ mask | 1139 | 1139 | 1 | 8.43% |
potato➔ mask | 1091 | 1091 | 1 | 14.79% |
steak➔ mask | 1065 | 1065 | 1 | 20.24% |
broccoli➔ mask | 1013 | 1013 | 1 | 12.73% |
ice cream➔ mask | 913 | 913 | 1 | 12.66% |
cilantro mint➔ mask | 900 | 900 | 1 | 7.32% |
Images #
Explore every single image in the dataset with respect to the number of annotations of each class it has. Click a row to preview selected image. Sort by any column to find anomalies and edge cases. Use horizontal scroll if the table has many columns for a large number of classes in the dataset.
Object distribution #
Interactive heatmap chart for every class with object distribution shows how many images are in the dataset with a certain number of objects of a specific class. Users can click cell and see the list of all corresponding images.
Class sizes #
The table below gives various size properties of objects for every class. Click a row to see the image with annotations of the selected class. Sort columns to find classes with the smallest or largest objects or understand the size differences between classes.
Class | Object count | Avg area | Max area | Min area | Min height | Min height | Max height | Max height | Avg height | Avg height | Min width | Min width | Max width | Max width |
|---|---|---|---|---|---|---|---|---|---|---|---|---|---|---|
bread mask | 1405 | 21.47% | 78.11% | 0% | 7px | 1.82% | 3479px | 100% | 351px | 62.31% | 1px | 0.2% | 4128px | 100% |
carrot mask | 1279 | 10.62% | 80.04% | 0.16% | 21px | 6% | 2706px | 100% | 231px | 46.78% | 18px | 3.52% | 3254px | 100% |
chicken duck mask | 1242 | 22.54% | 75.52% | 0.26% | 23px | 4.1% | 3873px | 100% | 411px | 58.98% | 56px | 5.61% | 3264px | 100% |
sauce mask | 1145 | 10.25% | 60.47% | 0.17% | 7px | 2.35% | 2806px | 100% | 234px | 39.25% | 18px | 5.77% | 2668px | 100% |
tomato mask | 1139 | 8.43% | 55.42% | 0.06% | 9px | 4.17% | 2417px | 100% | 221px | 40.86% | 11px | 3.43% | 3078px | 100% |
potato mask | 1091 | 14.79% | 70.2% | 0.36% | 26px | 6.77% | 3402px | 100% | 305px | 50.29% | 34px | 7.48% | 4128px | 100% |
steak mask | 1065 | 20.24% | 71.45% | 0.52% | 20px | 5.75% | 2430px | 100% | 299px | 55.04% | 55px | 8.9% | 3103px | 100% |
broccoli mask | 1013 | 12.73% | 89.4% | 0.03% | 10px | 2.94% | 2448px | 100% | 289px | 48.24% | 36px | 7.42% | 4056px | 100% |
ice cream mask | 913 | 12.66% | 79.22% | 0% | 1px | 0.3% | 2313px | 100% | 231px | 42.9% | 1px | 0.2% | 2734px | 100% |
cilantro mint mask | 900 | 7.32% | 57.18% | 0.15% | 23px | 7.05% | 3135px | 100% | 229px | 41.82% | 20px | 5.61% | 2915px | 100% |
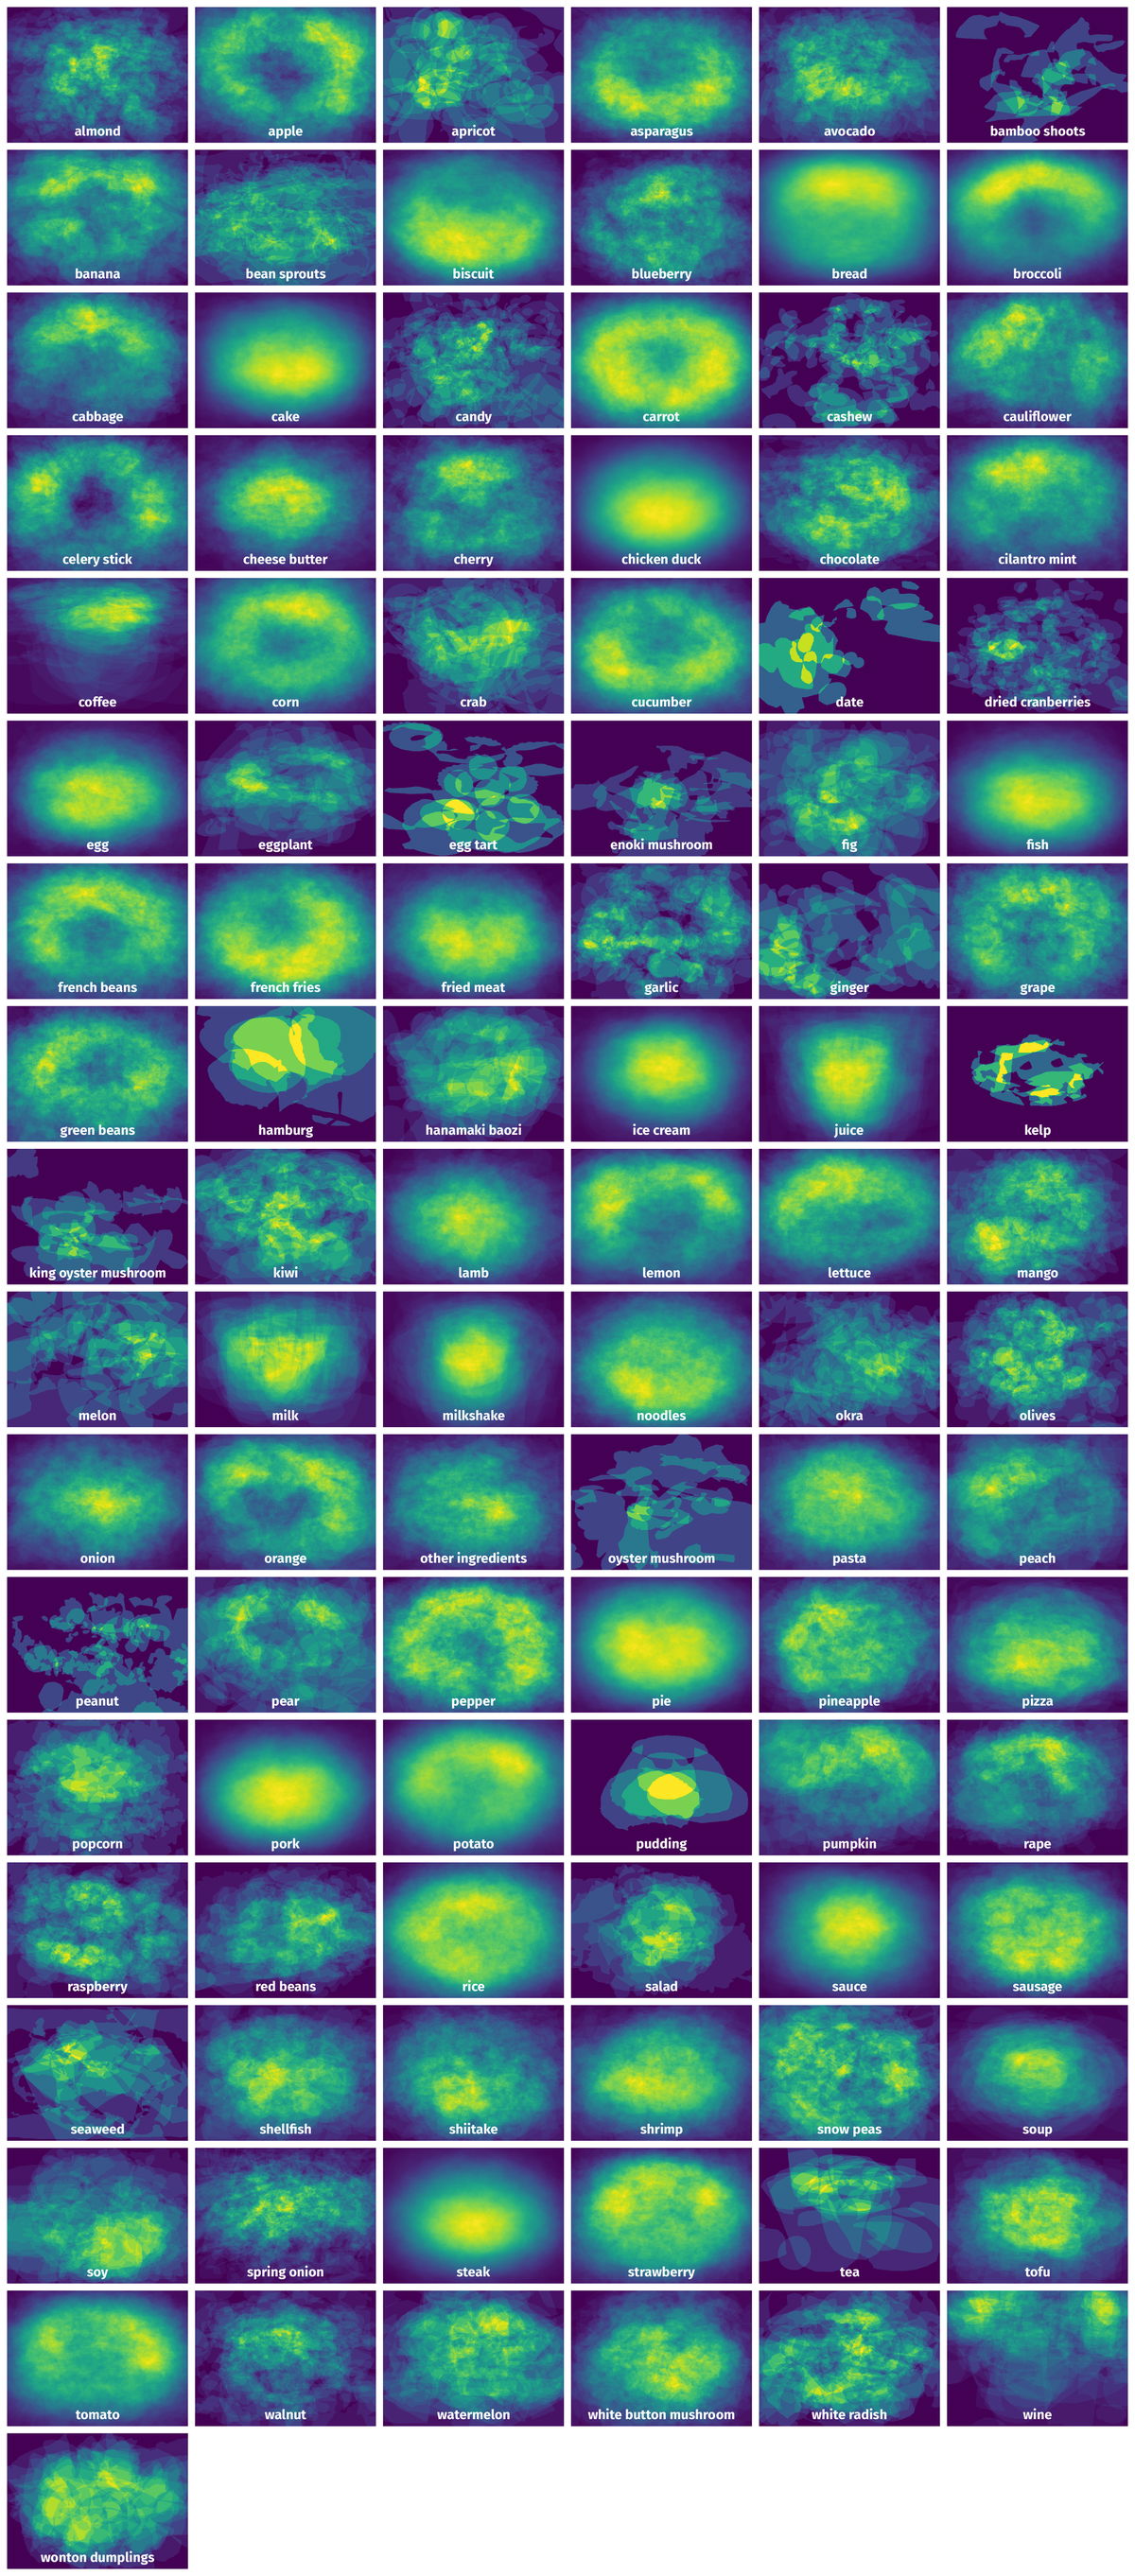
Spatial Heatmap #
The heatmaps below give the spatial distributions of all objects for every class. These visualizations provide insights into the most probable and rare object locations on the image. It helps analyze objects' placements in a dataset.
Objects #
Table contains all 26016 objects. Click a row to preview an image with annotations, and use search or pagination to navigate. Sort columns to find outliers in the dataset.
Object ID ㅤ | Class ㅤ | Image name click row to open | Image size height x width | Height ㅤ | Height ㅤ | Width ㅤ | Width ㅤ | Area ㅤ |
|---|---|---|---|---|---|---|---|---|
1➔ | orange mask | 00000794.jpg | 800 x 1280 | 285px | 35.62% | 340px | 26.56% | 4.12% |
2➔ | chicken duck mask | 00000794.jpg | 800 x 1280 | 570px | 71.25% | 820px | 64.06% | 30.37% |
3➔ | sauce mask | 00000794.jpg | 800 x 1280 | 26px | 3.25% | 144px | 11.25% | 0.24% |
4➔ | other ingredients mask | 00000794.jpg | 800 x 1280 | 337px | 42.12% | 1018px | 79.53% | 9.8% |
5➔ | grape mask | 00001420.jpg | 410 x 512 | 180px | 43.9% | 297px | 58.01% | 18.21% |
6➔ | chicken duck mask | 00001420.jpg | 410 x 512 | 290px | 70.73% | 512px | 100% | 44.73% |
7➔ | potato mask | 00001420.jpg | 410 x 512 | 238px | 58.05% | 223px | 43.55% | 18.51% |
8➔ | egg mask | 00001681.jpg | 256 x 256 | 113px | 44.14% | 109px | 42.58% | 12.14% |
9➔ | pork mask | 00001681.jpg | 256 x 256 | 138px | 53.91% | 135px | 52.73% | 19.65% |
10➔ | carrot mask | 00001681.jpg | 256 x 256 | 73px | 28.52% | 87px | 33.98% | 5.83% |
License #
FoodSeg103 Dataset is under Apache 2.0 license.
Citation #
If you make use of the FoodSeg103 data, please cite the following reference:
@inproceedings{wu2021foodseg,
	title={A Large-Scale Benchmark for Food Image Segmentation},
	author={Wu, Xiongwei and Fu, Xin and Liu, Ying and Lim, Ee-Peng and Hoi, Steven CH and Sun, Qianru},
	booktitle={Proceedings of ACM international conference on Multimedia},
	year={2021}
}
If you are happy with Dataset Ninja and use provided visualizations and tools in your work, please cite us:
@misc{ visualization-tools-for-food-seg-dataset,
  title = { Visualization Tools for FoodSeg103 Dataset },
  type = { Computer Vision Tools },
  author = { Dataset Ninja },
  howpublished = { \url{ https://datasetninja.com/food-seg-103 } },
  url = { https://datasetninja.com/food-seg-103 },
  journal = { Dataset Ninja },
  publisher = { Dataset Ninja },
  year = { 2026 },
  month = { jul },
  note = { visited on 2026-07-23 },
}
Download #
Dataset FoodSeg103 can be downloaded in Supervisely format:
As an alternative, it can be downloaded with dataset-tools package:
pip install --upgrade dataset-tools
… using following python code:
import dataset_tools as dtools

dtools.download(dataset='FoodSeg103', dst_dir='~/dataset-ninja/')
Make sure not to overlook the python code example available on the Supervisely Developer Portal. It will give you a clear idea of how to effortlessly work with the downloaded dataset.
The data in original format can be downloaded here.
Disclaimer #
Our gal from the legal dep told us we need to post this:
Dataset Ninja provides visualizations and statistics for some datasets that can be found online and can be downloaded by general audience. Dataset Ninja is not a dataset hosting platform and can only be used for informational purposes. The platform does not claim any rights for the original content, including images, videos, annotations and descriptions. Joint publishing is prohibited.
You take full responsibility when you use datasets presented at Dataset Ninja, as well as other information, including visualizations and statistics we provide. You are in charge of compliance with any dataset license and all other permissions. You are required to navigate datasets homepage and make sure that you can use it. In case of any questions, get in touch with us at hello@datasetninja.com.