
Introduction #
The authors separate datasets were compiled: FruitNet and FruitBox Dataset. They proposed an interlaced deep neural framework that aids in the accurate qualitative (freshness—good/bad) and quantitative (weights in kilograms) predictive analysis of tropical fruits and their origin in wholesale and retail fruit boxes.
Motivation
Fruits have always played a vital role in maintaining a healthy diet, and preserving their quality is paramount for individuals’ well-being. The prevalence of consumerism has significantly impacted the production sector, leading to the packaging of fruits in containers and boxes by manufacturers. Accurately determining the precise weights of these fruit containers is essential to ensure transparency and fairness. Traditional techniques are time and cost-consuming and may even result in weight manipulation due to their inefficiency. Fruits can be graded according to their physical characteristics to help determine their freshness; however, this method requires a lot of manual labor. The issue of estimating the quantity and freshness of eatable produce only from images is complex, and no compelling study has been researched and developed.
The proposed solution employs an integrated deep neural architecture to facilitate precise identification of fruits within wholesale fruit boxes, followed by comprehensive qualitative and quantitative predictive analysis. Furthermore, the algorithm takes into account various fruit classes to determine the weight of the box and ascertain its origin. This adaptable technique holds promise for diverse wholesale sectors. Its primary aim is to supplant manual inspection methods entirely with more efficient and cost-effective alternatives, thus significantly reducing expenses associated with manual inspection. The development of fruit classification systems has been driven by the needs of industrial settings such as factories and hypermarkets, where accurate sorting of different fruit varieties is paramount. Recent progress, achieved by integrating public benchmark datasets with cutting-edge convolutional neural networks (CNNs), has led to the deployment of highly accurate fruit classification models. A comprehensive dataset was compiled by amalgamating high-quality fruit images captured physically with images scraped from public sources, with a focus on including non-curated images in automated systems. To tackle data scarcity, researchers have explored the use of generative models in addition to traditional data augmentation techniques. Initial studies focused on using shape and size features to detect and localize fruits on plants. Gradually, solutions shifted toward the utilization of deep neural architectures.
Dataset description
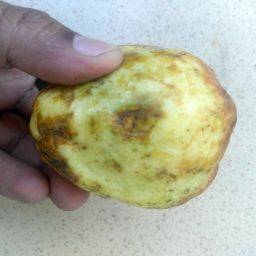
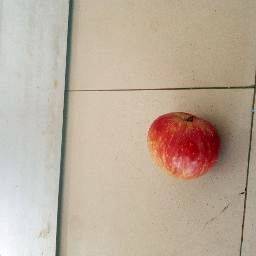
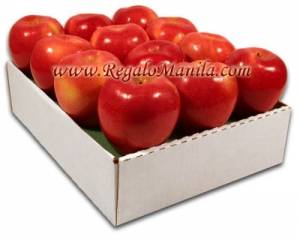
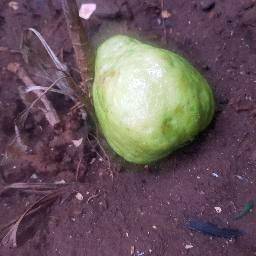
Separate datasets were curated to develop an accurate quality recognition system, estimate weight measures, and determine geographic origin. The annotated FruitNet dataset was compiled by localizing annotations on fruit classes in the FruitNet dataset. To streamline the process of fruit box detection, the authors enhanced the quality detector training to include box detections, thereby collecting and annotating images of containersand baskets of apples from market traders. The instances were manually labeled using the LabelImg tool within the Python environment. The initial dataset comprised images depicting various qualities of six different fruits, captured from diverse angles and backgrounds. This study focuses on three specific fruit categories that share similar shapes and possess an adequate number of instances. The objective is to discern and categorize the quality of individual fruits within a fruit box as either good or bad. Specifically, the authors chose images containing solitary instances of apples, oranges, and guavas. Moreover, meticulous annotation was applied to the apples within containers and fruit boxes to facilitate grading detection. The FruitBox dataset was meticulously compiled, featuring containerized apples along with their corresponding weights, obtained using a 12-megapixel camera from trading stores and markets. To enrich the dataset, images of fruit boxes were sourced through web scraping. Annotations generated from the object detection model assisted in determining the regions of interest for weight calculation. This comprehensive dataset comprises 2052 instances of fruit boxes, each accompanied by its measured weight in kilograms.
The Fruit360 dataset, containing 131 different fruit types, was utilized for the recognition of fruit variants and their respective origins. Specifically, eight variants of apples originating from six different countries were grouped together to estimate the origins of fruit boxes. These variants were then divided into training and testing sets to aid in the learning process. The model’s versatility allows for easy transferability to different fruit types, depending on the specific fruits contained within the boxes.
 Homepage
 Research Paper
Summary #
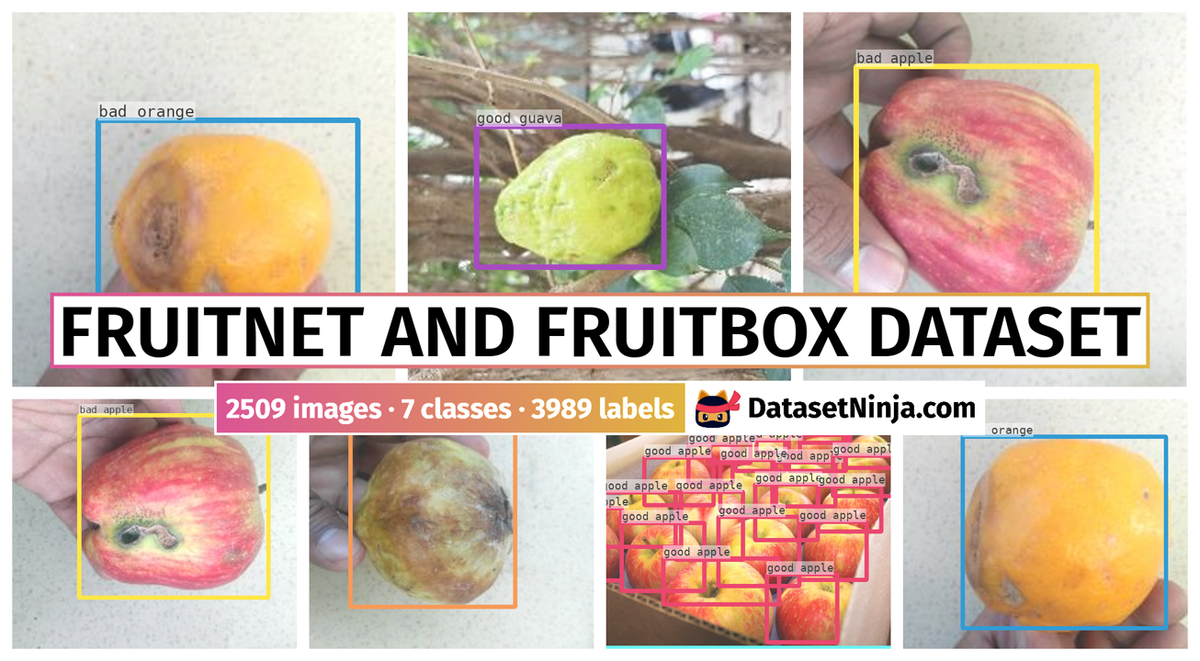
FruitNet and FruitBox Dataset is a dataset for object detection and identification tasks. It is used in the food industry.
The dataset consists of 2509 images with 3989 labeled objects belonging to 7 different classes including good apple, bad guava, good guava, and other: bad apple, bad orange, fruit box, and good orange.
Images in the FruitNet and FruitBox Dataset dataset have bounding box annotations. There are 1076 (43% of the total) unlabeled images (i.e. without annotations). There are 3 splits in the dataset: fruit box (1075 images), fruit net train (907 images), and fruit net val (527 images). Additionally, some images marked with its weight tag. The dataset was released in 2023 by the University of Kerala, India.
Explore #
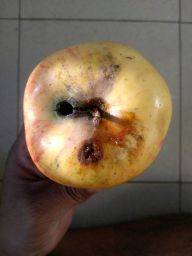
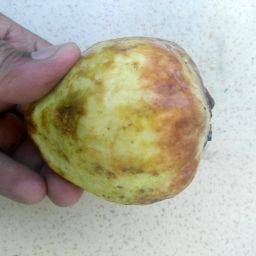
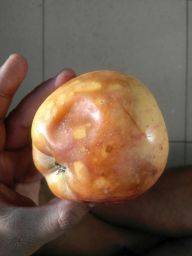
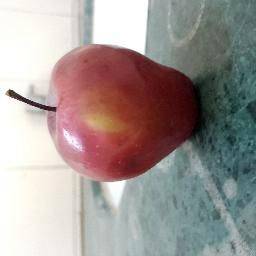
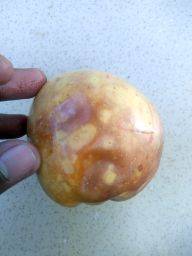
FruitNet and FruitBox Dataset dataset has 2509 images. Click on one of the examples below or open "Explore" tool anytime you need to view dataset images with annotations. This tool has extended visualization capabilities like zoom, translation, objects table, custom filters and more. Hover the mouse over the images to hide or show annotations.


Class balance #
There are 7 annotation classes in the dataset. Find the general statistics and balances for every class in the table below. Click any row to preview images that have labels of the selected class. Sort by column to find the most rare or prevalent classes.

Class ㅤ | Images ㅤ | Objects ㅤ | Count on image average | Area on image average |
|---|---|---|---|---|
good apple➔ rectangle | 438 | 2368 | 5.41 | 25.91% |
bad guava➔ rectangle | 303 | 303 | 1 | 38.25% |
good guava➔ rectangle | 281 | 734 | 2.61 | 27.66% |
bad apple➔ rectangle | 197 | 197 | 1 | 46.36% |
bad orange➔ rectangle | 189 | 189 | 1 | 27.23% |
fruit box➔ rectangle | 172 | 172 | 1 | 69.05% |
good orange➔ rectangle | 26 | 26 | 1 | 26.31% |
Co-occurrence matrix #
Co-occurrence matrix is an extremely valuable tool that shows you the images for every pair of classes: how many images have objects of both classes at the same time. If you click any cell, you will see those images. We added the tooltip with an explanation for every cell for your convenience, just hover the mouse over a cell to preview the description.
Images #
Explore every single image in the dataset with respect to the number of annotations of each class it has. Click a row to preview selected image. Sort by any column to find anomalies and edge cases. Use horizontal scroll if the table has many columns for a large number of classes in the dataset.
Object distribution #
Interactive heatmap chart for every class with object distribution shows how many images are in the dataset with a certain number of objects of a specific class. Users can click cell and see the list of all corresponding images.
Class sizes #
The table below gives various size properties of objects for every class. Click a row to see the image with annotations of the selected class. Sort columns to find classes with the smallest or largest objects or understand the size differences between classes.
Class | Object count | Avg area | Max area | Min area | Min height | Min height | Max height | Max height | Avg height | Avg height | Min width | Min width | Max width | Max width |
|---|---|---|---|---|---|---|---|---|---|---|---|---|---|---|
good apple rectangle | 2368 | 5.22% | 52.1% | 0% | 1px | 0.44% | 502px | 75.78% | 89px | 19.14% | 1px | 0.28% | 508px | 71.88% |
good guava rectangle | 734 | 10.8% | 58.34% | 0% | 1px | 0.53% | 383px | 79.3% | 105px | 26.34% | 1px | 0.38% | 399px | 89.84% |
bad guava rectangle | 303 | 38.25% | 64.26% | 16.49% | 94px | 36.72% | 195px | 76.17% | 157px | 61.34% | 111px | 43.36% | 226px | 88.28% |
bad apple rectangle | 197 | 46.36% | 74.51% | 13.19% | 94px | 36.72% | 226px | 88.28% | 159px | 62.26% | 91px | 35.55% | 229px | 89.45% |
bad orange rectangle | 189 | 27.23% | 41.02% | 20.49% | 94px | 36.72% | 143px | 55.86% | 114px | 44.47% | 95px | 49.48% | 150px | 78.12% |
fruit box rectangle | 172 | 69.05% | 100% | 28.44% | 103px | 34.68% | 1341px | 100% | 457px | 83.12% | 121px | 44% | 2489px | 100% |
good orange rectangle | 26 | 26.31% | 36.18% | 0.78% | 20px | 5% | 156px | 60.94% | 132px | 51.34% | 42px | 15.67% | 152px | 59.38% |
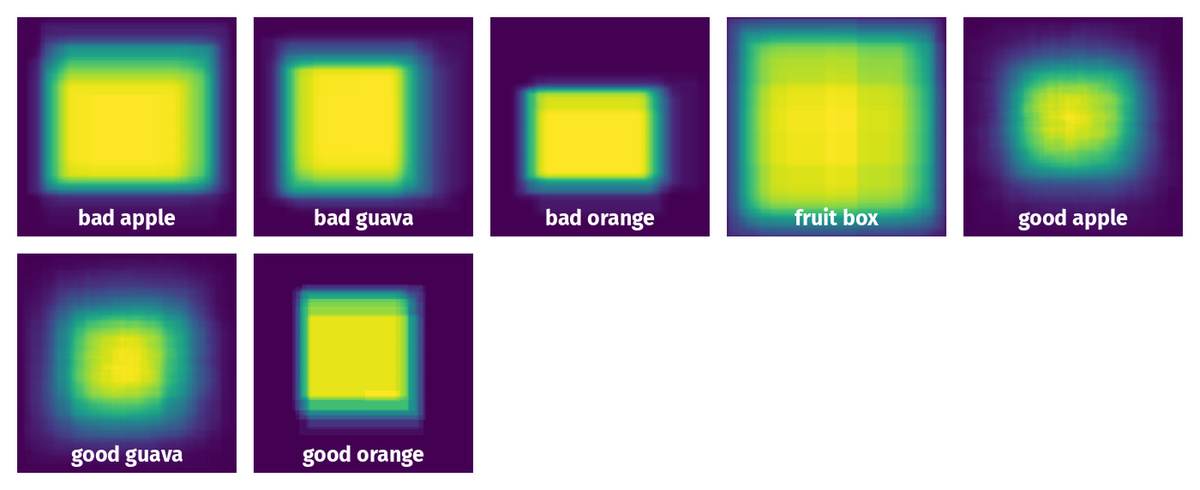
Spatial Heatmap #
The heatmaps below give the spatial distributions of all objects for every class. These visualizations provide insights into the most probable and rare object locations on the image. It helps analyze objects' placements in a dataset.
Objects #
Table contains all 3989 objects. Click a row to preview an image with annotations, and use search or pagination to navigate. Sort columns to find outliers in the dataset.
Object ID ㅤ | Class ㅤ | Image name click row to open | Image size height x width | Height ㅤ | Height ㅤ | Width ㅤ | Width ㅤ | Area ㅤ |
|---|---|---|---|---|---|---|---|---|
1➔ | fruit box rectangle | Image_121.jpg | 178 x 284 | 144px | 80.9% | 258px | 90.85% | 73.49% |
2➔ | good apple rectangle | Image_121.jpg | 178 x 284 | 53px | 29.78% | 69px | 24.3% | 7.23% |
3➔ | good apple rectangle | Image_121.jpg | 178 x 284 | 51px | 28.65% | 75px | 26.41% | 7.57% |
4➔ | good apple rectangle | Image_121.jpg | 178 x 284 | 68px | 38.2% | 85px | 29.93% | 11.43% |
5➔ | good apple rectangle | Image_121.jpg | 178 x 284 | 65px | 36.52% | 74px | 26.06% | 9.51% |
6➔ | bad guava rectangle | IMG_20190822_080331_1.jpg | 256 x 256 | 166px | 64.84% | 186px | 72.66% | 47.11% |
7➔ | bad orange rectangle | IMG_20190824_174852.jpg | 256 x 192 | 117px | 45.7% | 116px | 60.42% | 27.61% |
8➔ | good apple rectangle | 20190809_161600.jpg | 256 x 256 | 115px | 44.92% | 131px | 51.17% | 22.99% |
9➔ | bad orange rectangle | IMG_20190824_174928.jpg | 256 x 192 | 106px | 41.41% | 110px | 57.29% | 23.72% |
10➔ | fruit box rectangle | Image_136.jpg | 225 x 225 | 221px | 98.22% | 215px | 95.56% | 93.86% |
License #
License is unknown for the FruitNet and FruitBox Dataset dataset.
Citation #
If you make use of the FruitNet and FruitBox Dataset data, please cite the following reference:
@dataset{FruitNet and FruitBox Dataset,
  author={Misaj Sharafudeen and Vinod Chandra},
  title={FruitNet and FruitBox Dataset},
  year={2023},
  url={https://www.kaggle.com/datasets/mirlab/annotated-fruitnet-and-fruitbox}
}
If you are happy with Dataset Ninja and use provided visualizations and tools in your work, please cite us:
@misc{ visualization-tools-for-fruit-net-box-dataset,
  title = { Visualization Tools for FruitNet and FruitBox Dataset Dataset },
  type = { Computer Vision Tools },
  author = { Dataset Ninja },
  howpublished = { \url{ https://datasetninja.com/fruit-net-box } },
  url = { https://datasetninja.com/fruit-net-box },
  journal = { Dataset Ninja },
  publisher = { Dataset Ninja },
  year = { 2026 },
  month = { jul },
  note = { visited on 2026-07-20 },
}
Download #
Please visit dataset homepage to download the data.
Disclaimer #
Our gal from the legal dep told us we need to post this:
Dataset Ninja provides visualizations and statistics for some datasets that can be found online and can be downloaded by general audience. Dataset Ninja is not a dataset hosting platform and can only be used for informational purposes. The platform does not claim any rights for the original content, including images, videos, annotations and descriptions. Joint publishing is prohibited.
You take full responsibility when you use datasets presented at Dataset Ninja, as well as other information, including visualizations and statistics we provide. You are in charge of compliance with any dataset license and all other permissions. You are required to navigate datasets homepage and make sure that you can use it. In case of any questions, get in touch with us at hello@datasetninja.com.