
Summary #
 Homepage
Fruit Object Detection is a dataset for an object detection task. Possible applications of the dataset could be in the food industry.
The dataset consists of 4474 images with 22576 labeled objects belonging to 11 different classes including pear, apple, grape, and other: pineapple, durian, korean melon, watermelon, tangerine, lemon, cantaloupe, and dragon fruit.
Images in the Fruit Object Detection dataset have bounding box annotations. All images are labeled (i.e. with annotations). There are 2 splits in the dataset: train (3836 images) and valid (638 images). The dataset was released in 2022.
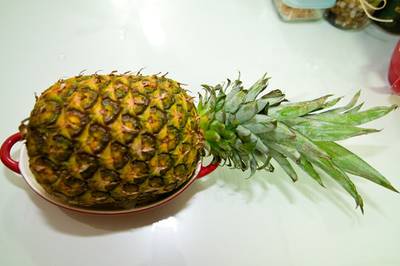
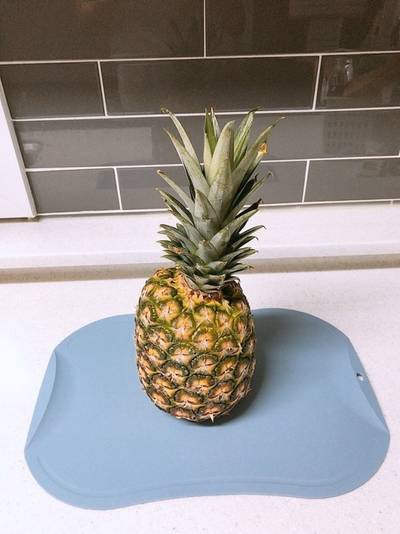
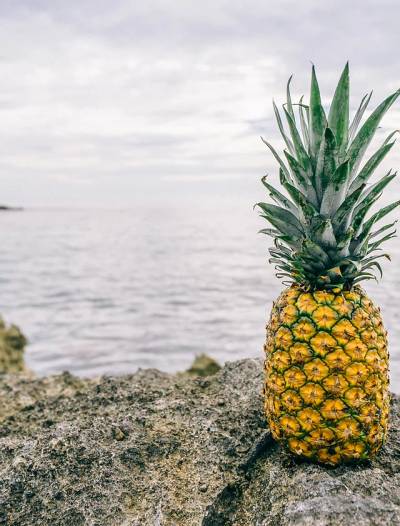
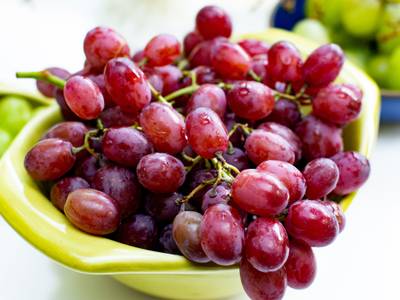
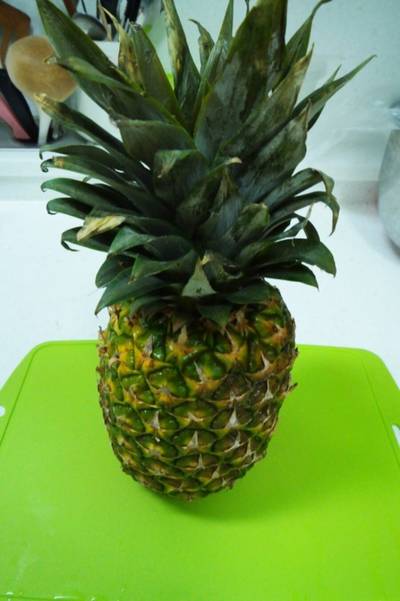
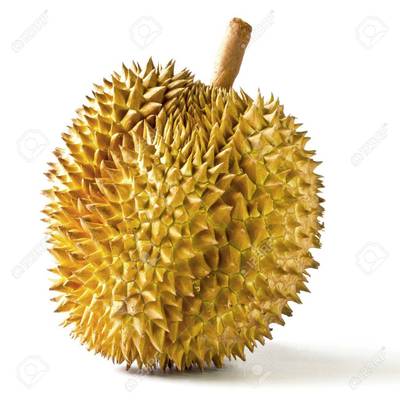
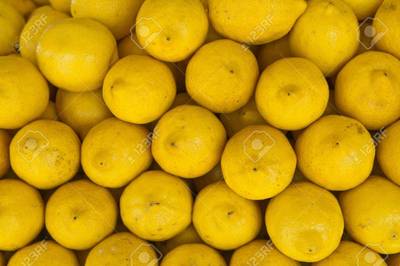
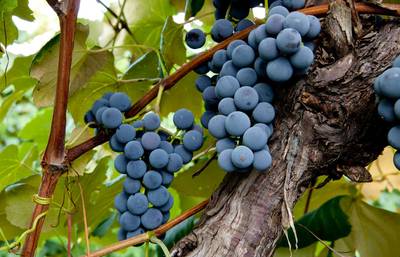
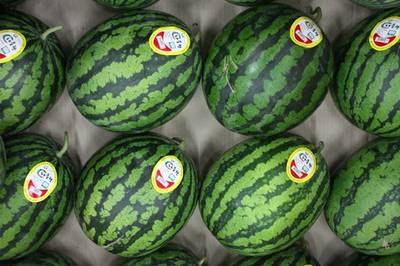
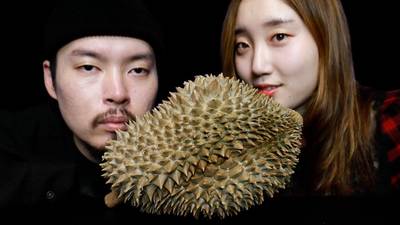
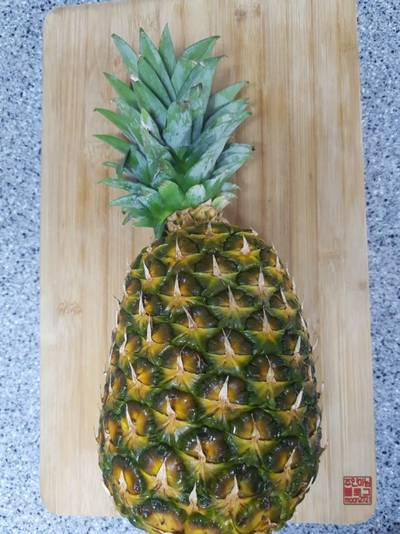
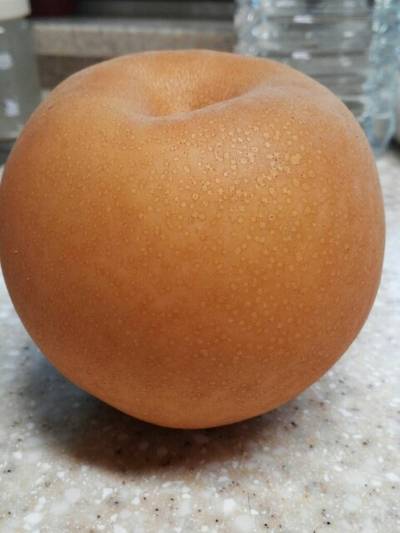
Here are the visualized examples for the classes:
Explore #
Fruit Object Detection dataset has 4474 images. Click on one of the examples below or open "Explore" tool anytime you need to view dataset images with annotations. This tool has extended visualization capabilities like zoom, translation, objects table, custom filters and more. Hover the mouse over the images to hide or show annotations.


Class balance #
There are 11 annotation classes in the dataset. Find the general statistics and balances for every class in the table below. Click any row to preview images that have labels of the selected class. Sort by column to find the most rare or prevalent classes.

Class ㅤ | Images ㅤ | Objects ㅤ | Count on image average | Area on image average |
|---|---|---|---|---|
pear➔ rectangle | 638 | 3280 | 5.14 | 38.22% |
apple➔ rectangle | 557 | 2570 | 4.61 | 44.72% |
grape➔ rectangle | 494 | 1216 | 2.46 | 47.98% |
pineapple➔ rectangle | 483 | 1745 | 3.61 | 26.76% |
durian➔ rectangle | 432 | 2908 | 6.73 | 48.58% |
korean melon➔ rectangle | 388 | 2651 | 6.83 | 46.53% |
watermelon➔ rectangle | 381 | 1627 | 4.27 | 44.98% |
tangerine➔ rectangle | 359 | 2907 | 8.1 | 39.69% |
lemon➔ rectangle | 298 | 1205 | 4.04 | 29.73% |
cantaloupe➔ rectangle | 277 | 810 | 2.92 | 34.62% |
Co-occurrence matrix #
Co-occurrence matrix is an extremely valuable tool that shows you the images for every pair of classes: how many images have objects of both classes at the same time. If you click any cell, you will see those images. We added the tooltip with an explanation for every cell for your convenience, just hover the mouse over a cell to preview the description.
Images #
Explore every single image in the dataset with respect to the number of annotations of each class it has. Click a row to preview selected image. Sort by any column to find anomalies and edge cases. Use horizontal scroll if the table has many columns for a large number of classes in the dataset.
Class sizes #
The table below gives various size properties of objects for every class. Click a row to see the image with annotations of the selected class. Sort columns to find classes with the smallest or largest objects or understand the size differences between classes.
Class | Object count | Avg area | Max area | Min area | Min height | Min height | Max height | Max height | Avg height | Avg height | Min width | Min width | Max width | Max width |
|---|---|---|---|---|---|---|---|---|---|---|---|---|---|---|
pear rectangle | 3280 | 8.1% | 95.39% | 0.18% | 13px | 5% | 772px | 100% | 111px | 26.09% | 19px | 3.61% | 856px | 100% |
durian rectangle | 2908 | 8.28% | 99.67% | 0.09% | 10px | 2.4% | 2623px | 100% | 155px | 28.63% | 11px | 1.85% | 3304px | 100% |
tangerine rectangle | 2907 | 5.4% | 93.43% | 0.09% | 12px | 2.46% | 1097px | 96.9% | 109px | 21.52% | 14px | 2.46% | 1452px | 96.41% |
korean melon rectangle | 2651 | 7.79% | 64.06% | 0.03% | 16px | 1% | 773px | 100% | 151px | 25.45% | 13px | 2.09% | 981px | 100% |
apple rectangle | 2570 | 10.6% | 95.38% | 0.05% | 13px | 2.36% | 3471px | 98.07% | 181px | 30.65% | 11px | 1.77% | 3431px | 100% |
pineapple rectangle | 1745 | 7.6% | 87.96% | 0.13% | 13px | 4.5% | 1299px | 100% | 169px | 25.7% | 13px | 1.92% | 1350px | 100% |
dragon fruit rectangle | 1657 | 5.36% | 85.36% | 0.17% | 13px | 2.84% | 3060px | 98.38% | 150px | 21.79% | 11px | 3.33% | 2312px | 89.12% |
watermelon rectangle | 1627 | 11.44% | 100% | 0.09% | 18px | 2.62% | 2146px | 100% | 208px | 33.06% | 20px | 2.58% | 2091px | 100% |
grape rectangle | 1216 | 20.19% | 100% | 0.01% | 8px | 2.01% | 3234px | 100% | 312px | 49.65% | 4px | 0.67% | 2266px | 100% |
lemon rectangle | 1205 | 7.98% | 96.53% | 0.3% | 12px | 4.38% | 1172px | 98.3% | 161px | 27.55% | 13px | 4.55% | 1127px | 98.2% |
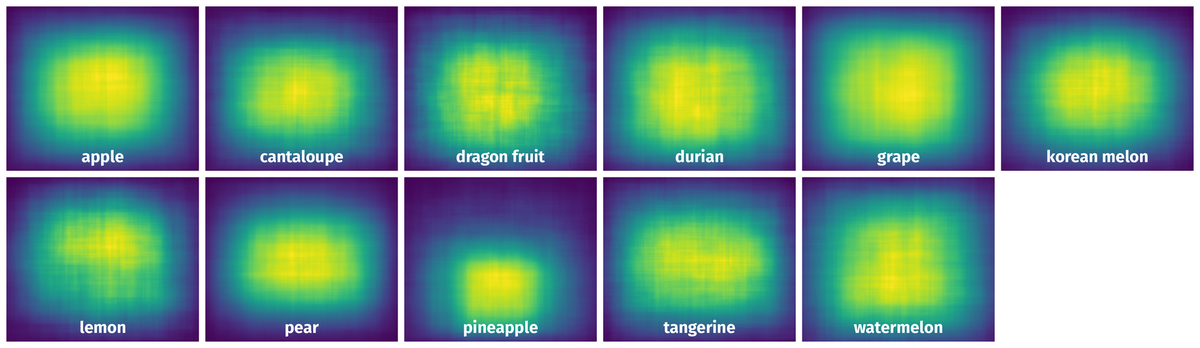
Spatial Heatmap #
The heatmaps below give the spatial distributions of all objects for every class. These visualizations provide insights into the most probable and rare object locations on the image. It helps analyze objects' placements in a dataset.
Objects #
Table contains all 22576 objects. Click a row to preview an image with annotations, and use search or pagination to navigate. Sort columns to find outliers in the dataset.
Object ID ㅤ | Class ㅤ | Image name click row to open | Image size height x width | Height ㅤ | Height ㅤ | Width ㅤ | Width ㅤ | Area ㅤ |
|---|---|---|---|---|---|---|---|---|
1➔ | korean melon rectangle | 0428.jpg | 1200 x 1500 | 341px | 28.42% | 255px | 17% | 4.83% |
2➔ | korean melon rectangle | 0428.jpg | 1200 x 1500 | 310px | 25.83% | 254px | 16.93% | 4.37% |
3➔ | korean melon rectangle | 0428.jpg | 1200 x 1500 | 233px | 19.42% | 307px | 20.47% | 3.97% |
4➔ | korean melon rectangle | 0428.jpg | 1200 x 1500 | 352px | 29.33% | 293px | 19.53% | 5.73% |
5➔ | korean melon rectangle | 0428.jpg | 1200 x 1500 | 269px | 22.42% | 228px | 15.2% | 3.41% |
6➔ | korean melon rectangle | 0428.jpg | 1200 x 1500 | 386px | 32.17% | 200px | 13.33% | 4.29% |
7➔ | korean melon rectangle | 0428.jpg | 1200 x 1500 | 415px | 34.58% | 248px | 16.53% | 5.72% |
8➔ | pear rectangle | val0135.jpg | 183 x 275 | 91px | 49.73% | 97px | 35.27% | 17.54% |
9➔ | pear rectangle | val0135.jpg | 183 x 275 | 92px | 50.27% | 95px | 34.55% | 17.37% |
10➔ | cantaloupe rectangle | 0098.jpg | 600 x 600 | 343px | 57.17% | 324px | 54% | 30.87% |
License #
License is unknown for the Fruit Object Detection dataset.
Citation #
If you make use of the Fruit Object Detection data, please cite the following reference:
@dataset{Fruit Object Detection,
  author={},
  title={Fruit Object Detection},
  year={2022},
  url={https://www.kaggle.com/datasets/eunpyohong/fruit-object-detection}
}
If you are happy with Dataset Ninja and use provided visualizations and tools in your work, please cite us:
@misc{ visualization-tools-for-fruit-object-detection-dataset,
  title = { Visualization Tools for Fruit Object Detection Dataset },
  type = { Computer Vision Tools },
  author = { Dataset Ninja },
  howpublished = { \url{ https://datasetninja.com/fruit-object-detection } },
  url = { https://datasetninja.com/fruit-object-detection },
  journal = { Dataset Ninja },
  publisher = { Dataset Ninja },
  year = { 2026 },
  month = { jul },
  note = { visited on 2026-07-19 },
}
Download #
Please visit dataset homepage to download the data.
Disclaimer #
Our gal from the legal dep told us we need to post this:
Dataset Ninja provides visualizations and statistics for some datasets that can be found online and can be downloaded by general audience. Dataset Ninja is not a dataset hosting platform and can only be used for informational purposes. The platform does not claim any rights for the original content, including images, videos, annotations and descriptions. Joint publishing is prohibited.
You take full responsibility when you use datasets presented at Dataset Ninja, as well as other information, including visualizations and statistics we provide. You are in charge of compliance with any dataset license and all other permissions. You are required to navigate datasets homepage and make sure that you can use it. In case of any questions, get in touch with us at hello@datasetninja.com.