
Introduction #
Fruits & Vegetable Detection for YOLOv4 is an object detection dataset comprising 4592 images with 5628 labeled objects spanning 14 classes like lemon, chili-bag, banana, tomato-bag, and others. The dataset is divided into a train set of 3942 images and a test set of 650 images. It addresses the challenge of automating the classification of fresh fruits and vegetables at self-checkout portals in supermarkets. These portals aim to save time for customers but manually entering produce during checkout can be time-consuming and error-prone. Leveraging machine learning, the dataset seeks to automate the identification of items, particularly overcoming the challenge of detecting objects through semi-transparent bags, a common issue in object detection models.
Motivation
The Fruits & Vegetable Detection for YOLOv4 dataset originates from the growing popularity of Machine Learning, widely integrated in technologies like YouTube Recommendations and Robotics Object Detection. The dataset addresses an observed issue in self-checkout stations at major grocery stores, primarily designed for items with barcodes, not loose produce like fresh fruits and vegetables. Integrating machine learning into the existing checkout station cameras enables accurate categorization of these loose items (e.g., grapes, lemon, banana), streamlining the checkout process and eliminating the need for manual item entry by customers.
About Fruits & Vegetable Detection dataset
The most important part of the Dataset Acquisition is how to capture the images, which can give you a good result after model training. Authors start from the basic where they make small datasets through the big datasets. All of the images were captured, With Default settings in the camera of iPhone 11.
- To train an object detection model, the datasets play an important role. There are different datasets available on Kaggle, Open Image Dataset By Google, and Some other websites.
- During the initial stage of the project, authors reviewed many data set from them Fruit 360 one of them, but the limitation of that dataset is it is specifically developed to reticular fruit detection by segmented portion.
- For the YOLO object detection, authors need to label a bunch of images with the background.
- Although Fruit 360 dataset works with R-CNN as per research, it will struggle with seeing through the semi-transparent plastic bag, which is the most crucial part.
- To Conclude All this Scenario, authors decided to make a custom dataset for a custom model.
To achieve these goals, the authors achieved the result through several iterations.
Iteration 1
- First Iteration contains only 1 class with 69 photos of the tomatoes with a bag and without a bag, which is such a small dataset for any object detection model.
- It is developed for the experimental purpose for checks how it can behave with the YOLO object detection model.
Tomato with bag & without bag.
Iteration 2
The second iteration contains three different classes, which include lemons, chilies, apples. These classes are with and without a bag. Here, there were 165 images taken during the 2nd iteration. It is randomly captured images without worrying about the background and other things.
Tomato with bag & without bag.
Iteration 3
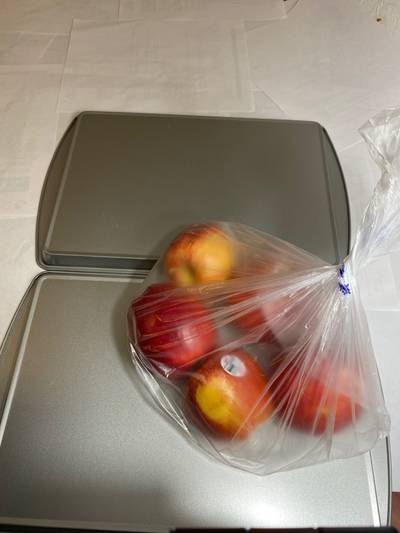
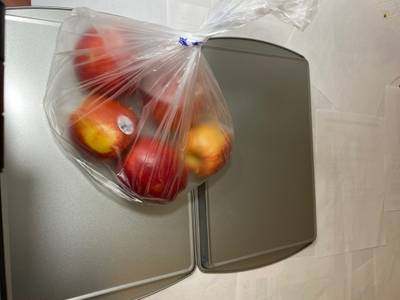
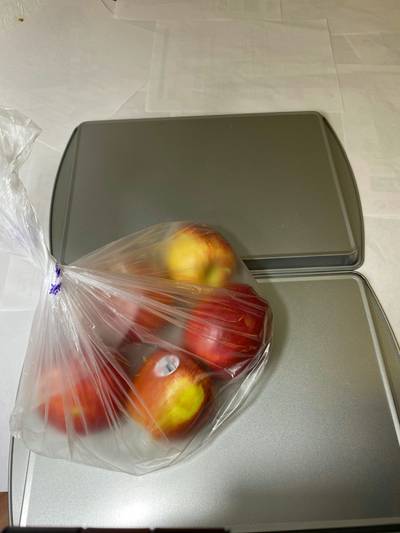
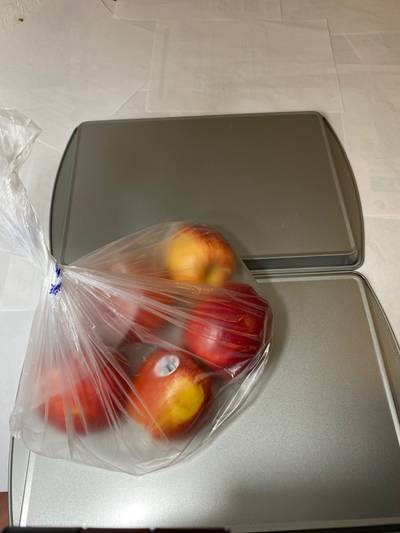
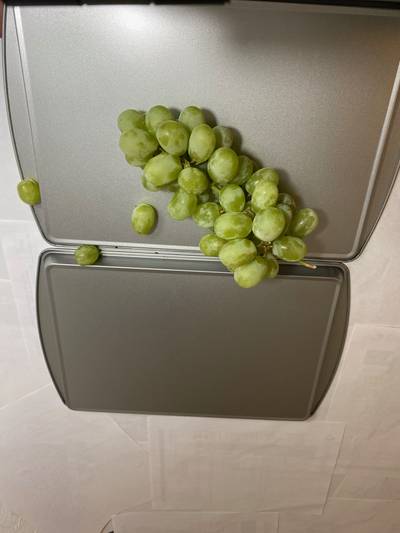
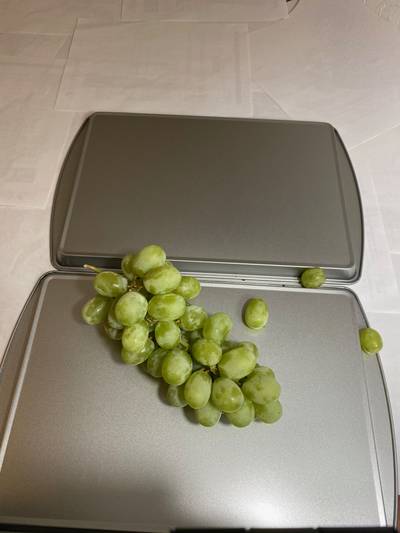
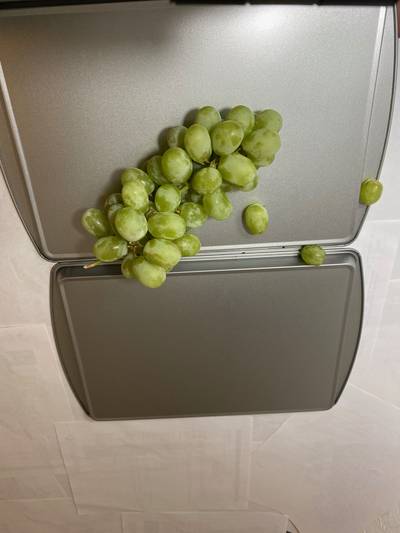
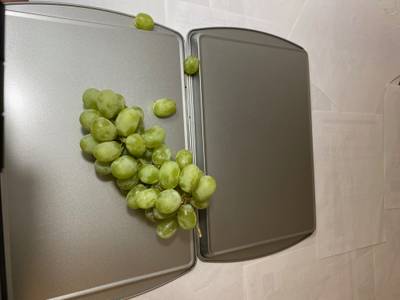
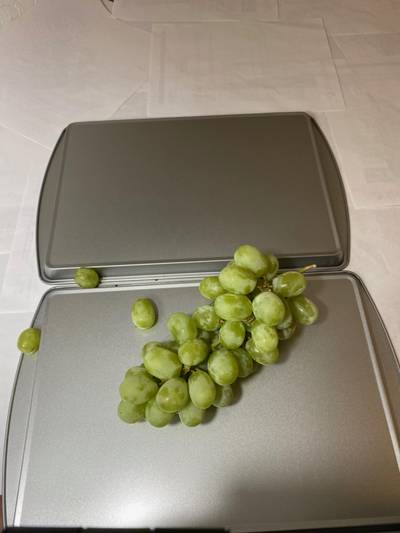
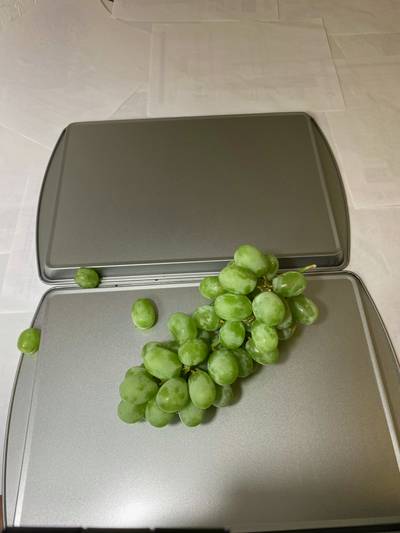
During the 3rd Iteration, authors got exposure to dataset creation. Here authors decided to make a platform that depicts the environment at the self-checkout stations. To depict the same environment as self-checkout stations, authors put the chrome plate as a background, and for steadiness in all photos, authors set up the phone in one place until they got the entire dataset.
Here is a little look at the DIY-home setup of the platform:
Here, during the 3rd iteration, authors create 14 separate classes in which they took approx 50 images of every individual class. 14 class are banana-bag, banana, blackberries, raspberry, lemon-bag, lemon, grapes-bag, grapes, tomato-bag, tomato, apple-bag, apple, chili-bag, chili
For proper lighting, authors set up a lamp backside of the phone stand. Authors took photos by putting an object near and far to the camera. That way their model can learn for all of the scenarios.
14 Classes with & without bag.
Authors took a total number of 656 images with a different angle and different distance from the camera. To give a feel like a self-checkout station they put chrome plate so when it will get to the production model have a little more accuracy due to the identical background.
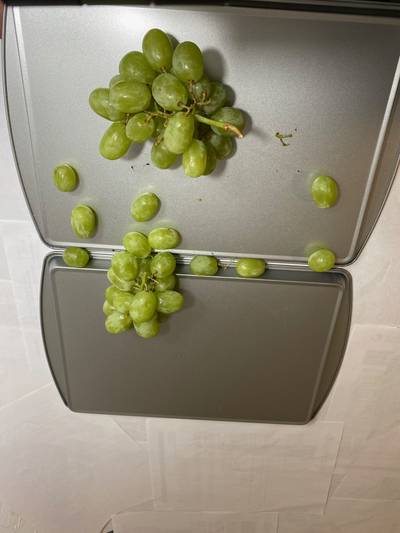
In some of the images, authors intentionally keep their hands in the images. It will give the feel of a customer’s hand during the detection of the item.
Some of the images authors keep half in the bag half outside of the bag. That way, one can assume if some of the items keep outside of the bag, then it can still perform the detection.
 Homepage
 MSc Thesis
Summary #
Fruits & Vegetable Detection for YOLOv4 is a dataset for an object detection task. Possible applications of the dataset could be in the retail industry.
The dataset consists of 4592 images with 5628 labeled objects belonging to 14 different classes including lemon, chili-bag, banana, and other: tomato-bag, apple-bag, chili, banana-bag, grapes-bag, grapes, tomato, apple, lemon-bag, raspberry, and blackberries.
Images in the Fruits & Vegetable Detection dataset have bounding box annotations. All images are labeled (i.e. with annotations). There are 2 splits in the dataset: train (3942 images) and test (650 images). The dataset was released in 2020 by the California State University San Marcos, USA.
Here are the visualized examples for the classes:
Explore #
Fruits & Vegetable Detection dataset has 4592 images. Click on one of the examples below or open "Explore" tool anytime you need to view dataset images with annotations. This tool has extended visualization capabilities like zoom, translation, objects table, custom filters and more. Hover the mouse over the images to hide or show annotations.


Class balance #
There are 14 annotation classes in the dataset. Find the general statistics and balances for every class in the table below. Click any row to preview images that have labels of the selected class. Sort by column to find the most rare or prevalent classes.

Class ㅤ | Images ㅤ | Objects ㅤ | Count on image average | Area on image average |
|---|---|---|---|---|
lemon➔ rectangle | 378 | 588 | 1.56 | 22.77% |
chili-bag➔ rectangle | 371 | 371 | 1 | 20.79% |
banana➔ rectangle | 364 | 455 | 1.25 | 32.06% |
tomato-bag➔ rectangle | 357 | 357 | 1 | 28.45% |
chili➔ rectangle | 357 | 413 | 1.16 | 16.05% |
apple-bag➔ rectangle | 357 | 357 | 1 | 25.01% |
tomato➔ rectangle | 350 | 602 | 1.72 | 23.34% |
grapes-bag➔ rectangle | 350 | 350 | 1 | 20.63% |
grapes➔ rectangle | 350 | 581 | 1.66 | 26.45% |
banana-bag➔ rectangle | 350 | 350 | 1 | 29.75% |
Co-occurrence matrix #
Co-occurrence matrix is an extremely valuable tool that shows you the images for every pair of classes: how many images have objects of both classes at the same time. If you click any cell, you will see those images. We added the tooltip with an explanation for every cell for your convenience, just hover the mouse over a cell to preview the description.
Images #
Explore every single image in the dataset with respect to the number of annotations of each class it has. Click a row to preview selected image. Sort by any column to find anomalies and edge cases. Use horizontal scroll if the table has many columns for a large number of classes in the dataset.
Object distribution #
Interactive heatmap chart for every class with object distribution shows how many images are in the dataset with a certain number of objects of a specific class. Users can click cell and see the list of all corresponding images.
Class sizes #
The table below gives various size properties of objects for every class. Click a row to see the image with annotations of the selected class. Sort columns to find classes with the smallest or largest objects or understand the size differences between classes.
Class | Object count | Avg area | Max area | Min area | Min height | Min height | Max height | Max height | Avg height | Avg height | Min width | Min width | Max width | Max width |
|---|---|---|---|---|---|---|---|---|---|---|---|---|---|---|
tomato rectangle | 602 | 13.79% | 51.16% | 0.82% | 263px | 8.53% | 2896px | 95.77% | 1111px | 29.09% | 262px | 8.53% | 2896px | 95.77% |
lemon rectangle | 588 | 14.67% | 94.91% | 1.01% | 295px | 7.32% | 3974px | 99.24% | 1167px | 30.37% | 296px | 7.34% | 3974px | 99.24% |
grapes rectangle | 581 | 16.18% | 66.38% | 0.21% | 137px | 3.4% | 3002px | 99.27% | 1196px | 31.17% | 138px | 3.42% | 3002px | 99.27% |
apple rectangle | 546 | 14.4% | 44.22% | 2.37% | 532px | 13.49% | 2560px | 84.66% | 1219px | 31.73% | 531px | 13.52% | 2560px | 84.66% |
banana rectangle | 455 | 25.97% | 86.23% | 9.98% | 1025px | 25.42% | 3540px | 98.21% | 1779px | 46.18% | 1026px | 25.45% | 3539px | 98.21% |
chili rectangle | 413 | 13.87% | 53.61% | 2.02% | 308px | 7.64% | 2758px | 82.84% | 1210px | 31.56% | 309px | 7.66% | 2758px | 82.87% |
chili-bag rectangle | 371 | 20.79% | 58.35% | 4.82% | 614px | 15.23% | 2969px | 98.18% | 1499px | 38.98% | 615px | 15.25% | 2969px | 98.18% |
tomato-bag rectangle | 357 | 28.45% | 80.34% | 8.76% | 926px | 22.97% | 3264px | 99.24% | 1759px | 45.84% | 927px | 22.99% | 3264px | 99.24% |
apple-bag rectangle | 357 | 25.01% | 66.15% | 9.64% | 995px | 24.68% | 3226px | 96.59% | 1667px | 43.47% | 996px | 24.7% | 3226px | 96.59% |
grapes-bag rectangle | 350 | 20.63% | 61.36% | 9.94% | 765px | 20.46% | 2994px | 99.01% | 1475px | 38.67% | 764px | 20.49% | 2994px | 99.01% |
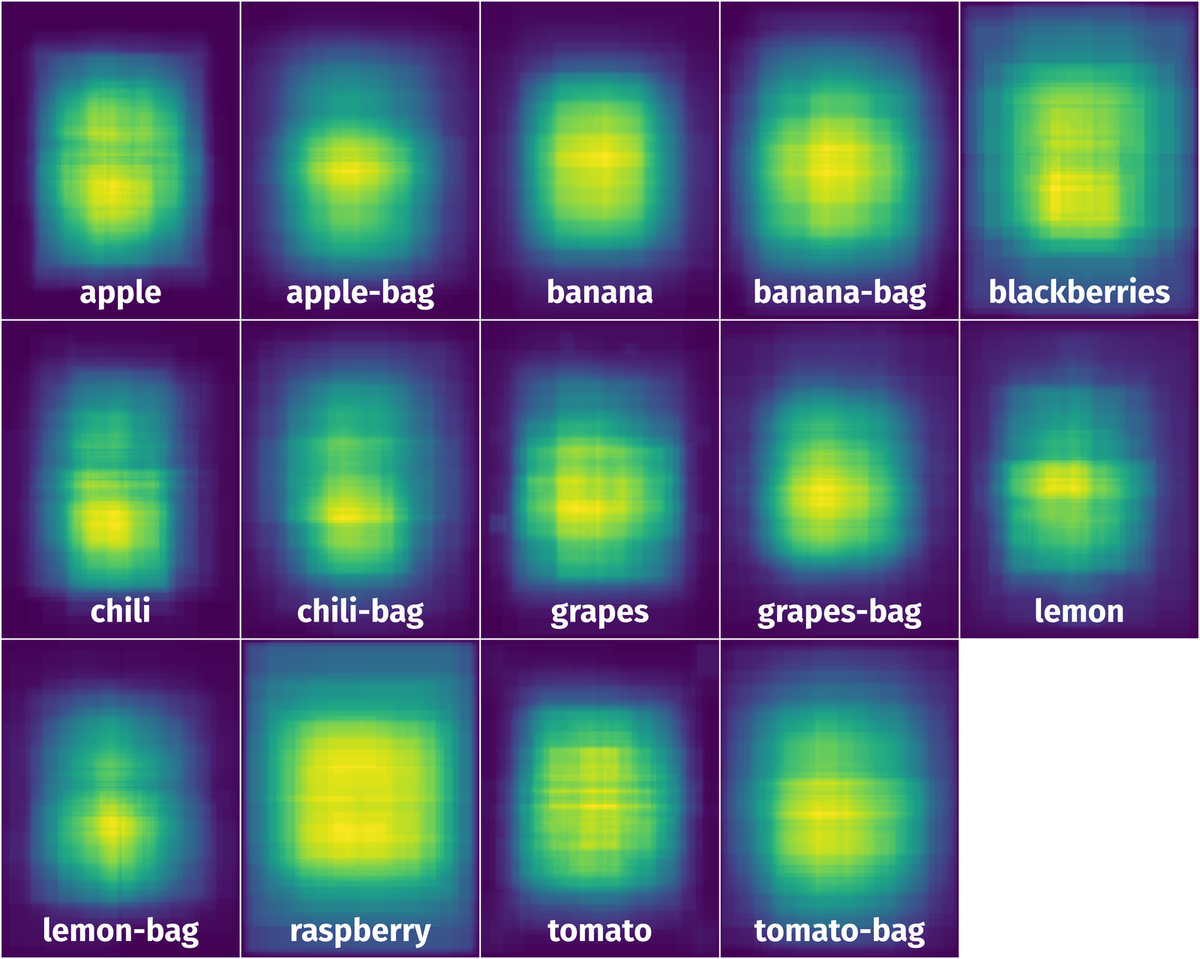
Spatial Heatmap #
The heatmaps below give the spatial distributions of all objects for every class. These visualizations provide insights into the most probable and rare object locations on the image. It helps analyze objects' placements in a dataset.
Objects #
Table contains all 5628 objects. Click a row to preview an image with annotations, and use search or pagination to navigate. Sort columns to find outliers in the dataset.
Object ID ㅤ | Class ㅤ | Image name click row to open | Image size height x width | Height ㅤ | Height ㅤ | Width ㅤ | Width ㅤ | Area ㅤ |
|---|---|---|---|---|---|---|---|---|
1➔ | tomato-bag rectangle | 370_3_tomato_wb_27.jpg | 3024 x 4032 | 2540px | 83.99% | 1713px | 42.49% | 35.69% |
2➔ | banana-bag rectangle | 566_2_banana_wb_33.jpg | 4032 x 3024 | 2420px | 60.02% | 2409px | 79.66% | 47.81% |
3➔ | apple-bag rectangle | 0_2_apple_wb_7.jpg | 4032 x 3024 | 1707px | 42.34% | 1858px | 61.44% | 26.01% |
4➔ | grapes rectangle | 196_1_grapes_wob_11.jpg | 4032 x 3024 | 1302px | 32.29% | 1801px | 59.56% | 19.23% |
5➔ | grapes rectangle | 196_1_grapes_wob_11.jpg | 4032 x 3024 | 614px | 15.23% | 794px | 26.26% | 4% |
6➔ | apple rectangle | 160_2_apple_wob_22.jpg | 4032 x 3024 | 1470px | 36.46% | 1690px | 55.89% | 20.38% |
7➔ | chili rectangle | 240_6_chilli_wob_45.jpg | 4032 x 3024 | 888px | 22.02% | 1620px | 53.57% | 11.8% |
8➔ | apple-bag rectangle | 41_6_apple_wb_4.jpg | 4032 x 3024 | 1826px | 45.29% | 1633px | 54% | 24.46% |
9➔ | lemon-bag rectangle | 64_2_lemon_wb_38.jpg | 4032 x 3024 | 946px | 23.46% | 1396px | 46.16% | 10.83% |
10➔ | grapes rectangle | 446_4_grapes_wob_35.jpg | 4032 x 3024 | 1518px | 37.65% | 1926px | 63.69% | 23.98% |
License #
License is unknown for the Fruits & Vegetable Detection for YOLOv4 dataset.
Citation #
If you make use of the Fruits & Vegetable Detection data, please cite the following reference:
@dataset{Fruits & Vegetable Detection,
  author={Kavan Patel},
  title={Fruits & Vegetable Detection for YOLOv4},
  year={2020},
  url={https://www.kaggle.com/datasets/kvnpatel/fruits-vegetable-detection-for-yolov4}
}
If you are happy with Dataset Ninja and use provided visualizations and tools in your work, please cite us:
@misc{ visualization-tools-for-fruits-and-vegetable-detection-dataset,
  title = { Visualization Tools for Fruits & Vegetable Detection Dataset },
  type = { Computer Vision Tools },
  author = { Dataset Ninja },
  howpublished = { \url{ https://datasetninja.com/fruits-and-vegetable-detection } },
  url = { https://datasetninja.com/fruits-and-vegetable-detection },
  journal = { Dataset Ninja },
  publisher = { Dataset Ninja },
  year = { 2026 },
  month = { jul },
  note = { visited on 2026-07-23 },
}
Download #
Please visit dataset homepage to download the data.
Disclaimer #
Our gal from the legal dep told us we need to post this:
Dataset Ninja provides visualizations and statistics for some datasets that can be found online and can be downloaded by general audience. Dataset Ninja is not a dataset hosting platform and can only be used for informational purposes. The platform does not claim any rights for the original content, including images, videos, annotations and descriptions. Joint publishing is prohibited.
You take full responsibility when you use datasets presented at Dataset Ninja, as well as other information, including visualizations and statistics we provide. You are in charge of compliance with any dataset license and all other permissions. You are required to navigate datasets homepage and make sure that you can use it. In case of any questions, get in touch with us at hello@datasetninja.com.