
Introduction #
The FSOD: A High-Diverse Few-Shot Object Detection Dataset stands out as a meticulously crafted dataset tailored for few-shot object detection. Its design focuses on assessing a model’s versatility across new categories. With a collection of 1000 diverse object categories accompanied by high-quality annotations, this dataset marks a pioneering effort in the realm of few-shot object detection datasets.
Motivation
Object detection finds extensive applications across various fields. However, current methods typically depend heavily on large sets of annotated data and entail prolonged training periods. They also struggle to adapt to unseen objects not included in the training data. In contrast, the human visual system excels at recognizing new objects with minimal guidance. Few-shot learning poses significant challenges due to the diverse characteristics of objects in real-world scenarios, including variations in illumination, shape, and texture. Despite recent advancements in few-shot learning, these techniques have primarily focused on image classification, with little exploration in the realm of few-shot object detection. This is primarily because transferring insights from few-shot classification to few-shot object detection presents considerable complexity. Few-shot object detection faces a critical obstacle in localizing unseen objects within cluttered backgrounds, representing a broader challenge in generalizing object localization from a scant number of training examples belonging to novel categories. This challenge often leads to missed detections or false positives, stemming from inadequate scoring of potentially suitable bounding boxes in region proposal networks (RPNs), rendering novel object detection difficult. Such inherent issues distinguish few-shot object detection from few-shot classification.
Dataset description
The authors endeavor to tackle the challenge of few-shot object detection. Their objective is to detect all foreground objects belonging to a specific target object category in a test set, given only a limited number of support set images depicting the target object. In pursuit of this goal, the authors present two significant contributions. Firstly, they introduce a comprehensive few-shot detection model capable of detecting novel objects without necessitating re-training or fine-tuning. Their approach leverages the matching relationship between pairs of objects within a siamese network across multiple network stages. Experimental results demonstrate that the model benefits from an attention module in the early stages, enhancing proposal quality, and a multi-relation module in the later stages, effectively suppressing and filtering out false detections in complex backgrounds. Secondly, for model training, the authors curate a large, meticulously annotated dataset comprising 1000 categories, each with a few examples. This dataset fosters broad learning in object detection.
Given different objects as supports, the authors approach can detect all objects with same categories in the given query image.
Dataset construction
The authors developed their dataset by drawing from existing extensive supervised object detection datasets. However, direct utilization of these datasets is hindered by several factors:
Inconsistencies in labeling systems across different datasets, wherein objects with identical semantics are denoted by different terms. Suboptimal annotations characterized by inaccuracies, missing labels, duplicate bounding boxes, excessively large objects, among other issues. The train/test splits in these datasets often contain identical categories, whereas for a few-shot dataset, the aim is to have distinct categories in the train and test sets to evaluate the model’s generalization to unseen objects. To construct their dataset, the authors initially standardized the labeling system by consolidating labels with similar meanings, such as merging “ice bear” and “polar bear” into a single category while eliminating semantically irrelevant labels. They then filtered out images with subpar labeling quality and bounding boxes of inappropriate sizes. Bounding boxes smaller than 0.05% of the image size, typically indicative of poor visual quality and unsuitable for serving as support examples, were specifically discarded.
Subsequently, adhering to the principles of few-shot learning, the authors partitioned the data into training and test sets devoid of category overlap. The training set comprised categories from the MS COCO Dataset and ImageNet Dataset, while for the test set containing 200 categories, categories with the least similarity to those in the training set were selected. The remaining categories were merged into the training set, resulting in a total of 800 categories.
In summary, the authors curated a dataset encompassing 1000 categories with distinct category splits for training and testing, with 531 categories sourced from the ImageNet Dataset and 469 from the Open Image Dataset.
Dataset analysis
The dataset is specifically designed for few-shot learning and intrinsically designed to evaluate the generality of a model on novel categories. The authors dataset contains 1000 categories with 800/200 split for training and test set separately, around 66,000 images and 182,000 bounding boxes in total. The dataset has the following attributes.
| Train | Test | |
|---|---|---|
| No. Class | 800 | 200 |
| No. Image | 52350 | 14152 |
| No. Box | 147489 | 35102 |
| Avg No. Box / Img | 2.82 | 2.48 |
| Min No. Img / Cls | 22 | 30 |
| Max No. Img / Cls | 208 | 199 |
| Avg No. Img / Cls | 75.65 | 74.31 |
| Box Size | [6, 6828] | [13, 4605] |
| Box Area Ratio | [0.0009, 1] | [0.0009, 1] |
| Box W/H Ratio | [0.0216, 89] | [0.0199, 51.5] |
Given different objects as supports, the authors approach can detect all objects with same categories in the given query image.
The dataset has the following attributes:
-
Extensive category diversity: The dataset boasts a wide range of semantic categories, encompassing 83 overarching parent semantics such as mammals, clothing, and weaponry, further branching out into 1000 distinct leaf categories. The rigorous dataset split implemented by the authors ensures that the semantic categories in the train and test sets are markedly dissimilar, posing a significant challenge for model evaluation.
-
Demanding evaluation conditions: Evaluation of models on this dataset presents formidable challenges. Notably, objects exhibit considerable variation in box size and aspect ratios. Moreover, a substantial portion of the test set, comprising 26.5% of images, features three or more objects. It’s pertinent to highlight that the test set includes numerous bounding boxes representing categories not included in label system, adding an additional layer of complexity to the evaluation process.
 Homepage
 Research Paper
Summary #
FSOD: A High-Diverse Few-Shot Object Detection Dataset is a dataset for an object detection task. It is applicable or relevant across various domains.
The dataset consists of 66502 images with 182591 labeled objects belonging to 800 different classes including cake, wheelchair, orange, and other: window blind, lipstick, houseplant, guitar, salad, mug, goose, sandal, van, shower cap, worm, shelf, shirt, hedgehog, pillow, doll, backpack, cat, swan, wall clock, butterfly, camper, countertop, dagger, flag, and 772 more.
Images in the FSOD dataset have bounding box annotations. All images are labeled (i.e. with annotations). There are 2 splits in the dataset: train (52350 images) and test (14152 images). Additionally, every image contains information about its sequence. Every label contain information about its supercategory. Explore it in supervisely labeling tool. The dataset was released in 2020 by the CN-US joint research group.
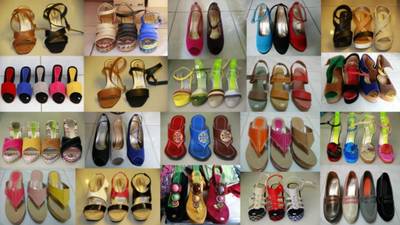
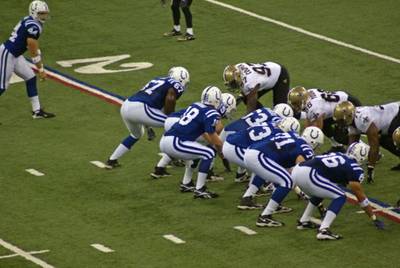
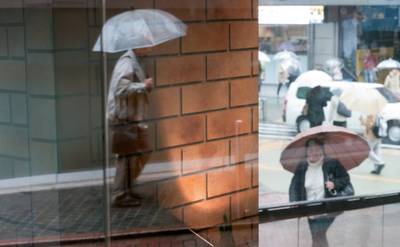
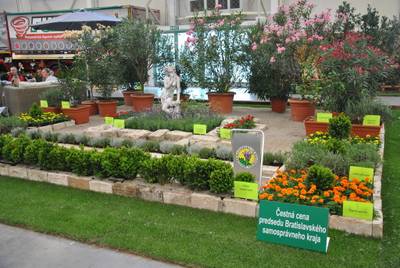
Here is a visualized example for randomly selected sample classes:
Explore #
FSOD dataset has 66502 images. Click on one of the examples below or open "Explore" tool anytime you need to view dataset images with annotations. This tool has extended visualization capabilities like zoom, translation, objects table, custom filters and more. Hover the mouse over the images to hide or show annotations.


Class balance #
There are 800 annotation classes in the dataset. Find the general statistics and balances for every class in the table below. Click any row to preview images that have labels of the selected class. Sort by column to find the most rare or prevalent classes.

Class ㅤ | Images ㅤ | Objects ㅤ | Count on image average | Area on image average |
|---|---|---|---|---|
cake➔ rectangle | 275 | 593 | 2.16 | 28.37% |
wheelchair➔ rectangle | 272 | 1041 | 3.83 | 33.91% |
orange➔ rectangle | 265 | 1489 | 5.62 | 33.66% |
window blind➔ rectangle | 259 | 1175 | 4.54 | 37.65% |
lipstick➔ rectangle | 258 | 750 | 2.91 | 21.81% |
houseplant➔ rectangle | 258 | 981 | 3.8 | 33.64% |
guitar➔ rectangle | 257 | 472 | 1.84 | 35.93% |
salad➔ rectangle | 254 | 344 | 1.35 | 52.27% |
mug➔ rectangle | 241 | 385 | 1.6 | 36.38% |
goose➔ rectangle | 240 | 974 | 4.06 | 28.35% |
Images #
Explore every single image in the dataset with respect to the number of annotations of each class it has. Click a row to preview selected image. Sort by any column to find anomalies and edge cases. Use horizontal scroll if the table has many columns for a large number of classes in the dataset.
Object distribution #
Interactive heatmap chart for every class with object distribution shows how many images are in the dataset with a certain number of objects of a specific class. Users can click cell and see the list of all corresponding images.
Class sizes #
The table below gives various size properties of objects for every class. Click a row to see the image with annotations of the selected class. Sort columns to find classes with the smallest or largest objects or understand the size differences between classes.
Class | Object count | Avg area | Max area | Min area | Min height | Min height | Max height | Max height | Avg height | Avg height | Min width | Min width | Max width | Max width |
|---|---|---|---|---|---|---|---|---|---|---|---|---|---|---|
butterfly rectangle | 2285 | 2.9% | 97.34% | 0.12% | 25px | 2.44% | 1121px | 98.05% | 128px | 13.67% | 11px | 1.07% | 2895px | 100% |
cookie rectangle | 1716 | 4.78% | 81.72% | 0.11% | 14px | 1.95% | 2910px | 100% | 175px | 20.74% | 15px | 1.95% | 2793px | 99.87% |
barrel rectangle | 1683 | 5.82% | 100% | 0.1% | 18px | 2.25% | 3274px | 100% | 179px | 21.16% | 18px | 1.76% | 2026px | 100% |
strawberry rectangle | 1517 | 4.87% | 64.02% | 0.21% | 24px | 2.34% | 875px | 99.7% | 161px | 21.69% | 12px | 2.6% | 797px | 82.39% |
orange rectangle | 1489 | 6.46% | 99.76% | 0.11% | 10px | 1.31% | 1024px | 100% | 158px | 20.56% | 18px | 1.76% | 3042px | 100% |
football helmet rectangle | 1256 | 7.26% | 100% | 0.1% | 18px | 2.61% | 3588px | 100% | 212px | 22.26% | 8px | 1.6% | 3998px | 100% |
window blind rectangle | 1175 | 8.56% | 100% | 0.11% | 10px | 2.67% | 2446px | 100% | 267px | 32.8% | 9px | 0.88% | 3262px | 100% |
tomato rectangle | 1161 | 5.05% | 90.12% | 0.11% | 20px | 2.83% | 1406px | 100% | 157px | 20.24% | 22px | 2.15% | 1406px | 100% |
lavender rectangle | 1118 | 5.19% | 100% | 0.1% | 9px | 1.95% | 1024px | 100% | 225px | 29.01% | 13px | 1.66% | 1024px | 100% |
wheelchair rectangle | 1041 | 9.92% | 89.26% | 0.12% | 25px | 3.26% | 1024px | 100% | 292px | 39.04% | 19px | 1.86% | 989px | 100% |
Spatial Heatmap #
The heatmaps below give the spatial distributions of all objects for every class. These visualizations provide insights into the most probable and rare object locations on the image. It helps analyze objects' placements in a dataset.

Objects #
Table contains all 100387 objects. Click a row to preview an image with annotations, and use search or pagination to navigate. Sort columns to find outliers in the dataset.
Object ID ㅤ | Class ㅤ | Image name click row to open | Image size height x width | Height ㅤ | Height ㅤ | Width ㅤ | Width ㅤ | Area ㅤ |
|---|---|---|---|---|---|---|---|---|
1➔ | tripod rectangle | 673d8edfcddb2c87.jpg | 1024 x 992 | 708px | 69.14% | 740px | 74.6% | 51.58% |
2➔ | spoonbill rectangle | n02006656_2881.jpg | 375 x 500 | 65px | 17.33% | 76px | 15.2% | 2.63% |
3➔ | spoonbill rectangle | n02006656_2881.jpg | 375 x 500 | 68px | 18.13% | 122px | 24.4% | 4.42% |
4➔ | swing rectangle | n04371774_14204.jpg | 332 x 500 | 284px | 85.54% | 37px | 7.4% | 6.33% |
5➔ | swing rectangle | n04371774_14204.jpg | 332 x 500 | 151px | 45.48% | 229px | 45.8% | 20.83% |
6➔ | letter opener rectangle | n03658185_3637.jpg | 303 x 575 | 292px | 96.37% | 278px | 48.35% | 46.59% |
7➔ | letter opener rectangle | n03658185_3637.jpg | 303 x 575 | 262px | 86.47% | 252px | 43.83% | 37.9% |
8➔ | king penguin rectangle | n02056570_10131.jpg | 500 x 331 | 429px | 85.8% | 113px | 34.14% | 29.29% |
9➔ | king penguin rectangle | n02056570_10131.jpg | 500 x 331 | 425px | 85% | 134px | 40.48% | 34.41% |
10➔ | clog rectangle | n03047690_16008.jpg | 500 x 469 | 287px | 57.4% | 147px | 31.34% | 17.99% |
License #
License is unknown for the FSOD: A High-Diverse Few-Shot Object Detection Dataset dataset.
Citation #
If you make use of the FSOD data, please cite the following reference:
@dataset{FSOD,
author={Qi Fan and Wei Zhuo and Yu-Wing Tai},
title={FSOD: A High-Diverse Few-Shot Object Detection Dataset},
year={2020},
url={https://github.com/fanq15/Few-Shot-Object-Detection-Dataset?tab=readme-ov-file}
}
If you are happy with Dataset Ninja and use provided visualizations and tools in your work, please cite us:
@misc{ visualization-tools-for-fsod-dataset,
title = { Visualization Tools for FSOD Dataset },
type = { Computer Vision Tools },
author = { Dataset Ninja },
howpublished = { \url{ https://datasetninja.com/fsod } },
url = { https://datasetninja.com/fsod },
journal = { Dataset Ninja },
publisher = { Dataset Ninja },
year = { 2026 },
month = { jul },
note = { visited on 2026-07-28 },
}Download #
Please visit dataset homepage to download the data.
Disclaimer #
Our gal from the legal dep told us we need to post this:
Dataset Ninja provides visualizations and statistics for some datasets that can be found online and can be downloaded by general audience. Dataset Ninja is not a dataset hosting platform and can only be used for informational purposes. The platform does not claim any rights for the original content, including images, videos, annotations and descriptions. Joint publishing is prohibited.
You take full responsibility when you use datasets presented at Dataset Ninja, as well as other information, including visualizations and statistics we provide. You are in charge of compliance with any dataset license and all other permissions. You are required to navigate datasets homepage and make sure that you can use it. In case of any questions, get in touch with us at hello@datasetninja.com.