

Introduction #
C10-DET represents a dataset designed for the detection of defects on large-scale metallic surfaces. It poses significant challenges in terms of the variety of defect categories, the number of images, and data volume. The presence of surface defects on metallic materials can have detrimental effects on the quality of industrial products, making efficient detection of metallic defects essential to meet the quality standards set by various industries. Consequently, there has been a growing interest in the field of metallic surface defect detection, leading to substantial advancements in quality control for industrial applications. However, the task of identifying metallic surface defects is inherently complex, primarily due to environmental factors like lighting, light reflections, and the unique properties of metal materials. These factors significantly increase the intricacy of surface defect detection. Note, that while the original paper stated that the dataset contained 3,570 grayscale images, the current version offers 2,300 images.
Existing defect datasets are limited in terms of data scale and defect diversity, often containing only a few categories. The small dataset size can result in detection models with weak robustness and limited generalization capabilities, especially when dealing with complex industrial scenarios. To address this issue and provide a benchmark that closely resembles realistic scenarios, the authors constructed a new dataset called GC10-DET.
The data collection system utilized a set of linear array CCD cameras equipped with a direct current (DC) light source to eliminate the presence of alternating current (AC) stripes. For certain production lines, like hot-rolled strip production lines, which achieve speeds of up to 10 m/s, high-speed linear CCD cameras were used to improve detection speed and image resolution. In the case of wide-format steel plates, 4096-pixel line scan CCD cameras were stitched together to capture complete images. The captured steel plate images were then transmitted to a server with ample computing resources for defect detection. The results were output to the console for quality control.
The industrial system consists of host computers, production lines, servers, and detection results. The host computer is to control the operation of the entire system while the server is to deploy a defect detection model for the production line. Finally, detection results provide feedback for the production line.
The authors provided detailed information about the brands, parameters, and types of equipment used for data collection. The cameras used were Teledyne DALSA LA-CM-04K08A models, equipped with Moritex ML-3528-43F lenses, and had a pixel size of 7.04 µm × 7.04 µm. The server utilized 32GB of running memory and NVIDIA RTX 2082ti GPU cards.
Each defect type is described in detail, explaining how it appears on the steel strip surface and the reasons behind its occurrence:
- Punching: In the production line of the strip, the steel strip needs to be punched according to the product specifications; mechanical failure may lead to unwanted punching, resulting in punching defects.
- Welding line: When the strip is changed, it is necessary to weld the two coils of the strip, and the weld line is produced. Strictly speaking, this is not a defect, but it needs to be automatically detected and tracked to be circumvented in subsequent cuts.
- Crescent gap: In the production of steel strip, cutting sometimes results in defects, just like half a circle.
- Water spot: A water spot is produced by drying in production. Under different products and processes, the requirements for this defect are different. However, because the water spots are generally with low contrast, and are similar to other defects such as oil spots, they are usually detected by mistake.
- Oil spot: An oil spot is usually caused by the contamination of mechanical lubricant, which will affect the appearance of the product.
- Silk spot: A local or continuous wave-like plaque on a strip surface that may appear on the upper and lower surfaces, and the density is uneven in the whole strip length direction. Generally, the main reason lies in the uneven temperature of the roller and uneven pressure.
- Inclusion: Inclusion is a typical defect of metal surface defects, usually showing small spots, fish scale shape, strip shape, block irregular distribution in the strip of the upper and lower surface (global or local), and is often accompanied by rough pockmarked surfaces. Some inclusions are loose and easy to fall off and some are pressed into the plate.
- Rolled pit: Rolled pits are periodic bulges or pits on the surface of a steel plate that are punctate, flaky, or strip-like. They are distributed throughout the strip length or section, mainly caused by work roll or tension roll damage.
- Crease: A crease is a vertical transverse fold, with regular or irregular spacing across the strip, or at the edge of the strip. The main reason is the local yield along the moving direction of the strip in the uncoiling process.
- Waist folding: There are obvious folds in the defect parts, a little more popular, a little like wrinkles, indicating that the local deformation of the defect is too large. The reason is due to low-carbon.
 Homepage
 Research Paper
 GitHub
Summary #
GC10-DET: Metallic Surface Defect Detection is a dataset for an object detection task. It is used in the surface defect detection domain.
The dataset consists of 2300 images with 3563 labeled objects belonging to 10 different classes including silk_spot, welding_line, punching_hole, and other: water_spot, crescent_gap, oil_spot, inclusion, waist folding, crease, and rolled_pit.
Images in the GC10-DET dataset have bounding box annotations. There are 8 (0% of the total) unlabeled images (i.e. without annotations). There are no pre-defined train/val/test splits in the dataset. The dataset was released in 2020 by the Tianjin University, China.
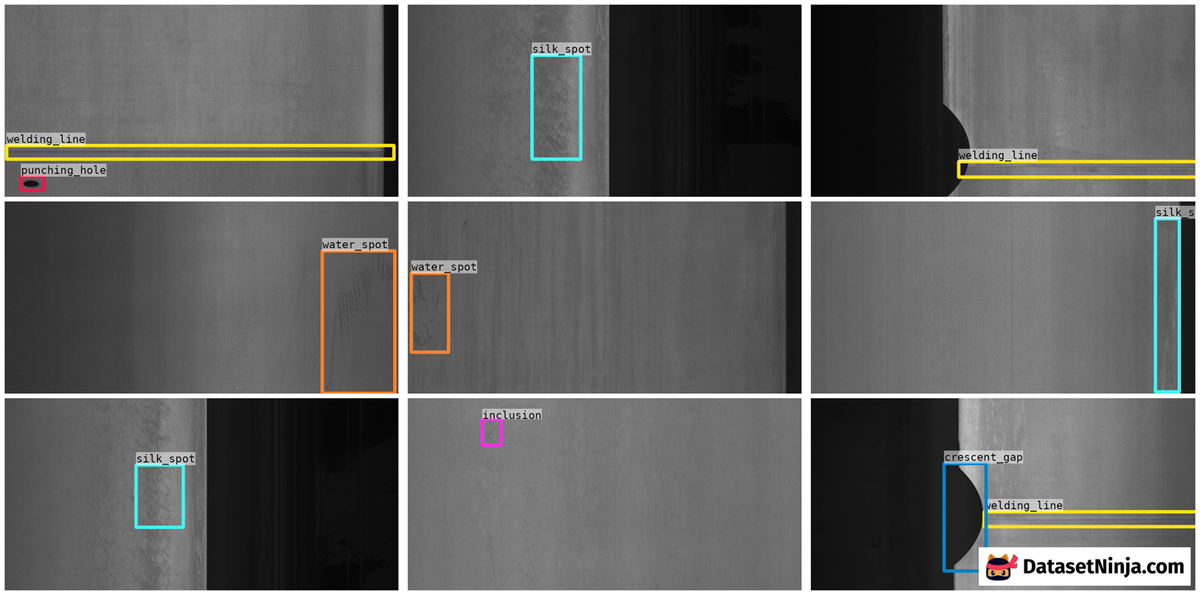
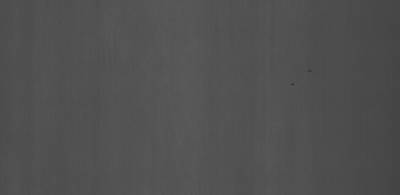
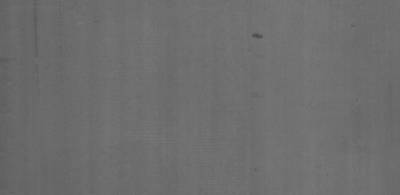
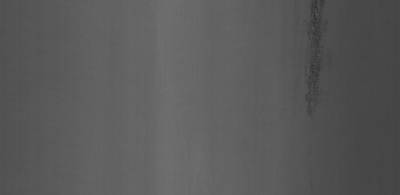
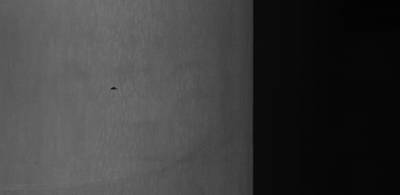
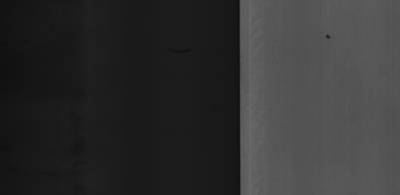
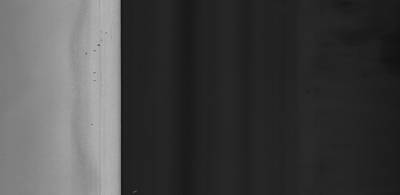
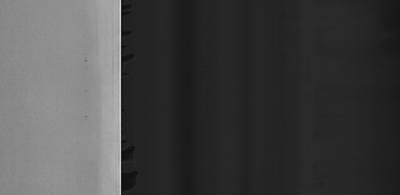
Here is the visualized example grid with annotations:
Explore #
GC10-DET dataset has 2300 images. Click on one of the examples below or open "Explore" tool anytime you need to view dataset images with annotations. This tool has extended visualization capabilities like zoom, translation, objects table, custom filters and more. Hover the mouse over the images to hide or show annotations.


Class balance #
There are 10 annotation classes in the dataset. Find the general statistics and balances for every class in the table below. Click any row to preview images that have labels of the selected class. Sort by column to find the most rare or prevalent classes.

Class ㅤ | Images ㅤ | Objects ㅤ | Count on image average | Area on image average |
|---|---|---|---|---|
silk_spot➔ rectangle | 734 | 884 | 1.2 | 16.7% |
welding_line➔ rectangle | 512 | 513 | 1 | 5.91% |
punching_hole➔ rectangle | 329 | 329 | 1 | 0.31% |
water_spot➔ rectangle | 310 | 354 | 1.14 | 7.39% |
crescent_gap➔ rectangle | 264 | 265 | 1 | 6.37% |
oil_spot➔ rectangle | 250 | 569 | 2.28 | 3.41% |
inclusion➔ rectangle | 201 | 347 | 1.73 | 1.57% |
waist folding➔ rectangle | 140 | 143 | 1.02 | 40.47% |
crease➔ rectangle | 53 | 74 | 1.4 | 8.45% |
rolled_pit➔ rectangle | 46 | 85 | 1.85 | 5.55% |
Co-occurrence matrix #
Co-occurrence matrix is an extremely valuable tool that shows you the images for every pair of classes: how many images have objects of both classes at the same time. If you click any cell, you will see those images. We added the tooltip with an explanation for every cell for your convenience, just hover the mouse over a cell to preview the description.
Images #
Explore every single image in the dataset with respect to the number of annotations of each class it has. Click a row to preview selected image. Sort by any column to find anomalies and edge cases. Use horizontal scroll if the table has many columns for a large number of classes in the dataset.
Object distribution #
Interactive heatmap chart for every class with object distribution shows how many images are in the dataset with a certain number of objects of a specific class. Users can click cell and see the list of all corresponding images.
Class sizes #
The table below gives various size properties of objects for every class. Click a row to see the image with annotations of the selected class. Sort columns to find classes with the smallest or largest objects or understand the size differences between classes.
Class | Object count | Avg area | Max area | Min area | Min height | Min height | Max height | Max height | Avg height | Avg height | Min width | Min width | Max width | Max width |
|---|---|---|---|---|---|---|---|---|---|---|---|---|---|---|
silk_spot rectangle | 884 | 13.88% | 83.35% | 0.31% | 81px | 8.1% | 991px | 99.1% | 592px | 59.19% | 59px | 2.88% | 2009px | 98.1% |
oil_spot rectangle | 569 | 1.5% | 21.1% | 0.07% | 29px | 2.9% | 999px | 99.9% | 168px | 16.78% | 26px | 1.27% | 758px | 37.01% |
welding_line rectangle | 513 | 5.89% | 12.07% | 0.17% | 27px | 2.7% | 125px | 12.5% | 76px | 7.61% | 129px | 6.3% | 2047px | 99.95% |
water_spot rectangle | 354 | 6.48% | 39.6% | 0.14% | 45px | 4.5% | 999px | 99.9% | 422px | 42.21% | 55px | 2.69% | 1398px | 68.26% |
inclusion rectangle | 347 | 0.91% | 8.92% | 0.04% | 17px | 1.7% | 977px | 97.7% | 151px | 15.11% | 25px | 1.22% | 731px | 35.69% |
punching_hole rectangle | 329 | 0.31% | 0.86% | 0.03% | 24px | 2.4% | 110px | 11% | 61px | 6.1% | 15px | 0.73% | 192px | 9.38% |
crescent_gap rectangle | 265 | 6.35% | 25.81% | 0.21% | 72px | 7.2% | 999px | 99.9% | 423px | 42.25% | 24px | 1.17% | 666px | 32.52% |
waist folding rectangle | 143 | 39.62% | 80.2% | 3.73% | 105px | 10.5% | 976px | 97.6% | 785px | 78.49% | 202px | 9.86% | 1960px | 95.7% |
rolled_pit rectangle | 85 | 3.01% | 32.72% | 0.22% | 50px | 5% | 982px | 98.2% | 194px | 19.39% | 55px | 2.69% | 1856px | 90.62% |
crease rectangle | 74 | 6.05% | 34.97% | 0.13% | 36px | 3.6% | 856px | 85.6% | 160px | 16.04% | 50px | 2.44% | 2031px | 99.17% |
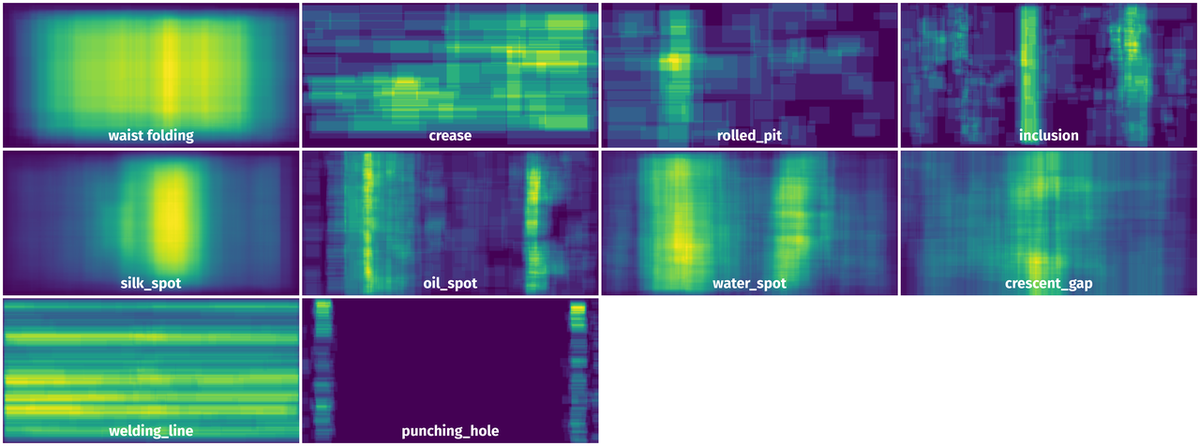
Spatial Heatmap #
The heatmaps below give the spatial distributions of all objects for every class. These visualizations provide insights into the most probable and rare object locations on the image. It helps analyze objects' placements in a dataset.
Objects #
Table contains all 3563 objects. Click a row to preview an image with annotations, and use search or pagination to navigate. Sort columns to find outliers in the dataset.
Object ID ㅤ | Class ㅤ | Image name click row to open | Image size height x width | Height ㅤ | Height ㅤ | Width ㅤ | Width ㅤ | Area ㅤ |
|---|---|---|---|---|---|---|---|---|
1➔ | welding_line rectangle | img_02_436149500_00939.jpg | 1000 x 2048 | 84px | 8.4% | 2043px | 99.76% | 8.38% |
2➔ | welding_line rectangle | img_02_425622400_00001.jpg | 1000 x 2048 | 67px | 6.7% | 1942px | 94.82% | 6.35% |
3➔ | crescent_gap rectangle | img_02_425622400_00001.jpg | 1000 x 2048 | 538px | 53.8% | 231px | 11.28% | 6.07% |
4➔ | crescent_gap rectangle | img_01_425502200_00018.jpg | 1000 x 2048 | 266px | 26.6% | 213px | 10.4% | 2.77% |
5➔ | welding_line rectangle | img_01_425502200_00018.jpg | 1000 x 2048 | 60px | 6% | 1054px | 51.46% | 3.09% |
6➔ | punching_hole rectangle | img_03_3403400200_00567.jpg | 1000 x 2048 | 53px | 5.3% | 107px | 5.22% | 0.28% |
7➔ | inclusion rectangle | img_08_425506600_00952.jpg | 1000 x 2048 | 102px | 10.2% | 45px | 2.2% | 0.22% |
8➔ | welding_line rectangle | img_03_436164700_00001.jpg | 1000 x 2048 | 68px | 6.8% | 2045px | 99.85% | 6.79% |
9➔ | punching_hole rectangle | img_03_436164700_00001.jpg | 1000 x 2048 | 27px | 2.7% | 116px | 5.66% | 0.15% |
10➔ | punching_hole rectangle | img_06_425608200_00007.jpg | 1000 x 2048 | 55px | 5.5% | 104px | 5.08% | 0.28% |
License #
Citation #
If you make use of the GC10-DET data, please cite the following reference:
@dataset{GC10-DET,
	author={Xiaoming Lv and Fajie Duan and Jia-jia Jiang and Xiao Fu and Lin Gan},
	title={GC10-DET: Metallic Surface Defect Detection},
	year={2020},
	url={https://www.kaggle.com/datasets/alex000kim/gc10det}
}
If you are happy with Dataset Ninja and use provided visualizations and tools in your work, please cite us:
@misc{ visualization-tools-for-gc10-det-dataset,
  title = { Visualization Tools for GC10-DET Dataset },
  type = { Computer Vision Tools },
  author = { Dataset Ninja },
  howpublished = { \url{ https://datasetninja.com/gc10-det } },
  url = { https://datasetninja.com/gc10-det },
  journal = { Dataset Ninja },
  publisher = { Dataset Ninja },
  year = { 2026 },
  month = { jul },
  note = { visited on 2026-07-20 },
}
Download #
Dataset GC10-DET can be downloaded in Supervisely format:
As an alternative, it can be downloaded with dataset-tools package:
pip install --upgrade dataset-tools
… using following python code:
import dataset_tools as dtools

dtools.download(dataset='GC10-DET', dst_dir='~/dataset-ninja/')
Make sure not to overlook the python code example available on the Supervisely Developer Portal. It will give you a clear idea of how to effortlessly work with the downloaded dataset.
The data in original format can be downloaded here.
Disclaimer #
Our gal from the legal dep told us we need to post this:
Dataset Ninja provides visualizations and statistics for some datasets that can be found online and can be downloaded by general audience. Dataset Ninja is not a dataset hosting platform and can only be used for informational purposes. The platform does not claim any rights for the original content, including images, videos, annotations and descriptions. Joint publishing is prohibited.
You take full responsibility when you use datasets presented at Dataset Ninja, as well as other information, including visualizations and statistics we provide. You are in charge of compliance with any dataset license and all other permissions. You are required to navigate datasets homepage and make sure that you can use it. In case of any questions, get in touch with us at hello@datasetninja.com.