

Introduction #
In the realm of real-time traffic sign detection, the task of locating traffic signs within natural images poses a formidable challenge with significant industrial implications. The authors aim to address this gap through the GTSDB: The German Traffic Sign Detection Benchmark which was introduced as a competition at the International Joint Conference on Neural Networks (IJCNN) in 2013. They present a real-world benchmark dataset for traffic sign detection, complete with meticulously chosen evaluation metrics, baseline results, and a web interface for facilitating method comparisons. In their evaluation, the authors distinguish between sign detection and classification while assessing performance on relevant sign categories to facilitate the benchmarking of specialized solutions.
Many practical computer vision applications necessitate precise detection of contextually relevant objects within video images. Traffic sign recognition serves as a challenging example, as it demands algorithms capable of operating in complex, dynamic environments, while meeting stringent accuracy requirements and real-time constraints. Given its substantial industrial relevance, numerous approaches have been proposed for traffic sign detection and recognition. The automotive industry has even deployed advanced driver assistance systems featuring traffic sign recognition, albeit typically limited to a subset of possible signs. Despite these advancements, a comprehensive, impartial comparison of traffic sign detection systems is conspicuously absent, and suitably large benchmark datasets are not readily accessible.
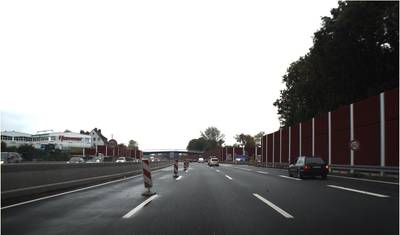
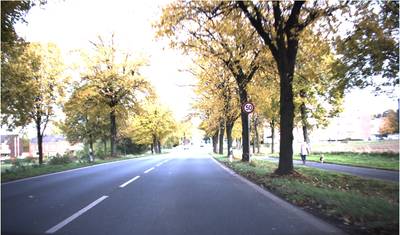
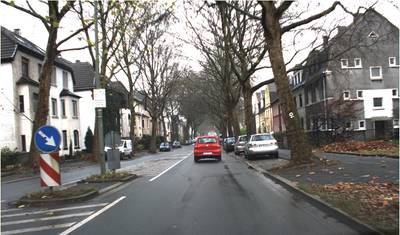
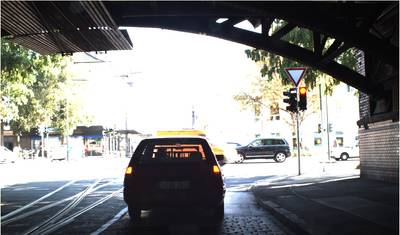
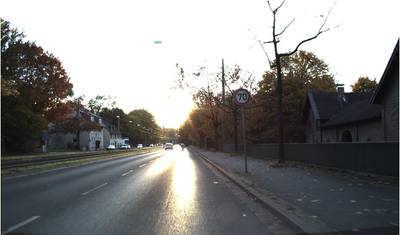
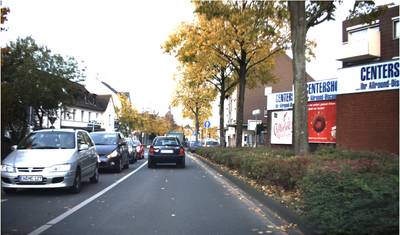
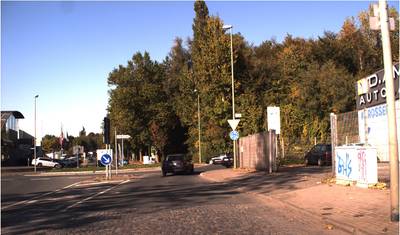
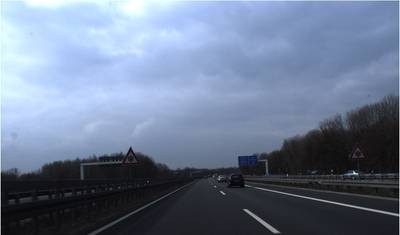
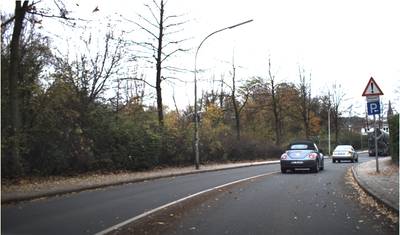
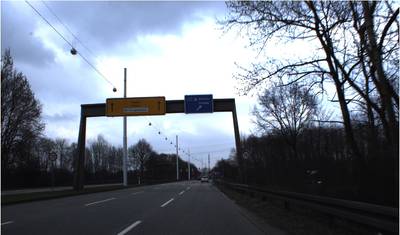
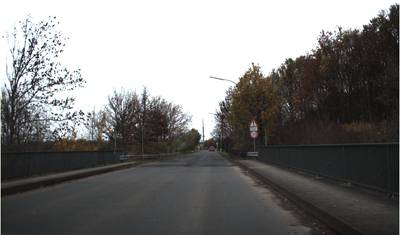
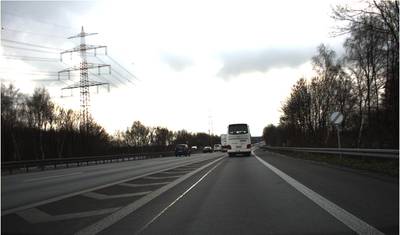
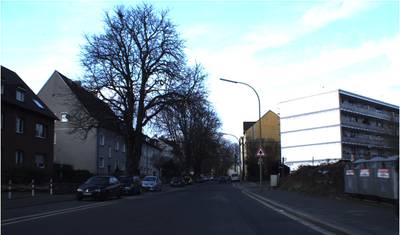
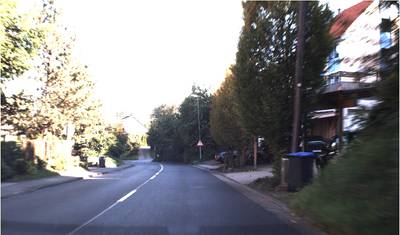
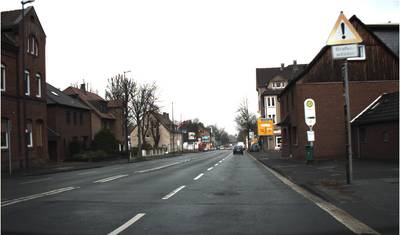
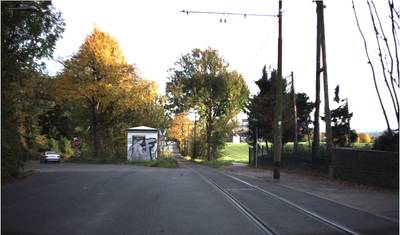
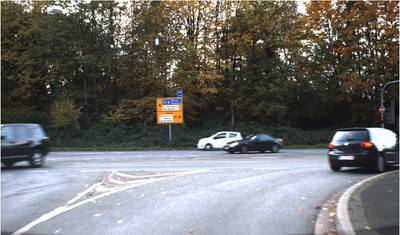
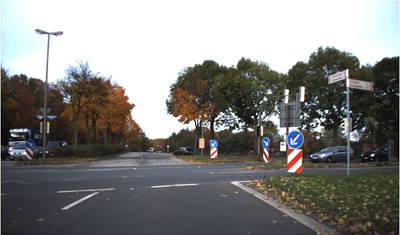
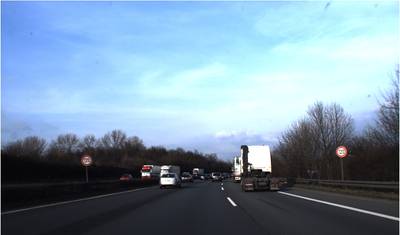
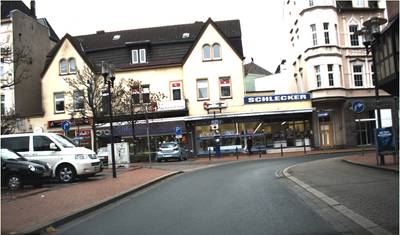
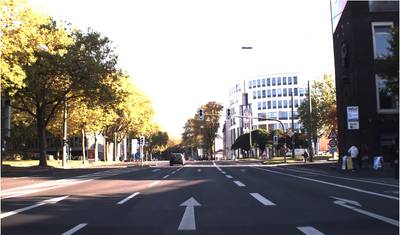
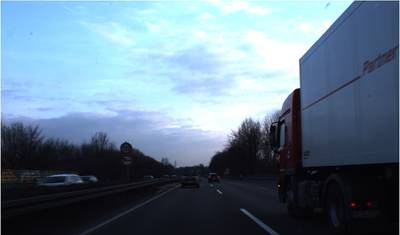
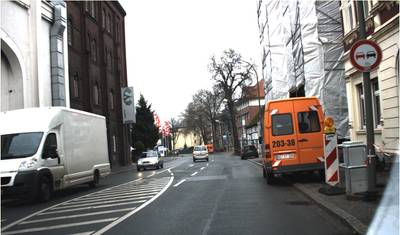
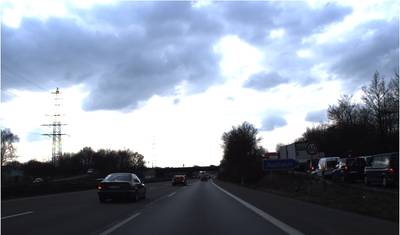
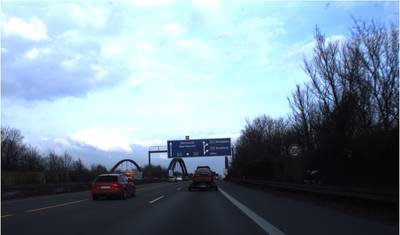
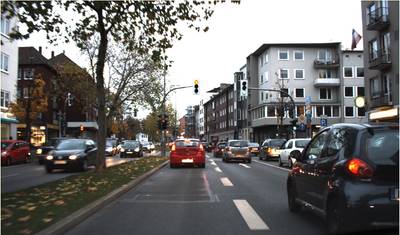
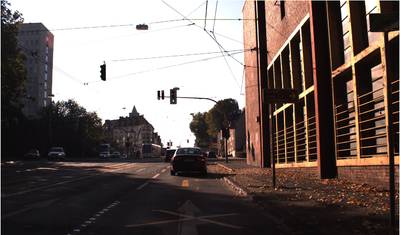
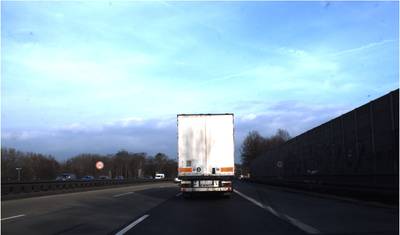
Hence, the authors propose the GTSDB, encompassing an extensive dataset of real-world images and a systematic evaluation protocol, complemented by a public web interface. The traffic sign recognition process is divided into two primary stages: detection of signs within an image or video stream, followed by their subsequent recognition (classification). The benchmark dataset comprises images captured during tours near Bochum, Germany, in spring and autumn 2010. These images cover diverse scenarios, including urban, rural, and highway settings during both daytime and dusk, featuring varying weather conditions. The traffic signs recorded adhere to the Vienna Convention on Road Signs and Signals, ensuring a standardized appearance across 62 countries.
Data Collection and Format
The authors used a Prosilica GC 1380CH camera with automatic exposure control to record Bayer-pattern images at a resolution of 1360×1024 pixels. For the final benchmark dataset, the images were cropped to 1360×800 pixels, as the lower portion primarily displayed the front lid and was not task-relevant. All images were converted to RGB color space using an edge-adaptive, constant-hue demosaicking method and were stored in raw PPM file format. All visible traffic signs in the images were manually labeled.
Data Organization
The sizes of traffic signs varied between 16 and 128 pixels concerning the longer edge. The bounding boxes were not necessarily square due to the aspect ratio of the sign types and perspective distortions. The final dataset comprises 900 full images containing 1206 traffic signs, randomly divided into a training set (600 images, 846 traffic signs) and an evaluation set (300 images, 360 traffic signs). Images with identical real-world traffic signs were assigned to the same set, although most traffic sign instances occurred only once in the dataset. Consequently, the training set can be further subdivided for cross-validation purposes. Each image was annotated with rectangular regions of interest (ROIs) corresponding to the visible traffic signs and their specific traffic sign class (e.g., stop sign, speed limit 60, speed limit 80, etc.). Three competition-relevant categories were defined for the signs: prohibitory signs, mandatory signs, and danger signs. A small number of annotated signs did not fit into these categories and were deemed unimportant for the competition but were still included for the sake of completeness (other).
 Homepage
 Research Paper
Summary #
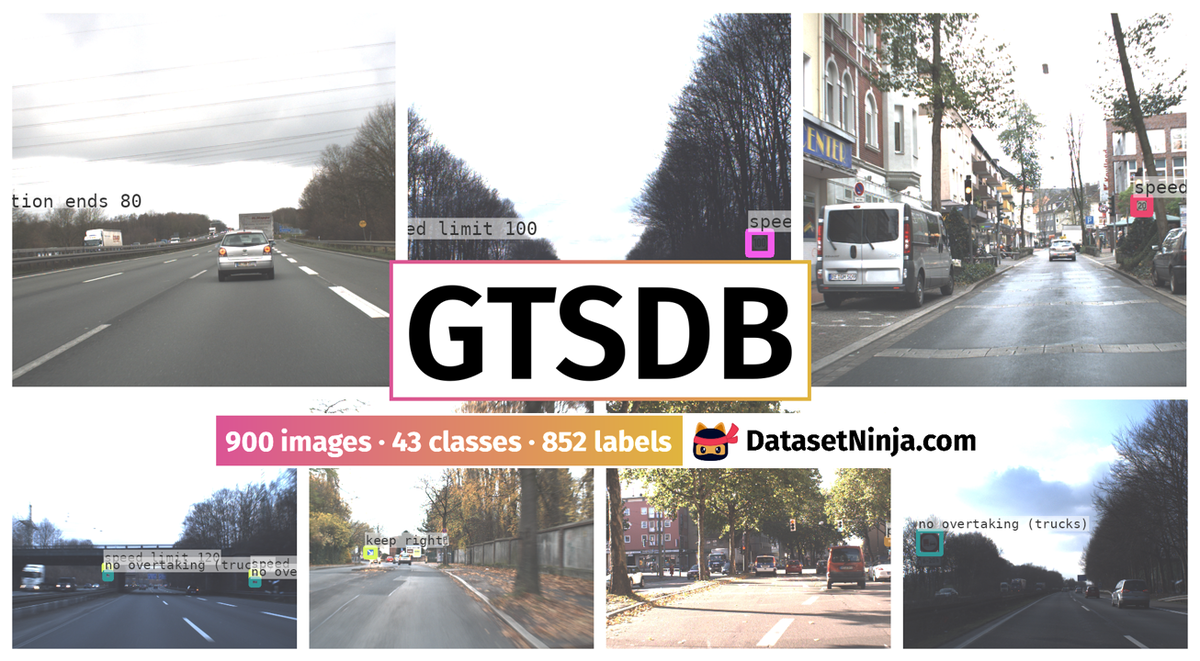
GTSDB: The German Traffic Sign Detection Benchmark is a dataset for an object detection task. It is used in the automotive industry.
The dataset consists of 900 images with 852 labeled objects belonging to 43 different classes including keep right, priority road, speed limit 50, and other: speed limit 30, give way, no overtaking (trucks), speed limit 120, no overtaking, priority at next intersection, speed limit 80, speed limit 70, speed limit 100, danger, construction, speed limit 60, stop, no entry, go straight, go right, slippery road, restriction ends 80, traffic signal, snow, go left, no traffic both ways, school crossing, go right or straight, uneven road, roundabout, bend right, no trucks, bend, restriction ends (overtaking), restriction ends (overtaking (trucks)), speed limit 20, cycles crossing, pedestrian crossing, keep left, bend left, road narrows, restriction ends, animals, and go left or straight.
Images in the GTSDB dataset have bounding box annotations. There are 394 (44% of the total) unlabeled images (i.e. without annotations). There are 2 splits in the dataset: train (600 images) and test (300 images). Alternatively, the dataset could be split into 4 traffic sign categories: prohibitory (396 objects), other (186 objects), danger (156 objects), and mandatory (114 objects). Explore them in the supervisely labeling tool. The dataset was released in 2013 by the University of Bochum, Germany and University of Copenhagen, Denmark.
Explore #
GTSDB dataset has 900 images. Click on one of the examples below or open "Explore" tool anytime you need to view dataset images with annotations. This tool has extended visualization capabilities like zoom, translation, objects table, custom filters and more. Hover the mouse over the images to hide or show annotations.


Class balance #
There are 43 annotation classes in the dataset. Find the general statistics and balances for every class in the table below. Click any row to preview images that have labels of the selected class. Sort by column to find the most rare or prevalent classes.

Class ㅤ | Images ㅤ | Objects ㅤ | Count on image average | Area on image average |
|---|---|---|---|---|
keep right➔ rectangle | 56 | 57 | 1.02 | 0.21% |
priority road➔ rectangle | 53 | 54 | 1.02 | 0.29% |
speed limit 50➔ rectangle | 50 | 59 | 1.18 | 0.26% |
speed limit 30➔ rectangle | 46 | 48 | 1.04 | 0.21% |
give way➔ rectangle | 44 | 52 | 1.18 | 0.35% |
no overtaking (trucks)➔ rectangle | 37 | 63 | 1.7 | 0.27% |
speed limit 120➔ rectangle | 28 | 47 | 1.68 | 0.26% |
no overtaking➔ rectangle | 28 | 32 | 1.14 | 0.22% |
priority at next intersection➔ rectangle | 25 | 26 | 1.04 | 0.28% |
speed limit 80➔ rectangle | 24 | 37 | 1.54 | 0.29% |
Images #
Explore every single image in the dataset with respect to the number of annotations of each class it has. Click a row to preview selected image. Sort by any column to find anomalies and edge cases. Use horizontal scroll if the table has many columns for a large number of classes in the dataset.
Object distribution #
Interactive heatmap chart for every class with object distribution shows how many images are in the dataset with a certain number of objects of a specific class. Users can click cell and see the list of all corresponding images.
Class sizes #
The table below gives various size properties of objects for every class. Click a row to see the image with annotations of the selected class. Sort columns to find classes with the smallest or largest objects or understand the size differences between classes.
Class | Object count | Avg area | Max area | Min area | Min height | Min height | Max height | Max height | Avg height | Avg height | Min width | Min width | Max width | Max width |
|---|---|---|---|---|---|---|---|---|---|---|---|---|---|---|
no overtaking (trucks) rectangle | 63 | 0.16% | 1.31% | 0.03% | 17px | 2.12% | 119px | 14.88% | 38px | 4.73% | 17px | 1.25% | 120px | 8.82% |
speed limit 50 rectangle | 59 | 0.22% | 1.41% | 0.03% | 19px | 2.38% | 124px | 15.5% | 43px | 5.35% | 19px | 1.4% | 124px | 9.12% |
keep right rectangle | 57 | 0.21% | 1.13% | 0.03% | 17px | 2.12% | 112px | 14% | 44px | 5.44% | 17px | 1.25% | 110px | 8.09% |
priority road rectangle | 54 | 0.29% | 1.37% | 0.04% | 20px | 2.5% | 122px | 15.25% | 50px | 6.19% | 22px | 1.62% | 122px | 8.97% |
give way rectangle | 52 | 0.3% | 1.29% | 0.03% | 22px | 2.75% | 112px | 14% | 49px | 6.16% | 17px | 1.25% | 125px | 9.19% |
speed limit 30 rectangle | 48 | 0.2% | 0.87% | 0.03% | 20px | 2.5% | 96px | 12% | 43px | 5.42% | 18px | 1.32% | 99px | 7.28% |
speed limit 120 rectangle | 47 | 0.16% | 1.38% | 0.03% | 18px | 2.25% | 121px | 15.12% | 37px | 4.67% | 18px | 1.32% | 124px | 9.12% |
speed limit 80 rectangle | 37 | 0.19% | 1.08% | 0.04% | 22px | 2.75% | 113px | 14.12% | 41px | 5.16% | 22px | 1.62% | 104px | 7.65% |
speed limit 100 rectangle | 37 | 0.2% | 0.95% | 0.05% | 23px | 2.88% | 109px | 13.62% | 45px | 5.58% | 22px | 1.62% | 95px | 6.99% |
no overtaking rectangle | 32 | 0.19% | 1.19% | 0.04% | 21px | 2.62% | 115px | 14.38% | 40px | 4.99% | 21px | 1.54% | 116px | 8.53% |
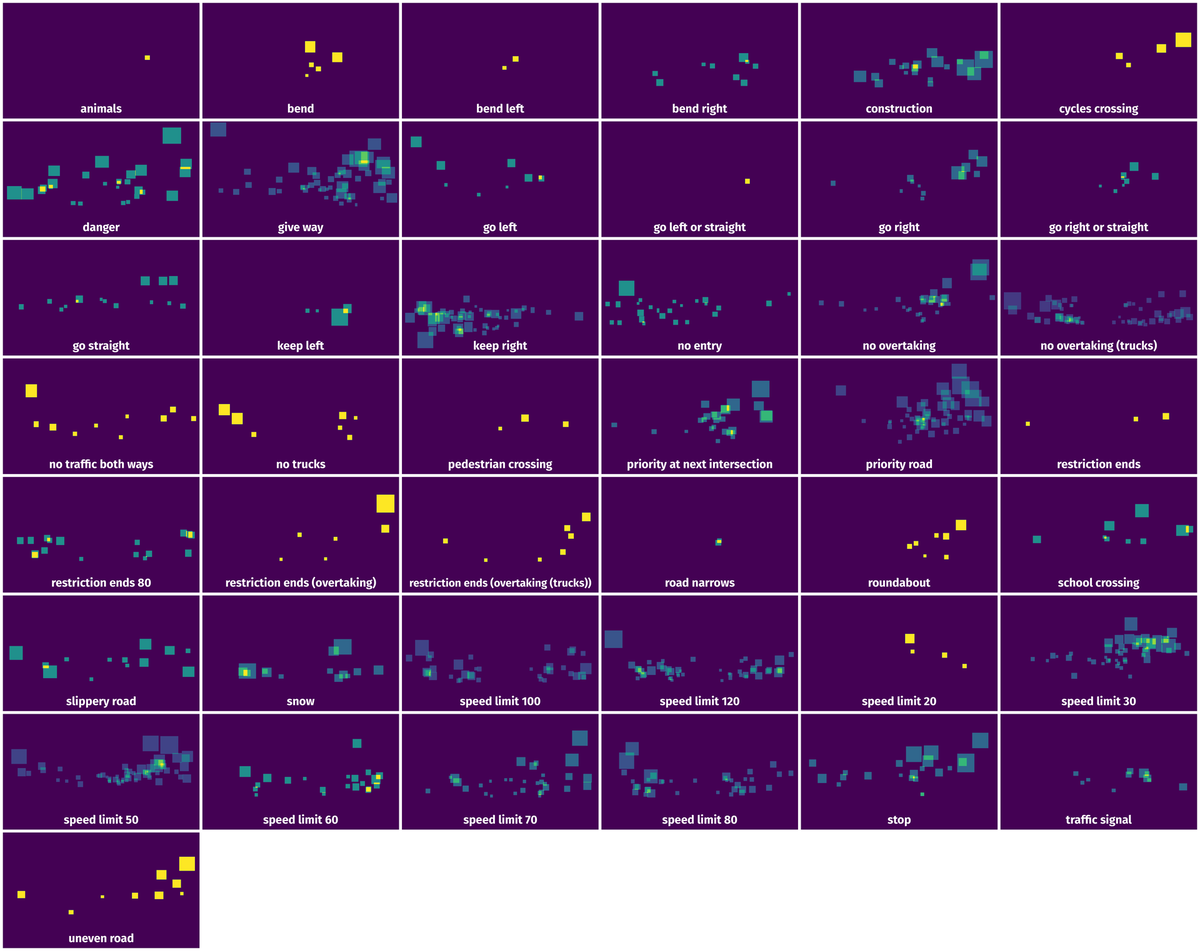
Spatial Heatmap #
The heatmaps below give the spatial distributions of all objects for every class. These visualizations provide insights into the most probable and rare object locations on the image. It helps analyze objects' placements in a dataset.
Objects #
Table contains all 852 objects. Click a row to preview an image with annotations, and use search or pagination to navigate. Sort columns to find outliers in the dataset.
Object ID ㅤ | Class ㅤ | Image name click row to open | Image size height x width | Height ㅤ | Height ㅤ | Width ㅤ | Width ㅤ | Area ㅤ |
|---|---|---|---|---|---|---|---|---|
1➔ | speed limit 50 rectangle | 00141.png | 800 x 1360 | 38px | 4.75% | 38px | 2.79% | 0.13% |
2➔ | stop rectangle | 00236.png | 800 x 1360 | 129px | 16.12% | 119px | 8.75% | 1.41% |
3➔ | cycles crossing rectangle | 00282.png | 800 x 1360 | 31px | 3.88% | 33px | 2.43% | 0.09% |
4➔ | speed limit 80 rectangle | 00288.png | 800 x 1360 | 24px | 3% | 24px | 1.76% | 0.05% |
5➔ | speed limit 80 rectangle | 00288.png | 800 x 1360 | 25px | 3.12% | 24px | 1.76% | 0.06% |
6➔ | keep right rectangle | 00033.png | 800 x 1360 | 67px | 8.38% | 67px | 4.93% | 0.41% |
7➔ | no overtaking rectangle | 00110.png | 800 x 1360 | 25px | 3.12% | 26px | 1.91% | 0.06% |
8➔ | no entry rectangle | 00446.png | 800 x 1360 | 38px | 4.75% | 41px | 3.01% | 0.14% |
9➔ | no entry rectangle | 00446.png | 800 x 1360 | 34px | 4.25% | 37px | 2.72% | 0.12% |
10➔ | keep right rectangle | 00446.png | 800 x 1360 | 34px | 4.25% | 34px | 2.5% | 0.11% |
License #
The training data will be made publicly available on December 1, 2012. The test set will be made available on February 18, 2013. The submission website will be open until the IJCNN’s paper submission deadline.
Citation #
If you make use of the GTSDB data, please cite the following reference:
@inproceedings{Houben-IJCNN-2013,
   author = {Sebastian Houben and Johannes Stallkamp and Jan Salmen and Marc Schlipsing and Christian Igel},
   booktitle = {International Joint Conference on Neural Networks},
   title = {Detection of Traffic Signs in Real-World Images: The {G}erman {T}raffic {S}ign {D}etection {B}enchmark},
   number = {1288},
   year = {2013},
}
If you are happy with Dataset Ninja and use provided visualizations and tools in your work, please cite us:
@misc{ visualization-tools-for-gtsdb-dataset,
  title = { Visualization Tools for GTSDB Dataset },
  type = { Computer Vision Tools },
  author = { Dataset Ninja },
  howpublished = { \url{ https://datasetninja.com/gtsdb } },
  url = { https://datasetninja.com/gtsdb },
  journal = { Dataset Ninja },
  publisher = { Dataset Ninja },
  year = { 2026 },
  month = { jul },
  note = { visited on 2026-07-19 },
}
Download #
Dataset GTSDB can be downloaded in Supervisely format:
As an alternative, it can be downloaded with dataset-tools package:
pip install --upgrade dataset-tools
… using following python code:
import dataset_tools as dtools

dtools.download(dataset='GTSDB', dst_dir='~/dataset-ninja/')
Make sure not to overlook the python code example available on the Supervisely Developer Portal. It will give you a clear idea of how to effortlessly work with the downloaded dataset.
The data in original format can be downloaded here:
Disclaimer #
Our gal from the legal dep told us we need to post this:
Dataset Ninja provides visualizations and statistics for some datasets that can be found online and can be downloaded by general audience. Dataset Ninja is not a dataset hosting platform and can only be used for informational purposes. The platform does not claim any rights for the original content, including images, videos, annotations and descriptions. Joint publishing is prohibited.
You take full responsibility when you use datasets presented at Dataset Ninja, as well as other information, including visualizations and statistics we provide. You are in charge of compliance with any dataset license and all other permissions. You are required to navigate datasets homepage and make sure that you can use it. In case of any questions, get in touch with us at hello@datasetninja.com.