

Introduction #
HRSC2016-MS: A Multi-Scale Updating Version of High Resolution Ship Collections 2016 was developed by expanding and re-annotating the HRSC2016 dataset. Additionally, a novel multi-scale ship-detection framework (MSSDet) is proposed. HRSC2016 is the only open-source optical remote-sensing ship dataset. Owing to the difficulty of data acquisition and annotation, this dataset only contains 1070 images with 2976 ship instances. Moreover, most of the objects in the HRSC2016 dataset are larger than those in natural images. As is well known, the detection of small and size-varied objects is a challenging problem. Therefore, the authors built an open-source ship detection benchmark with rich multi-scale ship targets named HRSC2016-MS.
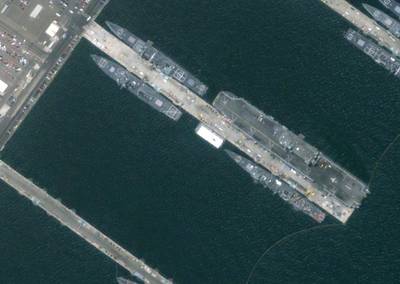
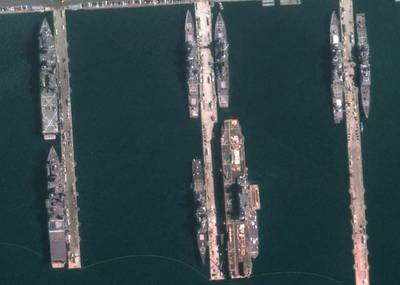
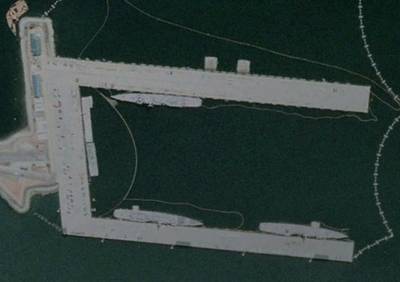
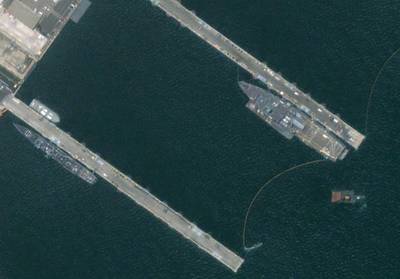
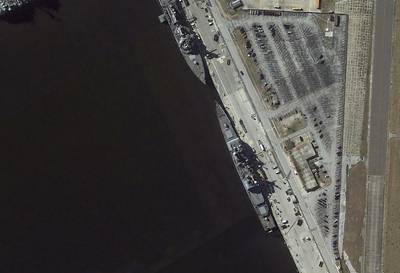
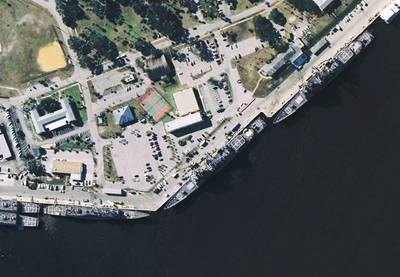
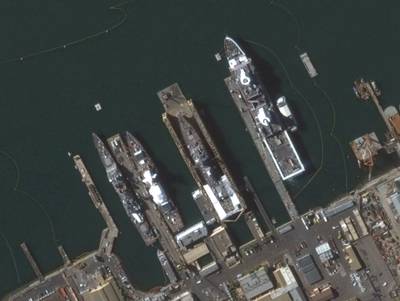
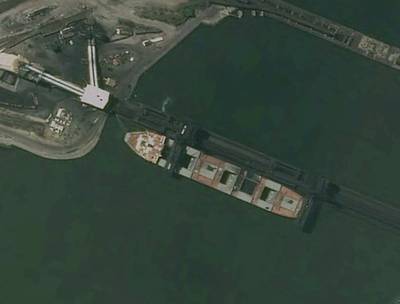
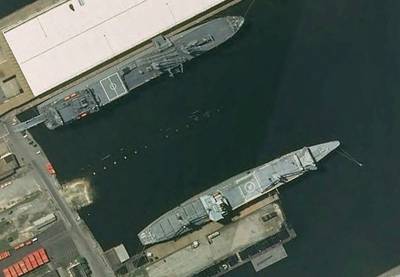
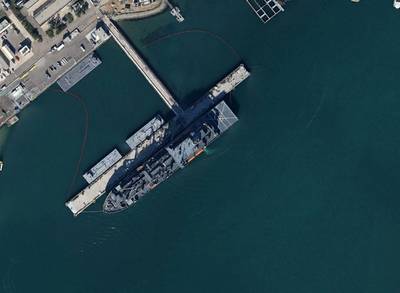
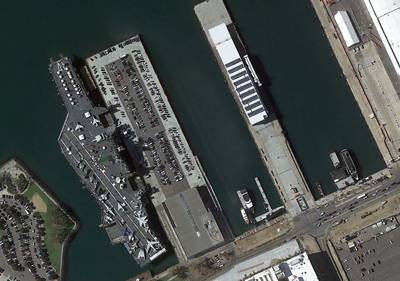
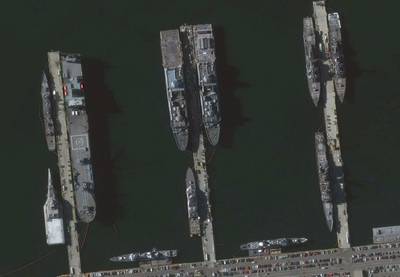
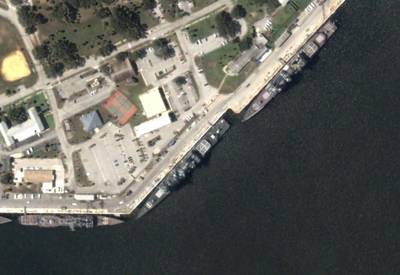
The optical remote-sensing images in HRSC2016-MS come from two sources: previous studies on HRSC2016 and new collections from Google Earth. The first part of HRSC2016-MS is composed of the original data in HRSC2016, which is captured from the harbors in the United States. The original HRSC2016 dataset only contains 1070 optical remote-sensing images with 2976 ship instances, and a large number of small-ship instances are missing annotations, which motivated us to re-annotate the original data. The second part of HRSC2016-MS consists of 610 optical remote-sensing images collected from Google Earth captured from Murmansk harbor, Russia. The new collections include sea and sea–land images, day and night scenarios, clear and cloudy weather, and multi-scale ship instances. A comparison of the proposed HRSC2016-MS dataset and the original HRSC2016 dataset is shown in the Table below. It can be seen that the proposed dataset contains a larger number of images and a wider range of image sizes than the original dataset. More importantly, the proposed dataset includes more multi-scale ship instances with a broader range of aspect ratios than the original dataset. Therefore, the diversity of the HRSC2016-MS dataset is increased compared with the original dataset, and the ship-detection task for this dataset is more challenging.
| Dataset | HRSC2016 | HRSC2016-MS |
|---|---|---|
| Images | 1070 | 1680 |
| Image sizes | 481 × 411∼1238 × 837 | 361 × 339∼1329 × 830 |
| Instances | 2976 | 7655 |
| Instance sizes | 48 × 22∼713 × 505 | 5 × 10∼489 × 739 |
| Instance aspect ratios | 0.102∼10.0 | 0.092∼11.692 |
Comparison of proposed and original datasets.
The authors visualized the original annotation files in the HRSC2016 dataset and found that numerous ship instances were mislabeled. The label set in the original dataset is a tree structure containing 1, 4, and 27 classes in ship-class, ship-category, and ship-type levels, respectively. Undoubtedly, an elaborate label set contributes to the convergence of the detector during the training period, but such a label set will create the problem of annotation omission because a limited label set cannot cover all types of ships. Therefore, in the proposed dataset, the label set only covers one class, i.e., ship. The authors used roLabelImg to label the images in the proposed dataset. Each ship instance is annotated in two ways, i.e., using an HBB and an OBB.
The authors annotated the new images and re-annotated the original images with the proposed annotation method. The authors reduced the dimensions of the dataset to two based on principal component analysis (PCA) and then visualized the data distribution. As shown in the figure below, the authors analyzed the data distribution of the original and proposed datasets and found that the two datasets have similar data distributions.
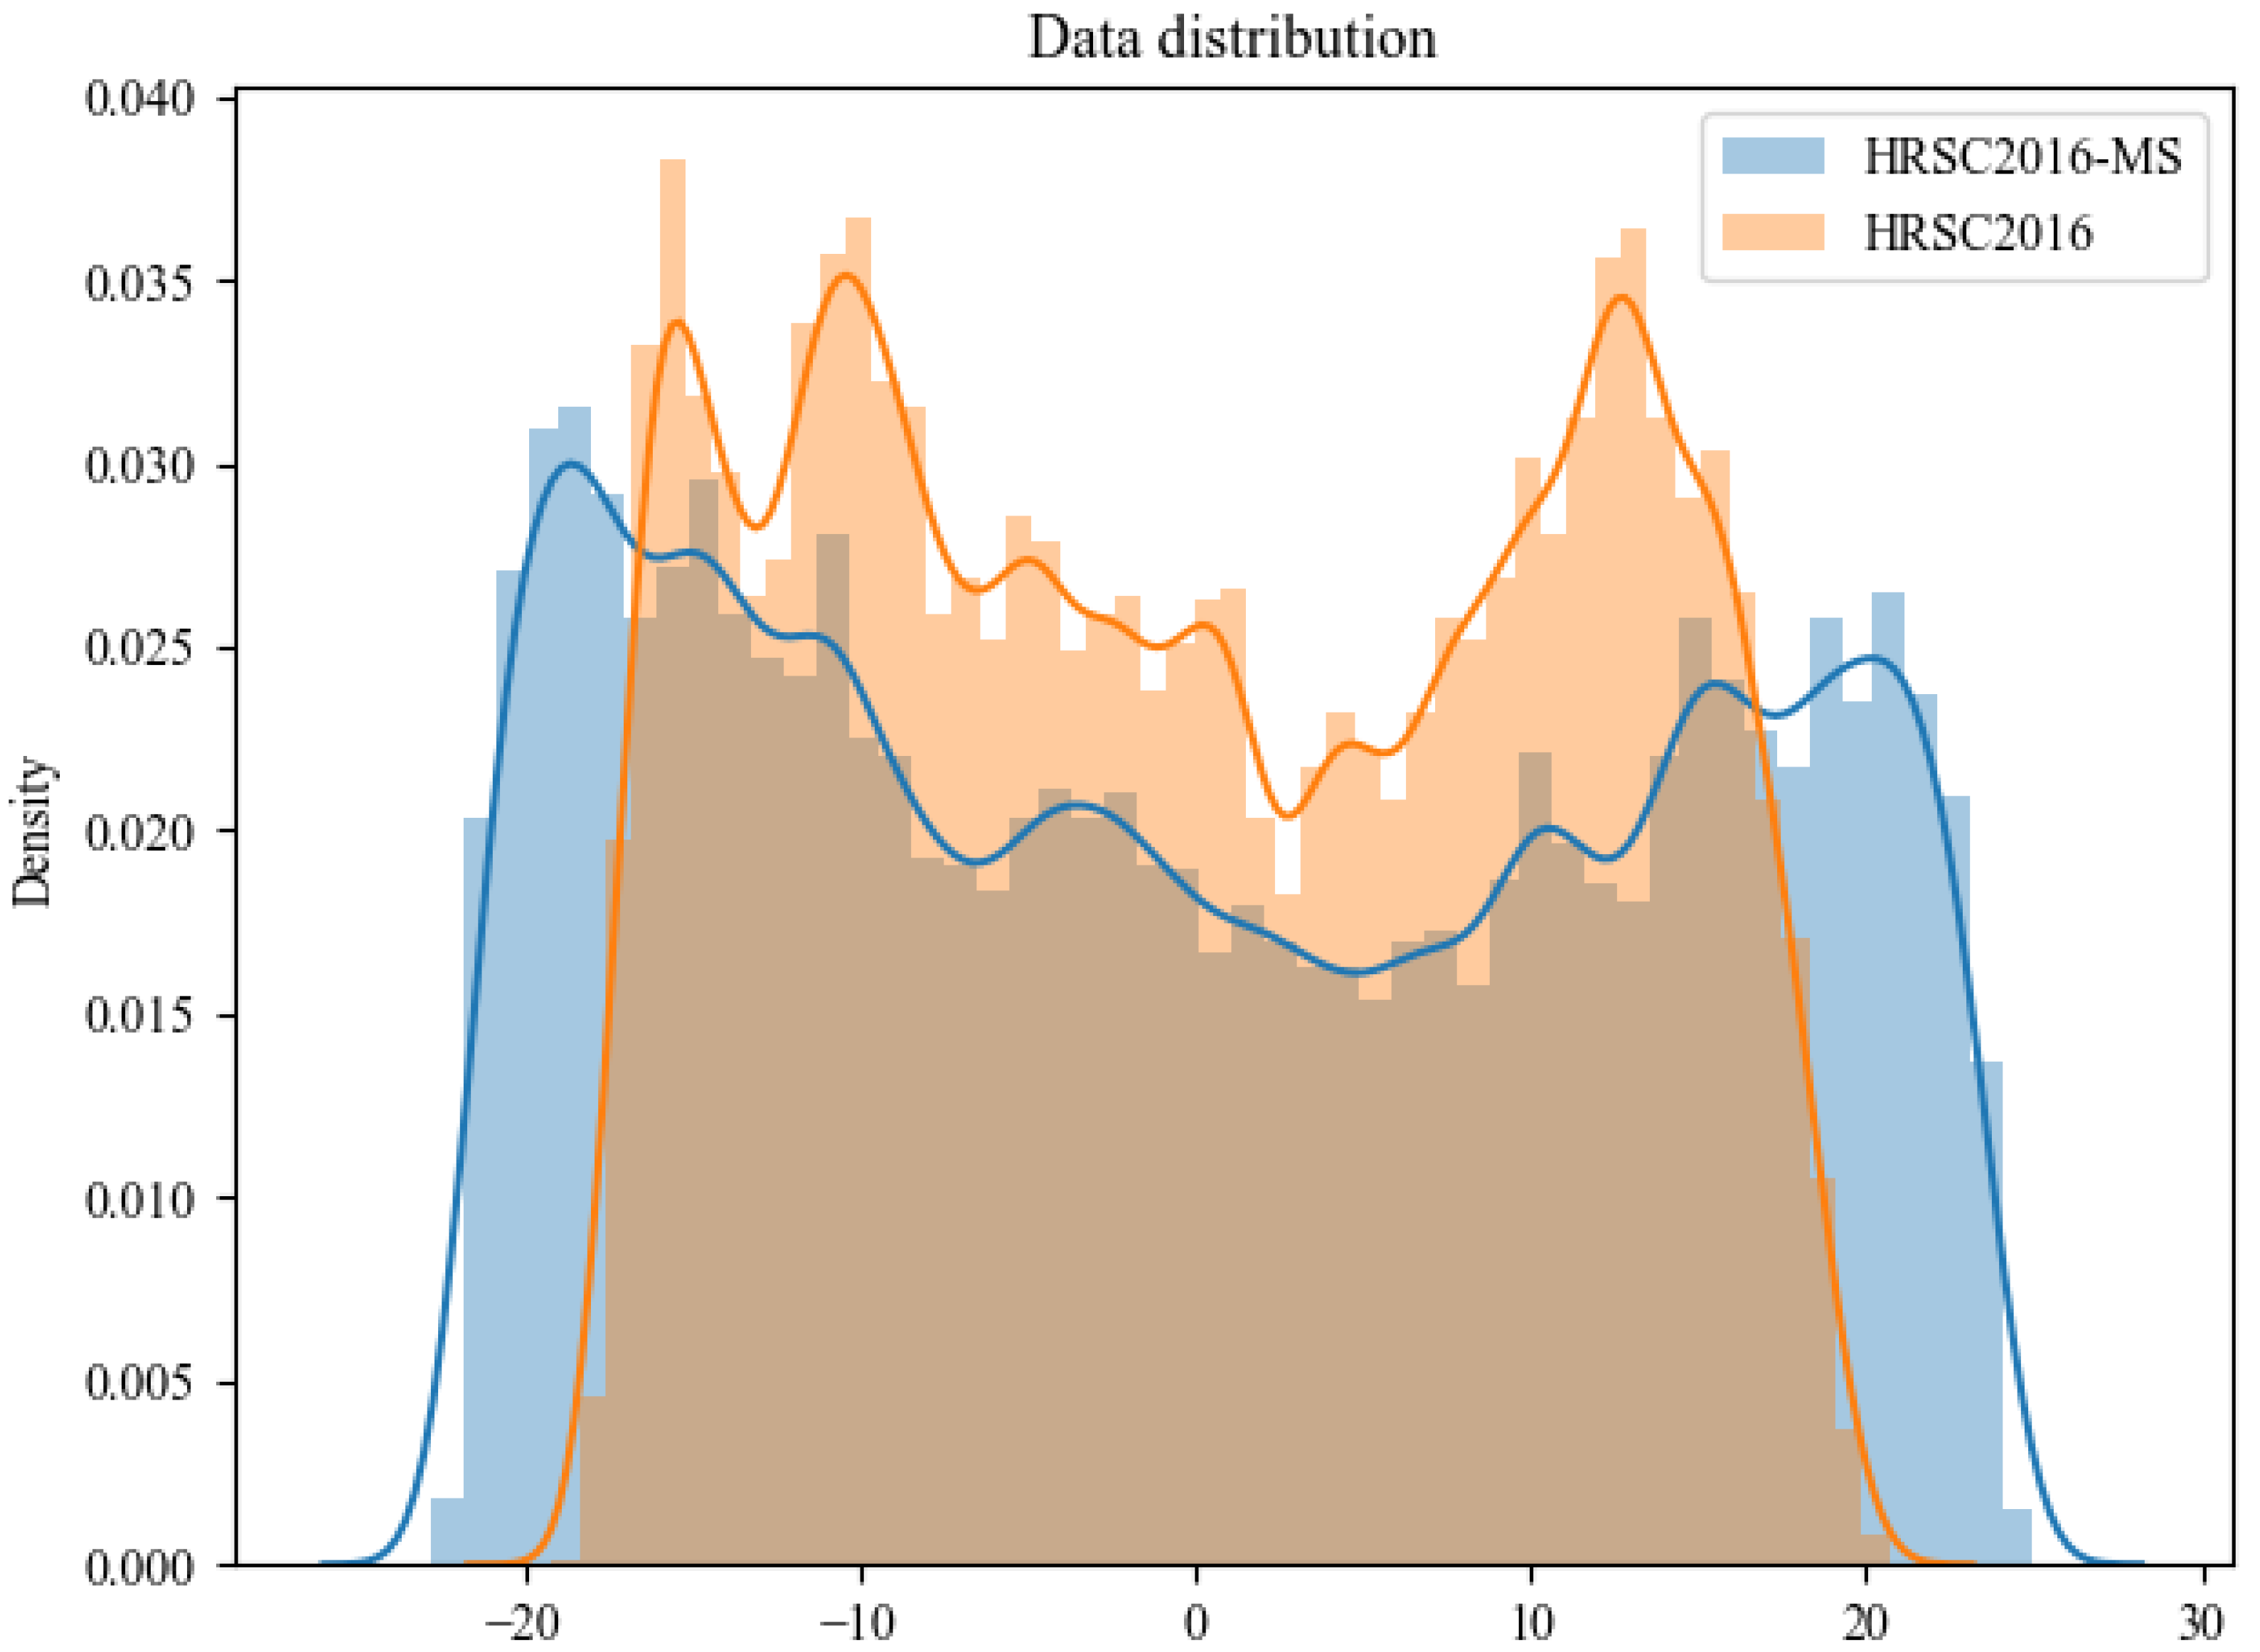
Data distribution of original HRSC2016 and proposed HRSC2016-MS datasets.
Following the standard COCO evaluation approach, objects with sizes smaller than 32×32 pixels are small, objects with sizes larger than 96×96 pixels are large, and the rest are medium objects. The number of small, medium, and large objects in the original HRSC2016 dataset is 0, 319, and 2657, respectively, while it is 880, 2447, and 4328 in the proposed HRSC2016-MS dataset. Obviously, the proposed dataset contains more multi-scale ship instances, especially small objects.
 Homepage
 Research Paper
Summary #
HRSC2016-MS: A Multi-Scale Updating Version of High Resolution Ship Collections 2016 is a dataset for an object detection task. It is used in the logistics and safety industries.
The dataset consists of 1680 images with 7655 labeled objects belonging to 1 single class (ship).
Images in the HRSC2016-MS dataset have bounding box annotations. There are 26 (2% of the total) unlabeled images (i.e. without annotations). There are 3 splits in the dataset: test (610 images), train (610 images), and val (460 images). The dataset was released in 2022 by the Xidian University and Chongqing University of Posts and Telecommunications, China.
Explore #
HRSC2016-MS dataset has 1680 images. Click on one of the examples below or open "Explore" tool anytime you need to view dataset images with annotations. This tool has extended visualization capabilities like zoom, translation, objects table, custom filters and more. Hover the mouse over the images to hide or show annotations.


Class balance #
There are 1 annotation classes in the dataset. Find the general statistics and balances for every class in the table below. Click any row to preview images that have labels of the selected class. Sort by column to find the most rare or prevalent classes.

Class ㅤ | Images ㅤ | Objects ㅤ | Count on image average | Area on image average |
|---|---|---|---|---|
ship➔ rectangle | 1654 | 7655 | 4.63 | 14.98% |
Images #
Explore every single image in the dataset with respect to the number of annotations of each class it has. Click a row to preview selected image. Sort by any column to find anomalies and edge cases. Use horizontal scroll if the table has many columns for a large number of classes in the dataset.
Object distribution #
Interactive heatmap chart for every class with object distribution shows how many images are in the dataset with a certain number of objects of a specific class. Users can click cell and see the list of all corresponding images.
Class sizes #
The table below gives various size properties of objects for every class. Click a row to see the image with annotations of the selected class. Sort columns to find classes with the smallest or largest objects or understand the size differences between classes.
Class | Object count | Avg area | Max area | Min area | Min height | Min height | Max height | Max height | Avg height | Avg height | Min width | Min width | Max width | Max width |
|---|---|---|---|---|---|---|---|---|---|---|---|---|---|---|
ship rectangle | 7655 | 3.64% | 42.02% | 0.01% | 6px | 0.74% | 763px | 92.71% | 156px | 19.88% | 6px | 0.51% | 796px | 81.94% |
Spatial Heatmap #
The heatmaps below give the spatial distributions of all objects for every class. These visualizations provide insights into the most probable and rare object locations on the image. It helps analyze objects' placements in a dataset.
Objects #
Table contains all 7655 objects. Click a row to preview an image with annotations, and use search or pagination to navigate. Sort columns to find outliers in the dataset.
Object ID ㅤ | Class ㅤ | Image name click row to open | Image size height x width | Height ㅤ | Height ㅤ | Width ㅤ | Width ㅤ | Area ㅤ |
|---|---|---|---|---|---|---|---|---|
1➔ | ship rectangle | 100000796.bmp | 812 x 1056 | 417px | 51.35% | 168px | 15.91% | 8.17% |
2➔ | ship rectangle | 100000796.bmp | 812 x 1056 | 29px | 3.57% | 24px | 2.27% | 0.08% |
3➔ | ship rectangle | 100000971.bmp | 821 x 1112 | 745px | 90.74% | 202px | 18.17% | 16.48% |
4➔ | ship rectangle | 100000970.bmp | 830 x 1183 | 369px | 44.46% | 155px | 13.1% | 5.82% |
5➔ | ship rectangle | 100000970.bmp | 830 x 1183 | 616px | 74.22% | 318px | 26.88% | 19.95% |
6➔ | ship rectangle | 100000970.bmp | 830 x 1183 | 366px | 44.1% | 153px | 12.93% | 5.7% |
7➔ | ship rectangle | 100000970.bmp | 830 x 1183 | 301px | 36.27% | 120px | 10.14% | 3.68% |
8➔ | ship rectangle | 100001024.bmp | 749 x 986 | 221px | 29.51% | 457px | 46.35% | 13.68% |
9➔ | ship rectangle | 100001213.bmp | 839 x 1187 | 482px | 57.45% | 228px | 19.21% | 11.03% |
10➔ | ship rectangle | 100001213.bmp | 839 x 1187 | 155px | 18.47% | 103px | 8.68% | 1.6% |
License #
Citation #
If you make use of the HRSC2016-MS data, please cite the following reference:
@Article{rs14215460,
  AUTHOR = {Chen, Weiming and Han, Bing and Yang, Zheng and Gao, Xinbo},
  TITLE = {MSSDet: Multi-Scale Ship-Detection Framework in Optical Remote-Sensing Images and New Benchmark},
  JOURNAL = {Remote Sensing},
  VOLUME = {14},
  YEAR = {2022},
  NUMBER = {21},
  ARTICLE-NUMBER = {5460},
  URL = {https://www.mdpi.com/2072-4292/14/21/5460},
  ISSN = {2072-4292},
  DOI = {10.3390/rs14215460}
}
If you are happy with Dataset Ninja and use provided visualizations and tools in your work, please cite us:
@misc{ visualization-tools-for-hrsc2016-ms-dataset,
  title = { Visualization Tools for HRSC2016-MS Dataset },
  type = { Computer Vision Tools },
  author = { Dataset Ninja },
  howpublished = { \url{ https://datasetninja.com/hrsc2016-ms } },
  url = { https://datasetninja.com/hrsc2016-ms },
  journal = { Dataset Ninja },
  publisher = { Dataset Ninja },
  year = { 2026 },
  month = { jul },
  note = { visited on 2026-07-21 },
}
Download #
Dataset HRSC2016-MS can be downloaded in Supervisely format:
As an alternative, it can be downloaded with dataset-tools package:
pip install --upgrade dataset-tools
… using following python code:
import dataset_tools as dtools

dtools.download(dataset='HRSC2016-MS', dst_dir='~/dataset-ninja/')
Make sure not to overlook the python code example available on the Supervisely Developer Portal. It will give you a clear idea of how to effortlessly work with the downloaded dataset.
Disclaimer #
Our gal from the legal dep told us we need to post this:
Dataset Ninja provides visualizations and statistics for some datasets that can be found online and can be downloaded by general audience. Dataset Ninja is not a dataset hosting platform and can only be used for informational purposes. The platform does not claim any rights for the original content, including images, videos, annotations and descriptions. Joint publishing is prohibited.
You take full responsibility when you use datasets presented at Dataset Ninja, as well as other information, including visualizations and statistics we provide. You are in charge of compliance with any dataset license and all other permissions. You are required to navigate datasets homepage and make sure that you can use it. In case of any questions, get in touch with us at hello@datasetninja.com.