

Introduction #
The authors address the prominence of artificial intelligence in the medical field, specifically in the context of sparse medical data due to legal restrictions and the labor-intensive nature of labeling training data. They present the HyperKvasir dataset, which is currently the most extensive collection of images and videos related to the gastrointestinal tract. This dataset, comprising 110,079 images and 374 videos, was obtained from real gastro- and colonoscopy examinations at Bærum Hospital in Norway and partially labeled by experienced gastrointestinal endoscopists. The dataset encompasses a variety of anatomical landmarks, normal findings, and pathological conditions. The combined image and video frames amount to approximately 1 million.
The human gastrointestinal (GI) tract experiences a range of mucosal abnormalities, including benign and life-threatening diseases. GI cancers, in particular, contribute to a significant global health burden. Endoscopy serves as the gold-standard diagnostic tool for GI tract examination, but its effectiveness is influenced by the variability in operator performance. Improved endoscopic outcomes are crucial for preventing GI-related morbidity and mortality, and artificial intelligence (AI) support systems have shown promise in enhancing endoscopic performance.
However, AI-based solutions require large, well-labeled datasets for training machine learning models. Obtaining such datasets in the medical domain is challenging due to legal constraints and data collection difficulties. Despite these challenges, AI-based diagnostic tools for endoscopy are emerging.
To address these limitations, the authors introduced the HyperKvasir dataset. This dataset comprises images and videos collected from routine clinical examinations at a Norwegian hospital between 2008 and 2016. The images were obtained from the Picsara image documentation database. The dataset was progressively expanded and used by researchers worldwide to develop various AI models for GI endoscopy.
The dataset contains labeled-images, segmented-images, and unlabeled-images. Labeled images are categorized based on the location in the GI tract, the quality of mucosal views, pathological findings, and therapeutic interventions. The lower GI tract is examined during colonoscopy, including the terminal ileum, colon, and rectum, while the upper GI tract includes the esophagus, stomach, and duodenum.
The various image classes structured under position and type, also the structure of the stored images.
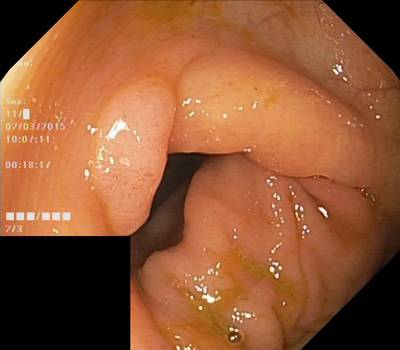
For the lower GI tract, the dataset includes anatomical landmarks, bowel preparation quality, and various pathological findings such as ulcerative colitis, polyps, and hemorrhoids. Therapeutic interventions, such as polyp removal and ulcer injection, are also covered.
In the upper GI tract, the dataset features anatomical landmarks and pathological findings, including reflux esophagitis and Barrett’s esophagus.
The unlabeled images are provided for further research and analysis.
In summary, the HyperKvasir dataset offers a valuable resource for developing AI-based diagnostic tools for endoscopy, particularly for the gastrointestinal tract. The dataset is open access and freely available to researchers, supporting advancements in the field of medical AI.
 Homepage
 Research Paper
 GitHub
Summary #
HyperKvasir: The Largest Gastrointestinal Dataset (Images) is a dataset for instance segmentation, semantic segmentation, object detection, classification, and semi supervised learning tasks. It is used in the medical industry.
The dataset consists of 111079 images with 2134 labeled objects belonging to 2 different classes including polyp and polyp_bbox.
Images in the HyperKvasir Images dataset have pixel-level instance segmentation and bounding box annotations. Due to the nature of the instance segmentation task, it can be automatically transformed into a semantic segmentation task (only one mask for every class). There are 110079 (99% of the total) unlabeled images (i.e. without annotations). There are 3 splits in the dataset: unlabeled-images (99417 images), labeled-images (10662 images), and segmented-images (1000 images). Alternatively, the dataset could be split into 2 GI tracts: lower-gi-tract (7210 images) and upper-gi-tract (3452 images), or into 4 categories of findings: anatomical-landmarks (4104 images), pathological-findings (2642 images), therapeutic-interventions (1991 images), and quality-of-mucosal-views (1925 images), or into 23 classification image sets: bbps-2-3 (1148 images), polyps (1028 images), cecum (1009 images), dyed-lifted-polyps (1002 images), pylorus (999 images), dyed-resection-margins (989 images), z-line (932 images), retroflex-stomach (764 images), bbps-0-1 (646 images), ulcerative-colitis-grade-2 (443 images), esophagitis-a (403 images), retroflex-rectum (391 images), esophagitis-b-d (260 images), ulcerative-colitis-grade-1 (201 images), ulcerative-colitis-grade-3 (133 images), impacted-stool (131 images), barretts-short-segment (53 images), barretts (41 images), ulcerative-colitis-grade-0-1 (35 images), ulcerative-colitis-grade-2-3 (28 images), ulcerative-colitis-grade-1-2 (11 images), ileum (9 images), and hemorrhoids (6 images). The dataset was released in 2020 by the NO-SW-AU joint research group.
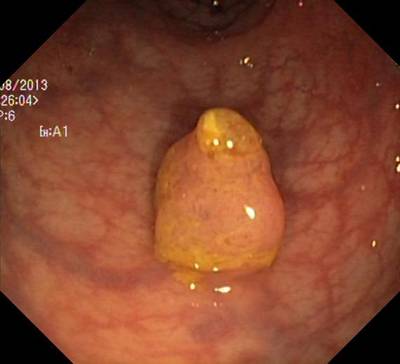
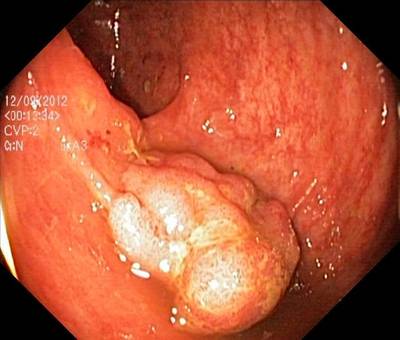
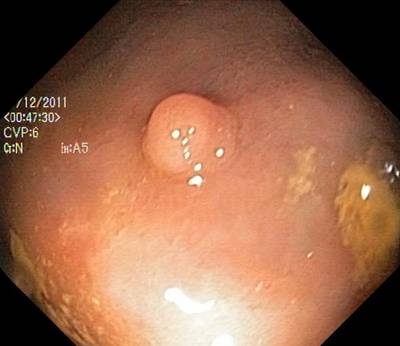
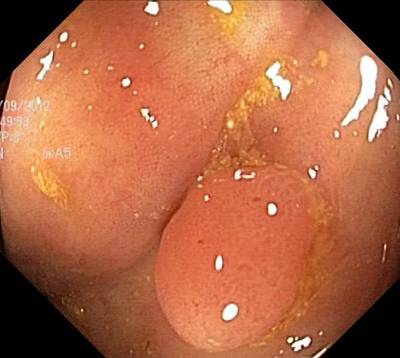
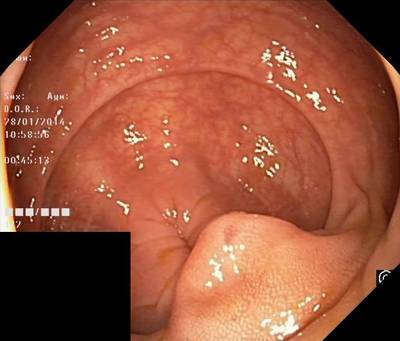
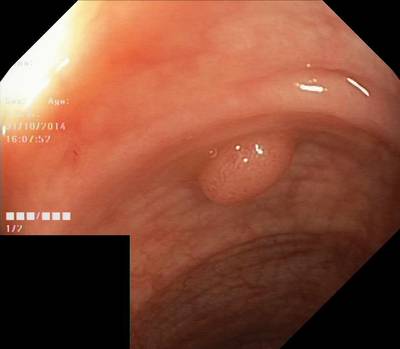
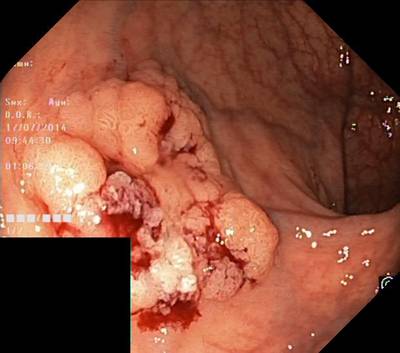
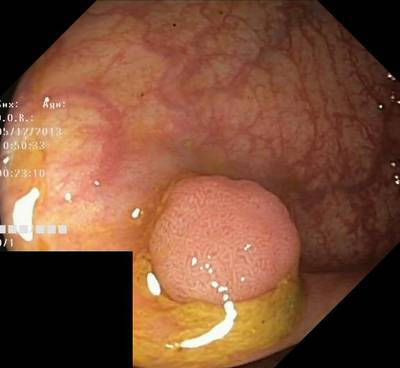
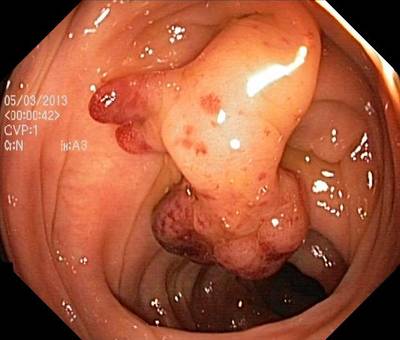
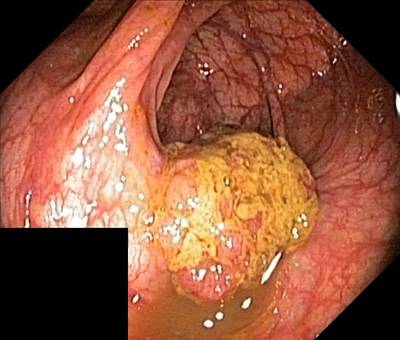
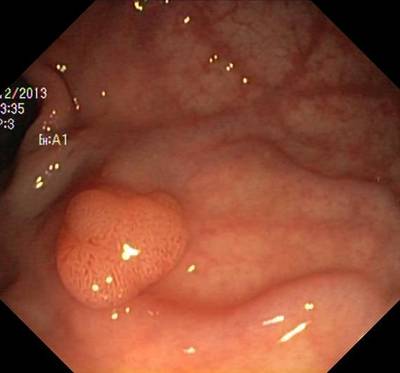
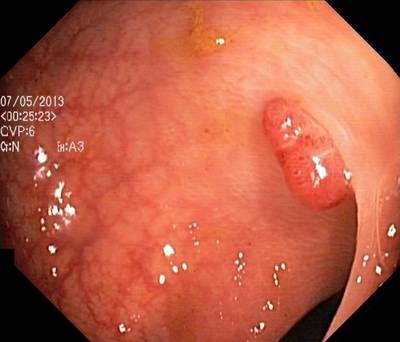
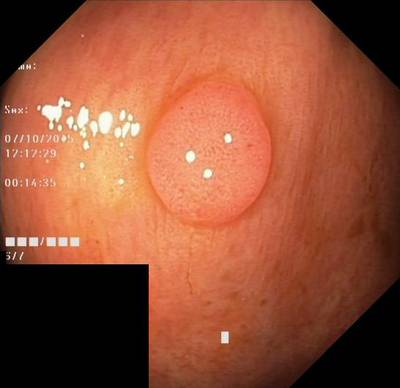
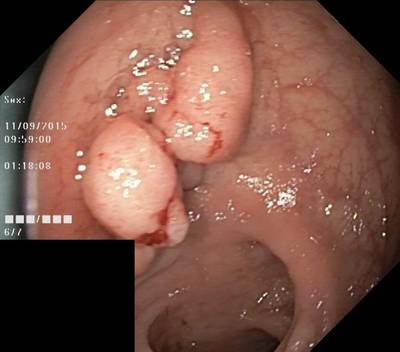
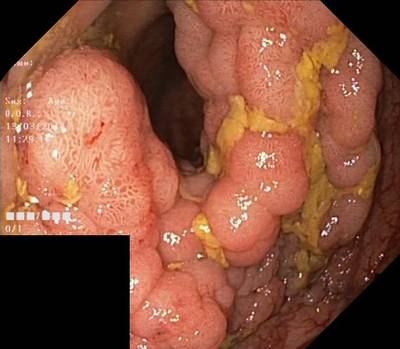
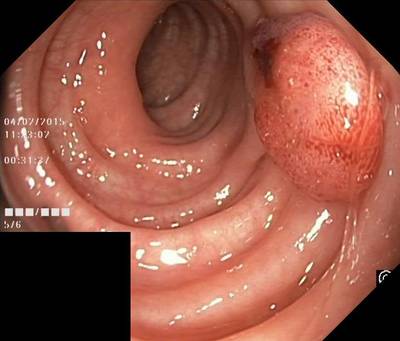
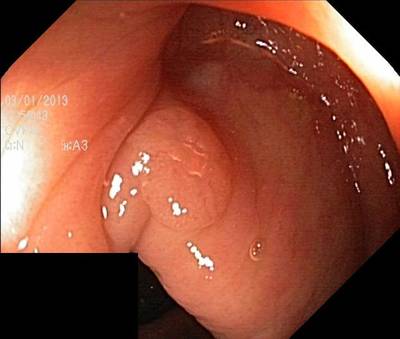
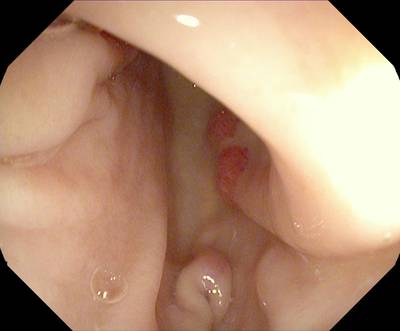
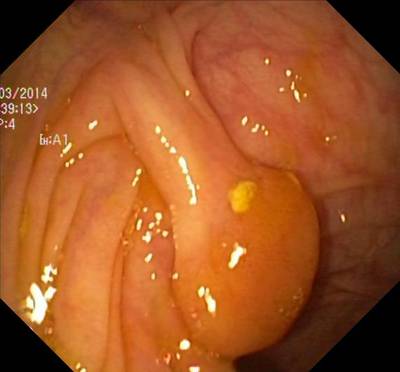
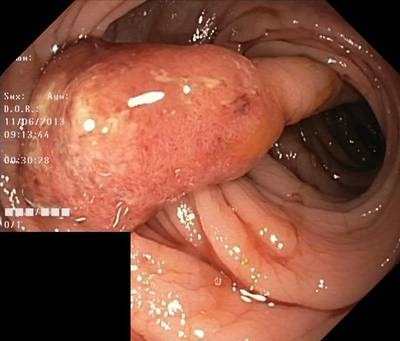
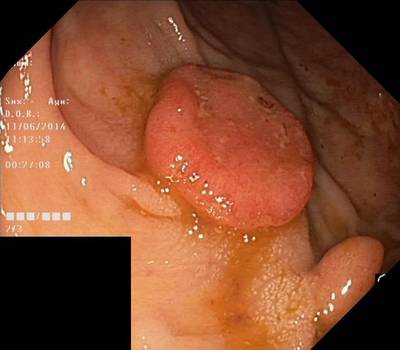
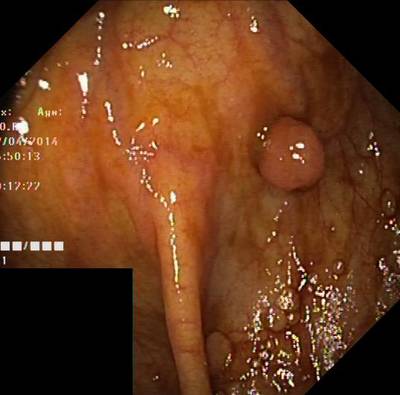
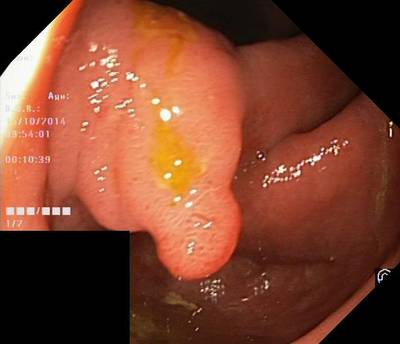
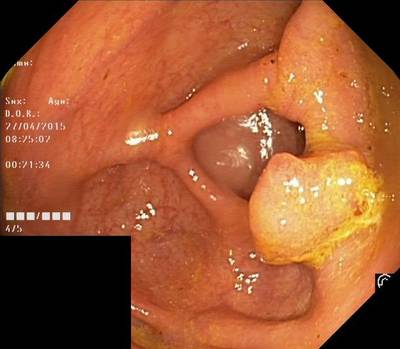
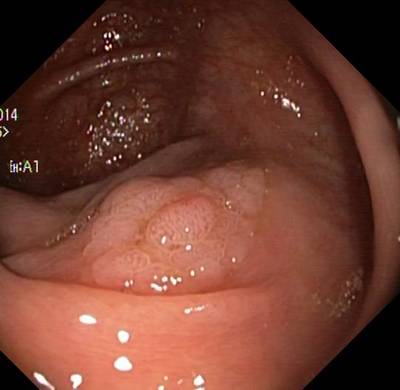
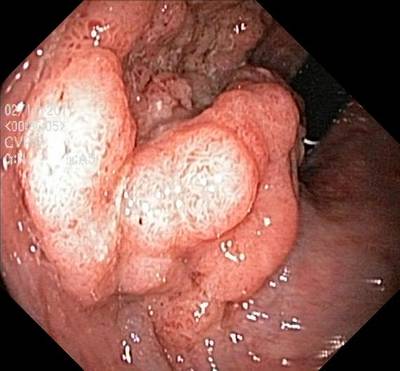
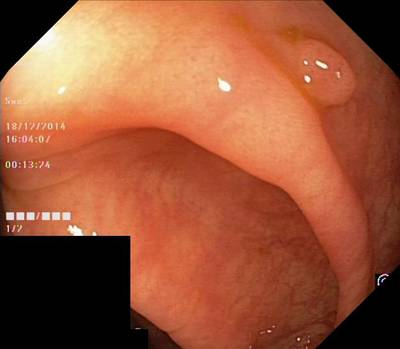
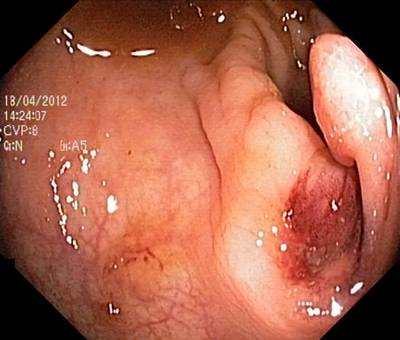
Here are the visualized examples for the classes:
Explore #
HyperKvasir Images dataset has 111079 images. Click on one of the examples below or open "Explore" tool anytime you need to view dataset images with annotations. This tool has extended visualization capabilities like zoom, translation, objects table, custom filters and more. Hover the mouse over the images to hide or show annotations.


Class balance #
There are 2 annotation classes in the dataset. Find the general statistics and balances for every class in the table below. Click any row to preview images that have labels of the selected class. Sort by column to find the most rare or prevalent classes.

Class ㅤ | Images ㅤ | Objects ㅤ | Count on image average | Area on image average |
|---|---|---|---|---|
polyp_bbox➔ rectangle | 1000 | 1071 | 1.07 | 22.9% |
polyp➔ mask | 1000 | 1064 | 1.06 | 15.39% |
Co-occurrence matrix #
Co-occurrence matrix is an extremely valuable tool that shows you the images for every pair of classes: how many images have objects of both classes at the same time. If you click any cell, you will see those images. We added the tooltip with an explanation for every cell for your convenience, just hover the mouse over a cell to preview the description.
Images #
Explore every single image in the dataset with respect to the number of annotations of each class it has. Click a row to preview selected image. Sort by any column to find anomalies and edge cases. Use horizontal scroll if the table has many columns for a large number of classes in the dataset.
Object distribution #
Interactive heatmap chart for every class with object distribution shows how many images are in the dataset with a certain number of objects of a specific class. Users can click cell and see the list of all corresponding images.
Class sizes #
The table below gives various size properties of objects for every class. Click a row to see the image with annotations of the selected class. Sort columns to find classes with the smallest or largest objects or understand the size differences between classes.
Class | Object count | Avg area | Max area | Min area | Min height | Min height | Max height | Max height | Avg height | Avg height | Min width | Min width | Max width | Max width |
|---|---|---|---|---|---|---|---|---|---|---|---|---|---|---|
polyp_bbox rectangle | 1071 | 21.38% | 100% | 0% | 2px | 0.37% | 1070px | 100% | 252px | 46.16% | 2px | 0.32% | 1348px | 100% |
polyp mask | 1064 | 14.47% | 81.18% | 0.02% | 10px | 1.89% | 1070px | 100% | 265px | 48.59% | 10px | 1.78% | 1348px | 100% |
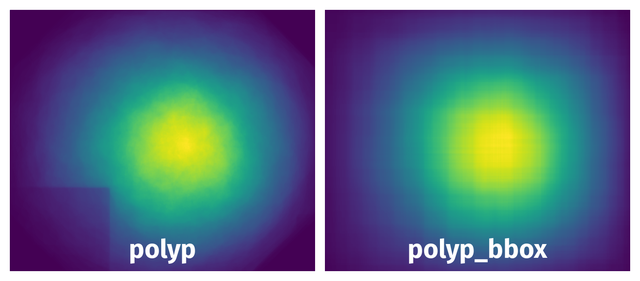
Spatial Heatmap #
The heatmaps below give the spatial distributions of all objects for every class. These visualizations provide insights into the most probable and rare object locations on the image. It helps analyze objects' placements in a dataset.
Objects #
Table contains all 2135 objects. Click a row to preview an image with annotations, and use search or pagination to navigate. Sort columns to find outliers in the dataset.
Object ID ㅤ | Class ㅤ | Image name click row to open | Image size height x width | Height ㅤ | Height ㅤ | Width ㅤ | Width ㅤ | Area ㅤ |
|---|---|---|---|---|---|---|---|---|
1➔ | polyp mask | 419b95af-cd80-4fb5-95d3-55aa3d223a6b.jpg | 531 x 617 | 58px | 10.92% | 91px | 14.75% | 1.11% |
2➔ | polyp_bbox rectangle | 419b95af-cd80-4fb5-95d3-55aa3d223a6b.jpg | 531 x 617 | 60px | 11.3% | 93px | 15.07% | 1.7% |
3➔ | polyp mask | 591e4914-7850-4112-8412-d0376399fd3b.jpg | 547 x 626 | 363px | 66.36% | 326px | 52.08% | 23.42% |
4➔ | polyp_bbox rectangle | 591e4914-7850-4112-8412-d0376399fd3b.jpg | 547 x 626 | 365px | 66.73% | 328px | 52.4% | 34.96% |
5➔ | polyp mask | cd92976c-0825-4d91-844c-3881b17987e8.jpg | 547 x 627 | 373px | 68.19% | 241px | 38.44% | 18.53% |
6➔ | polyp_bbox rectangle | cd92976c-0825-4d91-844c-3881b17987e8.jpg | 547 x 627 | 375px | 68.56% | 243px | 38.76% | 26.57% |
7➔ | polyp mask | bc02e3ed-94af-402e-a860-9686af5af550.jpg | 530 x 603 | 413px | 77.92% | 307px | 50.91% | 25.26% |
8➔ | polyp_bbox rectangle | bc02e3ed-94af-402e-a860-9686af5af550.jpg | 530 x 603 | 414px | 78.11% | 309px | 51.24% | 40.03% |
9➔ | polyp mask | 9da08cc4-d0a2-4071-9d23-feb9b1ad422b.jpg | 528 x 623 | 146px | 27.65% | 30px | 4.82% | 0.88% |
10➔ | polyp_bbox rectangle | 9da08cc4-d0a2-4071-9d23-feb9b1ad422b.jpg | 528 x 623 | 148px | 28.03% | 32px | 5.14% | 1.44% |
License #
Citation #
If you make use of the HyperKvasir Segmentation data, please cite the following reference:
@article{Borgli2020,
  title = {{HyperKvasir, a comprehensive multi-class
    image and video dataset for gastrointestinal endoscopy}},
  author = {
    Borgli, Hanna and Thambawita, Vajira and
    Smedsrud, Pia H and Hicks, Steven and Jha, Debesh and
    Eskeland, Sigrun L and Randel, Kristin Ranheim and
    Pogorelov, Konstantin and Lux, Mathias and
    Nguyen, Duc Tien Dang and Johansen, Dag and
    Griwodz, Carsten and Stensland, H{\aa}kon K and
    Garcia-Ceja, Enrique and Schmidt, Peter T and
    Hammer, Hugo L and Riegler, Michael A and
    Halvorsen, P{\aa}l and de Lange, Thomas
  },
  doi = {10.1038/s41597-020-00622-y},
  issn = {2052-4463},
  journal = {Scientific Data},
  number = {1},
  pages = {283},
  url = {https://doi.org/10.1038/s41597-020-00622-y},
  volume = {7},
  year = {2020}
}
If you are happy with Dataset Ninja and use provided visualizations and tools in your work, please cite us:
@misc{ visualization-tools-for-hyper-kvasir-dataset,
  title = { Visualization Tools for HyperKvasir Images Dataset },
  type = { Computer Vision Tools },
  author = { Dataset Ninja },
  howpublished = { \url{ https://datasetninja.com/hyper-kvasir } },
  url = { https://datasetninja.com/hyper-kvasir },
  journal = { Dataset Ninja },
  publisher = { Dataset Ninja },
  year = { 2026 },
  month = { jul },
  note = { visited on 2026-07-20 },
}
Download #
Dataset HyperKvasir Images can be downloaded in Supervisely format:
As an alternative, it can be downloaded with dataset-tools package:
pip install --upgrade dataset-tools
… using following python code:
import dataset_tools as dtools

dtools.download(dataset='HyperKvasir Images', dst_dir='~/dataset-ninja/')
Make sure not to overlook the python code example available on the Supervisely Developer Portal. It will give you a clear idea of how to effortlessly work with the downloaded dataset.
The data in original format can be downloaded here.
Disclaimer #
Our gal from the legal dep told us we need to post this:
Dataset Ninja provides visualizations and statistics for some datasets that can be found online and can be downloaded by general audience. Dataset Ninja is not a dataset hosting platform and can only be used for informational purposes. The platform does not claim any rights for the original content, including images, videos, annotations and descriptions. Joint publishing is prohibited.
You take full responsibility when you use datasets presented at Dataset Ninja, as well as other information, including visualizations and statistics we provide. You are in charge of compliance with any dataset license and all other permissions. You are required to navigate datasets homepage and make sure that you can use it. In case of any questions, get in touch with us at hello@datasetninja.com.