
Introduction #
The authors of the Object Detection 47k part of the India Driving Dataset (IDD): A Dataset for Exploring Problems of Autonomous Navigation in Unconstrained Environments highlight a notable gap in existing datasets, which primarily focus on structured driving environments with well-defined infrastructure, limited traffic categories, and adherence to traffic rules. To fill this void, the authors present IDD, a novel dataset tailored for road scene understanding in unstructured environments, specifically on Indian roads. The updated version of the dataset (acquired in Oct, 2023) comprises 47k images, meticulously annotated with 40 classes, derived from different side.
There are 2 different versions available at DatasetNinja:
- IDD: Segmentation
- IDD: Object Detection (current)
IDD diverges from popular benchmarks like Cityscapes, introducing an expanded label set to accommodate new classes and reflecting label distributions that deviate significantly from existing datasets. The dataset captures the complexity of unstructured road scenes, featuring classes with greater within-class diversity. Additionally, IDD identifies new classes such as drivable areas beyond the road. The authors propose a four-level label hierarchy (level1id, level2id, level3id, level4id) to allow varying levels of complexity, opening avenues for new training methods. Please note, that some labels were not specified by their category
Label distribution in the initial IDD-10k dataset. The following information is shown here: (i) pixel counts of individual labels on the y-axis (ii) four-level label hierarchy used by the dataset at the bottom, (iv) the color legend for the predicted and ground truth masks shown in the paper is used for the corresponding bars. There are 4 levels of the hierarchy giving different complexity levels for training models
Autonomous navigation is rapidly advancing, and the availability of large-scale datasets is a crucial contributor to this progress. However, challenges persist, particularly in achieving data scale and diversity necessary for ensuring safety and reliability in diverse and unstructured environments. The authors assert that IDD, with its focus on less structured environments, better aligns with the needs of autonomous navigation in various parts of the world, including Asia, South America, and Africa.
Dataset properties
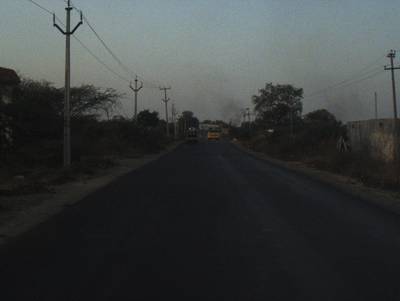
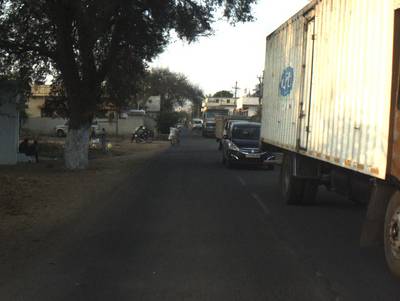
The dataset is collected in India, offering road scenes that differ significantly from those in Europe or North America. Indian roads exhibit a greater variety of traffic participants, including unique classes such as autorickshaws and animals. Within-class diversity is higher due to variations in vehicle manufacturing years and wear. The dataset’s distribution of classes, even those overlapping with Cityscapes, differs significantly, underscoring the need for a more diverse and complex dataset.
IDD incorporates extensive variations in ambient conditions, such as lighting, shadows, clouded skies, and particulate matter, further increasing its complexity.
The authors conduct a thorough analysis of the dataset, pointing out challenges observed when applying models trained on existing datasets. They emphasize ambiguous road boundaries, diversity in vehicles and pedestrians, extensive use of information boards, and variations in ambient conditions as distinctive features of unstructured environments.
Dataset acquisition, pre-processing and statistics
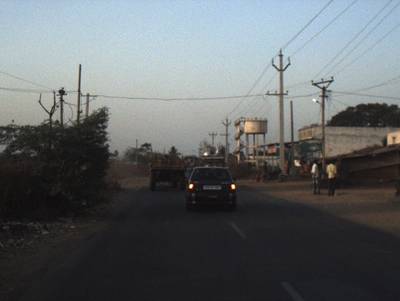
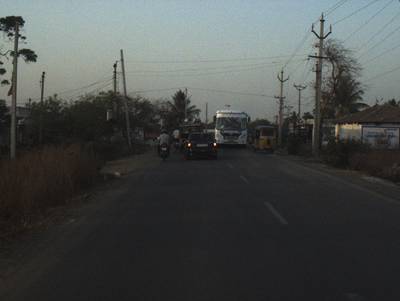
The dataset, acquired from Bangalore and Hyderabad cities in India, comprises 182 drive sequences with a mix of urban and rural areas, highways, single and double-lane roads. The driving conditions are highly unstructured due to the following reasons:
- These cities are experiencing rapid growth, marked by extensive construction near roads.
- Additionally, road boundaries lack clear definition.
- Pedestrians and jaywalkers are abundant in road images.
- A high density of motorbikes and trucks on the roads. Moreover, there is considerable diversity in vehicle models.
Images are selected from forward-facing cameras, densely sampled around crowded and special interest places. The dataset is split into 70% train, 10% validation, and 20% test, with careful consideration for class imbalance.
Comparison of the pixel count in our dataset with Cityscapes. The y axis is plotted in log-scale. Note that for most classes of vehicles, the number of pixels are 5-10 times more than Cityscapes. Moreover our dataset has newer labels like autorickshaw, billboard, drivable/nondrivable fallback which also have significant number of labeled pixels.
Comparisons with other datasets, such as Cityscapes, KITTI, and Mapillary Vistas, highlight the unique characteristics of IDD. The authors present detailed label statistics, pixel counts, and instances of traffic participants, demonstrating the dataset’s distinctions.
Comparison of traffic participants in our dataset with Cityscapes.
In conclusion, IDD stands out as a comprehensive and challenging dataset for unstructured road scene understanding, offering new opportunities for advancing research in autonomous navigation and related domains.
 Homepage
 Research Paper
 GitHub
Summary #
India Driving Dataset (IDD): A Dataset for Exploring Problems of Autonomous Navigation in Unconstrained Environments (Object Detection 47k) is a dataset for instance segmentation, semantic segmentation, and object detection tasks. It is used in the automotive industry.
The dataset consists of 46588 images with 507575 labeled objects belonging to 40 different classes including motorcycle, car, rider, and other: person, truck, autorickshaw, vehicle fallback, bus, traffic sign, bicycle, animal, traffic light, caravan, train, trailer, road, parking, drivable fallback, sidewalk, rail track, non-drivable fallback, curb, wall, fence, guard rail, billboard, pole, polegroup, obs-str-bar-fallback, building, bridge, tunnel, vegetation, sky, fallback background, unlabeled, ego vehicle, rectification border, out of roi, and license plate.
Images in the IDD: Object Detection dataset have pixel-level instance segmentation annotations. Due to the nature of the instance segmentation task, it can be automatically transformed into a semantic segmentation (only one mask for every class) or object detection (bounding boxes for every object) tasks. There are 4794 (10% of the total) unlabeled images (i.e. without annotations). There are 3 splits in the dataset: train (31569 images), val (10225 images), and test (4794 images). Additionally, every image has information about its sequence, while every object instance has its category and 4-level label hierarchy: level1id, level2id, level3id, level4id. Explore them in supervisely labeling tool. The dataset was released in 2018 by the IIIT Hyderabad, India, Intel Bangalore, and University of California, San Diego.
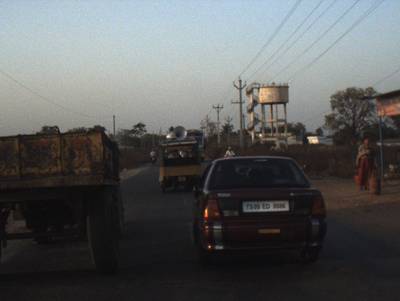
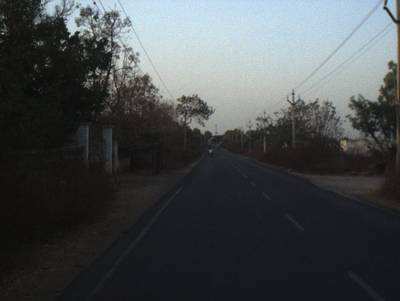
Here is a visualized example for randomly selected sample classes:
Explore #
IDD: Object Detection dataset has 46588 images. Click on one of the examples below or open "Explore" tool anytime you need to view dataset images with annotations. This tool has extended visualization capabilities like zoom, translation, objects table, custom filters and more. Hover the mouse over the images to hide or show annotations.


Class balance #
There are 40 annotation classes in the dataset. Find the general statistics and balances for every class in the table below. Click any row to preview images that have labels of the selected class. Sort by column to find the most rare or prevalent classes.

Class ㅤ | Images ㅤ | Objects ㅤ | Count on image average | Area on image average |
|---|---|---|---|---|
unlabeled➔ rectangle | 46588 | 46588 | 1 | 83.02% |
motorcycle➔ rectangle | 28219 | 103608 | 3.67 | 3.44% |
car➔ rectangle | 25978 | 90519 | 3.48 | 8.65% |
rider➔ rectangle | 25186 | 97626 | 3.88 | 3.14% |
person➔ rectangle | 21716 | 88397 | 4.07 | 1.94% |
truck➔ rectangle | 15652 | 27837 | 1.78 | 10.63% |
autorickshaw➔ rectangle | 14393 | 32280 | 2.24 | 5.47% |
vehicle fallback➔ rectangle | 11310 | 21081 | 1.86 | 1.64% |
bus➔ rectangle | 10758 | 18745 | 1.74 | 16.28% |
traffic sign➔ rectangle | 7937 | 14203 | 1.79 | 0.41% |
Images #
Explore every single image in the dataset with respect to the number of annotations of each class it has. Click a row to preview selected image. Sort by any column to find anomalies and edge cases. Use horizontal scroll if the table has many columns for a large number of classes in the dataset.
Class sizes #
The table below gives various size properties of objects for every class. Click a row to see the image with annotations of the selected class. Sort columns to find classes with the smallest or largest objects or understand the size differences between classes.
Class | Object count | Avg area | Max area | Min area | Min height | Min height | Max height | Max height | Avg height | Avg height | Min width | Min width | Max width | Max width |
|---|---|---|---|---|---|---|---|---|---|---|---|---|---|---|
motorcycle rectangle | 103608 | 1% | 30.14% | 0% | 3px | 0.28% | 1076px | 99.63% | 111px | 10.35% | 3px | 0.16% | 1223px | 63.7% |
rider rectangle | 97626 | 0.94% | 53.19% | 0% | 3px | 0.28% | 1077px | 99.72% | 122px | 11.42% | 2px | 0.1% | 1111px | 57.86% |
car rectangle | 90519 | 2.61% | 93.83% | 0% | 3px | 0.28% | 1079px | 99.91% | 133px | 12.5% | 3px | 0.16% | 1920px | 100% |
person rectangle | 88397 | 0.53% | 46.59% | 0% | 4px | 0.37% | 1077px | 99.72% | 112px | 10.49% | 2px | 0.1% | 1457px | 75.89% |
autorickshaw rectangle | 32280 | 2.5% | 99.86% | 0% | 5px | 0.46% | 1080px | 100% | 151px | 14.17% | 5px | 0.26% | 1919px | 99.95% |
truck rectangle | 27837 | 6.08% | 99.86% | 0% | 5px | 0.46% | 1080px | 100% | 239px | 22.36% | 4px | 0.21% | 1919px | 99.95% |
vehicle fallback rectangle | 21081 | 0.89% | 99.86% | 0% | 3px | 0.28% | 1079px | 99.91% | 80px | 7.54% | 2px | 0.1% | 1920px | 100% |
bus rectangle | 18745 | 9.44% | 99.9% | 0% | 5px | 0.46% | 1080px | 100% | 293px | 27.29% | 6px | 0.31% | 1920px | 100% |
traffic sign rectangle | 14203 | 0.23% | 33.53% | 0% | 4px | 0.37% | 922px | 85.37% | 51px | 4.81% | 3px | 0.16% | 1587px | 82.97% |
animal rectangle | 6224 | 0.34% | 17.81% | 0% | 2px | 0.19% | 639px | 59.17% | 51px | 4.77% | 4px | 0.21% | 651px | 36.64% |
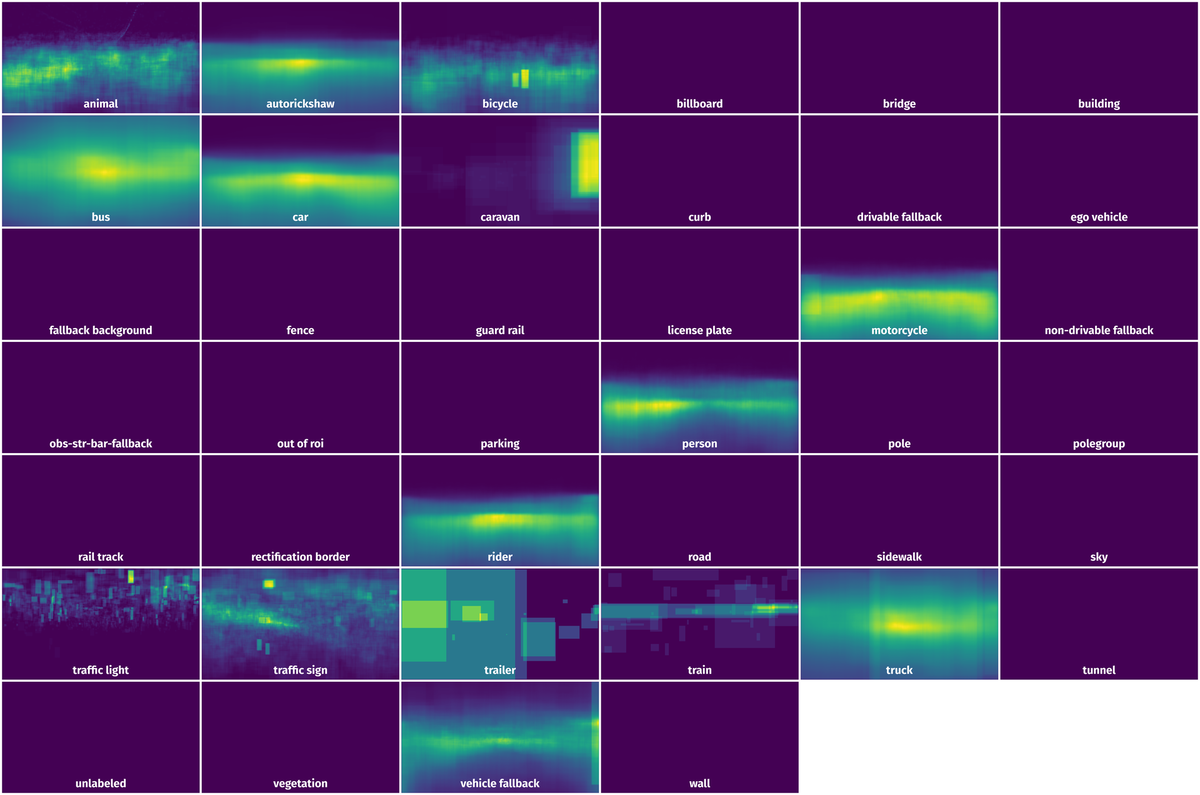
Spatial Heatmap #
The heatmaps below give the spatial distributions of all objects for every class. These visualizations provide insights into the most probable and rare object locations on the image. It helps analyze objects' placements in a dataset.
Objects #
Table contains all 101003 objects. Click a row to preview an image with annotations, and use search or pagination to navigate. Sort columns to find outliers in the dataset.
Object ID ㅤ | Class ㅤ | Image name click row to open | Image size height x width | Height ㅤ | Height ㅤ | Width ㅤ | Width ㅤ | Area ㅤ |
|---|---|---|---|---|---|---|---|---|
1➔ | motorcycle rectangle | BLR-2018-06-29-10-07-38_part_43_0000150.jpg | 1080 x 1920 | 256px | 23.7% | 285px | 14.84% | 3.52% |
2➔ | motorcycle rectangle | BLR-2018-06-29-10-07-38_part_43_0000150.jpg | 1080 x 1920 | 234px | 21.67% | 132px | 6.88% | 1.49% |
3➔ | rider rectangle | BLR-2018-06-29-10-07-38_part_43_0000150.jpg | 1080 x 1920 | 267px | 24.72% | 119px | 6.2% | 1.53% |
4➔ | bus rectangle | BLR-2018-06-29-10-07-38_part_43_0000150.jpg | 1080 x 1920 | 28px | 2.59% | 43px | 2.24% | 0.06% |
5➔ | car rectangle | BLR-2018-06-29-10-07-38_part_43_0000150.jpg | 1080 x 1920 | 27px | 2.5% | 13px | 0.68% | 0.02% |
6➔ | car rectangle | BLR-2018-06-29-10-07-38_part_43_0000150.jpg | 1080 x 1920 | 37px | 3.43% | 36px | 1.88% | 0.06% |
7➔ | car rectangle | BLR-2018-06-29-10-07-38_part_43_0000150.jpg | 1080 x 1920 | 20px | 1.85% | 25px | 1.3% | 0.02% |
8➔ | car rectangle | BLR-2018-06-29-10-07-38_part_43_0000150.jpg | 1080 x 1920 | 162px | 15% | 155px | 8.07% | 1.21% |
9➔ | person rectangle | BLR-2018-06-29-10-07-38_part_43_0000150.jpg | 1080 x 1920 | 94px | 8.7% | 26px | 1.35% | 0.12% |
10➔ | motorcycle rectangle | BLR-2018-06-29-10-07-38_part_43_0000150.jpg | 1080 x 1920 | 199px | 18.43% | 125px | 6.51% | 1.2% |
License #
License is unknown for the India Driving Dataset (IDD): A Dataset for Exploring Problems of Autonomous Navigation in Unconstrained Environments (Object Detection 47k) dataset.
Citation #
If you make use of the IDD: Object Detection data, please cite the following reference:
@dataset{IDD: Object Detection,
  author={Girish Varma and Anbumani Subramanian and Anoop Namboodiri and Manmohan Chandraker and C. V. Jawahar},
  title={India Driving Dataset (IDD): A Dataset for Exploring Problems of Autonomous Navigation in Unconstrained Environments (Object Detection 47k)},
  year={2018},
  url={http://idd.insaan.iiit.ac.in/}
}
If you are happy with Dataset Ninja and use provided visualizations and tools in your work, please cite us:
@misc{ visualization-tools-for-idd-detection-dataset,
  title = { Visualization Tools for IDD: Object Detection Dataset },
  type = { Computer Vision Tools },
  author = { Dataset Ninja },
  howpublished = { \url{ https://datasetninja.com/idd-detection } },
  url = { https://datasetninja.com/idd-detection },
  journal = { Dataset Ninja },
  publisher = { Dataset Ninja },
  year = { 2026 },
  month = { jul },
  note = { visited on 2026-07-16 },
}
Download #
Please visit dataset homepage to download the data.
Disclaimer #
Our gal from the legal dep told us we need to post this:
Dataset Ninja provides visualizations and statistics for some datasets that can be found online and can be downloaded by general audience. Dataset Ninja is not a dataset hosting platform and can only be used for informational purposes. The platform does not claim any rights for the original content, including images, videos, annotations and descriptions. Joint publishing is prohibited.
You take full responsibility when you use datasets presented at Dataset Ninja, as well as other information, including visualizations and statistics we provide. You are in charge of compliance with any dataset license and all other permissions. You are required to navigate datasets homepage and make sure that you can use it. In case of any questions, get in touch with us at hello@datasetninja.com.