Introduction #
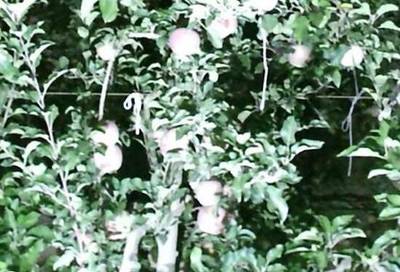
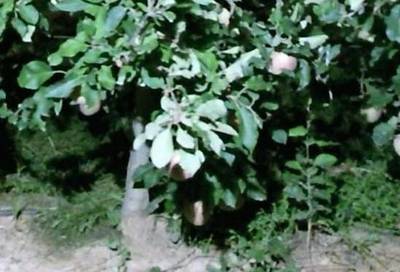
The authors of the KFuji RGB-DS Database: Fuji Apple Multi-Modal Images for Fruit Detection with Color, Depth and Range-Corrected IR Data introduce 967 multi-modal images capturing Fuji apples on trees using Microsoft Kinect v2. Each image incorporates information from three distinct modalities: color (RGB), depth (D), and range-corrected (IR) infrared intensity (S). The dataset includes manually annotated ground truth fruit locations, totaling 12,839 apples across all images.
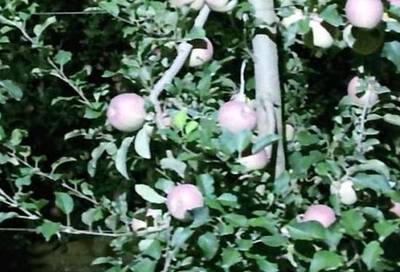
The images, sized at 548 x 373 pixels, are saved in three different modalities:
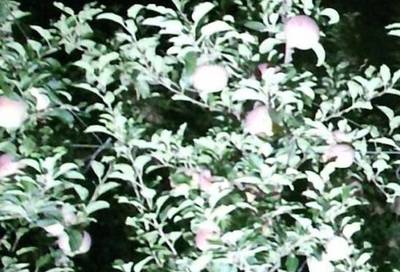
- RGBhr (High-Resolution Color Image): Raw color images saved in 8-bit JPG files (original_images).
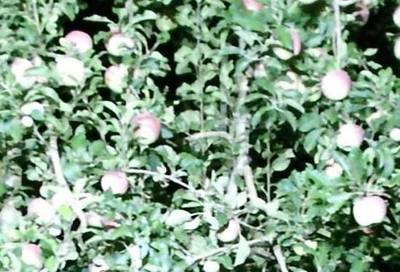
- RGBp (Projected Color Image): Projection of the color 3D point cloud onto the camera focal plane. Both RGBp and D-S modalities undergo the same procedure, enabling a comparison for fruit detection. (cropped-).
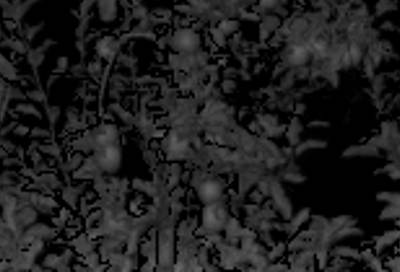
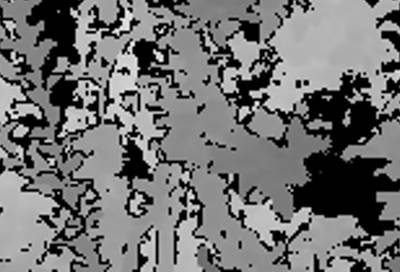
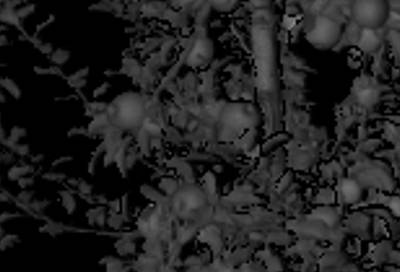
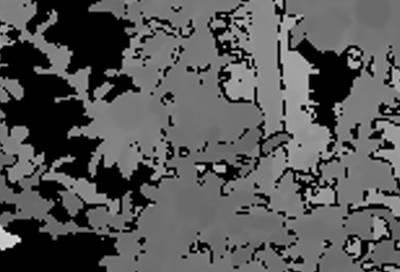
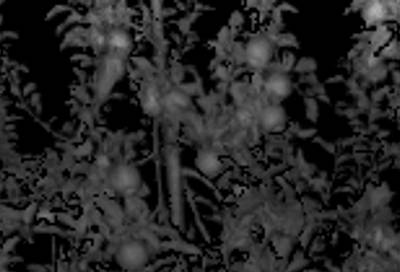
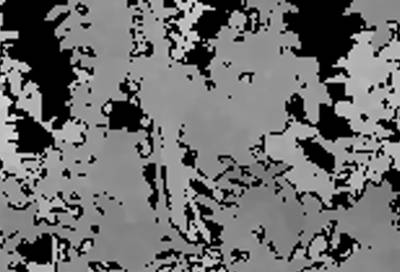
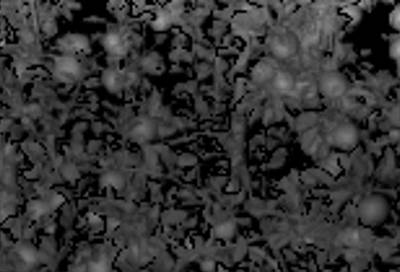
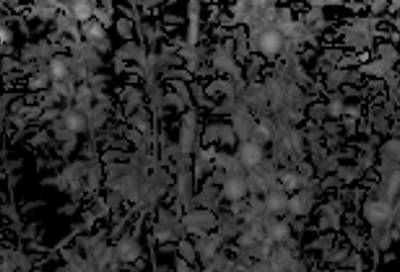
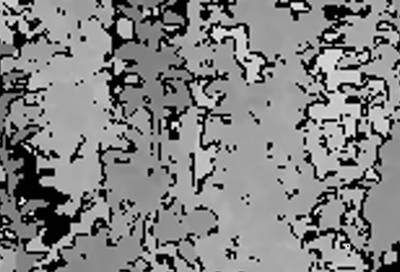
- DS (Depth and Range-Corrected IR Image): Projection of the range-corrected IR 3D point cloud onto the camera focal plane. The D channel corresponds to depth values, while the S channel corresponds to range-corrected IR intensity values. (cropped-).
Selection of 3 multi-modal images and the corresponding ground truth fruit locations (red bounding boxes). Each image column corresponds to a different image modality: RGB, S and D, respectively.
The S and D data undergo normalization between 0 and 255, similar to RGB images, to achieve comparable mean and variance between channels, facilitating faster learning convergence for machine learning algorithms, including deep convolutional neural networks.
Data Annotation
All images are manually annotated with rectangular bounding boxes, identifying a total of 12,839 apples across the dataset. The data acquisition occurred in a commercial Fuji apple orchard, utilizing two Microsoft Kinect v2 RGB-D sensors. The acquisition took place three weeks before harvesting, ensuring apples were at the 85 BBCH growth stage. Due to the depth sensor’s sensitivity to direct sunlight, data acquisition occurred at night with artificial lighting.
Data Processing
Data preprocessing involved various steps, including range correction of IR intensity data, projection of 3D point clouds onto the camera focal plane, geometric wrapping, registration with high-resolution RGB images, and image splitting to reduce the number of fruits per image.
Data preparation outline.
The above figure provides a visual representation of the data preparation steps, emphasizing the significance of overcoming IR signal attenuation and ensuring pixel-wise correspondence between different image modalities.
Summary #
KFuji RGB-DS Database: Fuji Apple Multi-Modal Images for Fruit Detection with Color, Depth and Range-Corrected IR Data is a dataset for object detection and monocular depth estimation tasks. It is used in the agricultural industry.
The dataset consists of 3011 images with 41505 labeled objects belonging to 1 single class (apple).
Images in the KFuji RGB-DS dataset have bounding box annotations. There are 110 (4% of the total) unlabeled images (i.e. without annotations). There are 4 splits in the dataset: cropped-train (1857 images), cropped-test (579 images), cropped-val (465 images), and original_images (110 images). Additionally, every channel of the image is grouped by its im_id. Explore image groups in supervisely. The dataset was released in 2020 by the Universitat de Lleida, Spain and Universitat Politècnica de Catalunya, Spain.

Explore #
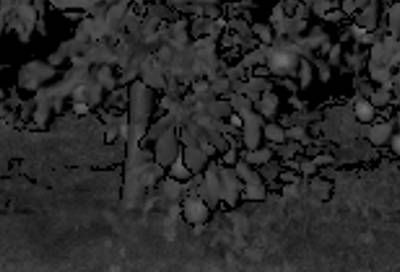
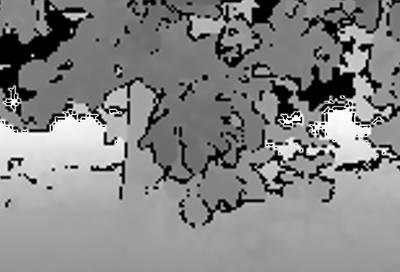
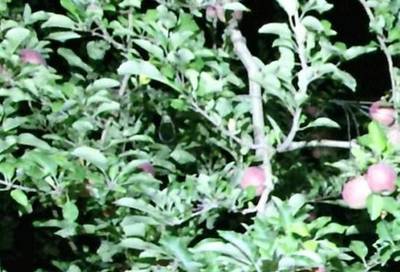
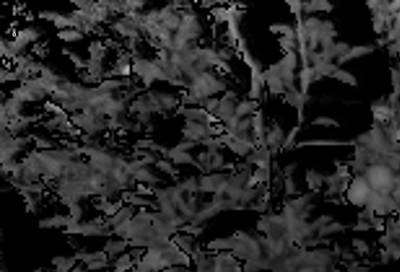
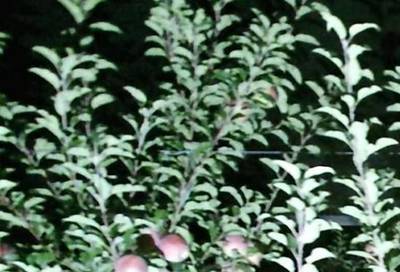
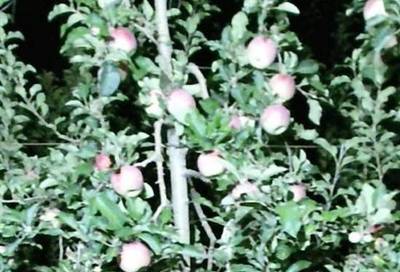
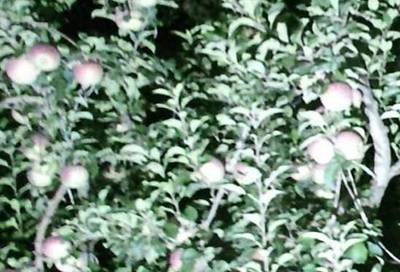
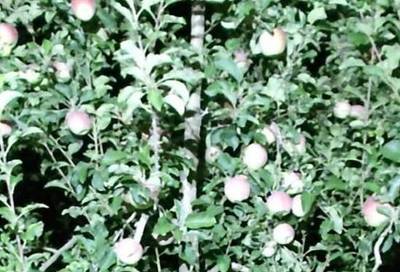
KFuji RGB-DS dataset has 3011 images. Click on one of the examples below or open "Explore" tool anytime you need to view dataset images with annotations. This tool has extended visualization capabilities like zoom, translation, objects table, custom filters and more. Hover the mouse over the images to hide or show annotations.






























Class balance #
There are 1 annotation classes in the dataset. Find the general statistics and balances for every class in the table below. Click any row to preview images that have labels of the selected class. Sort by column to find the most rare or prevalent classes.
Class ㅤ | Images ㅤ | Objects ㅤ | Count on image average | Area on image average |
|---|---|---|---|---|
apple➔ rectangle | 2901 | 41505 | 14.31 | 13.3% |
Images #
Explore every single image in the dataset with respect to the number of annotations of each class it has. Click a row to preview selected image. Sort by any column to find anomalies and edge cases. Use horizontal scroll if the table has many columns for a large number of classes in the dataset.
Object distribution #
Interactive heatmap chart for every class with object distribution shows how many images are in the dataset with a certain number of objects of a specific class. Users can click cell and see the list of all corresponding images.
Class sizes #
The table below gives various size properties of objects for every class. Click a row to see the image with annotations of the selected class. Sort columns to find classes with the smallest or largest objects or understand the size differences between classes.
Class | Object count | Avg area | Max area | Min area | Min height | Min height | Max height | Max height | Avg height | Avg height | Min width | Min width | Max width | Max width |
|---|---|---|---|---|---|---|---|---|---|---|---|---|---|---|
apple rectangle | 41505 | 0.97% | 2.83% | 0.16% | 14px | 3.75% | 76px | 20.38% | 44px | 11.73% | 14px | 2.55% | 76px | 13.87% |
Spatial Heatmap #
The heatmaps below give the spatial distributions of all objects for every class. These visualizations provide insights into the most probable and rare object locations on the image. It helps analyze objects' placements in a dataset.

Objects #
Table contains all 41505 objects. Click a row to preview an image with annotations, and use search or pagination to navigate. Sort columns to find outliers in the dataset.
Object ID ㅤ | Class ㅤ | Image name click row to open | Image size height x width | Height ㅤ | Height ㅤ | Width ㅤ | Width ㅤ | Area ㅤ |
|---|---|---|---|---|---|---|---|---|
1➔ | apple rectangle | BD12_inf_201711_047_06_ir.png | 373 x 548 | 50px | 13.4% | 51px | 9.31% | 1.25% |
2➔ | apple rectangle | BD12_inf_201711_047_06_ir.png | 373 x 548 | 61px | 16.35% | 61px | 11.13% | 1.82% |
3➔ | apple rectangle | BD12_inf_201711_047_06_ir.png | 373 x 548 | 55px | 14.75% | 54px | 9.85% | 1.45% |
4➔ | apple rectangle | BD12_inf_201711_047_06_ir.png | 373 x 548 | 52px | 13.94% | 52px | 9.49% | 1.32% |
5➔ | apple rectangle | BD12_inf_201711_047_06_ir.png | 373 x 548 | 53px | 14.21% | 53px | 9.67% | 1.37% |
6➔ | apple rectangle | BD12_inf_201711_047_06_ir.png | 373 x 548 | 44px | 11.8% | 44px | 8.03% | 0.95% |
7➔ | apple rectangle | BD12_inf_201711_047_06_ir.png | 373 x 548 | 40px | 10.72% | 41px | 7.48% | 0.8% |
8➔ | apple rectangle | BD12_inf_201711_047_06_ir.png | 373 x 548 | 46px | 12.33% | 46px | 8.39% | 1.04% |
9➔ | apple rectangle | BD12_inf_201711_047_06_ir.png | 373 x 548 | 47px | 12.6% | 47px | 8.58% | 1.08% |
10➔ | apple rectangle | BD12_inf_201711_047_06_ir.png | 373 x 548 | 57px | 15.28% | 57px | 10.4% | 1.59% |
License #
KFuji RGB-DS Database: Fuji Apple Multi-Modal Images for Fruit Detection with Color, Depth and Range-Corrected IR Data is under CC BY-NC-SA 4.0 license.
This database is available only for research and educational purpose and not for any commercial use. If you use the database in any publications or reports, you must refer to the following papers:
-
Gené-Mola J, Vilaplana V, Rosell-Polo JR, Morros JR, Ruiz-Hidalgo J, Gregorio E. 2019. Multi-modal Deep Learning for Fruit Detection Using RGB-D Cameras and their Radiometric Capabilities. Computers and Electronics in Agriculture, 162, 689-698. DOI: 10.1016/j.compag.2019.05.016
-
Gené-Mola J, Vilaplana V, Rosell-Polo JR, Morros JR, Ruiz-Hidalgo J, Gregorio E. 2019. KFuji RGB-DS database: Fuji apple multi-modal images for fruit detection with color, depth and range-corrected IR data. Data in brief, 25 (2019), 104289. DOI: 10.1016/j.dib.2019.104289
Citation #
If you make use of the KFuji RGB-DS data, please cite the following reference:
@dataset{jordi_gene_mola_2020_3715991,
  author       = {Jordi Gené-Mola and Verónica Vilaplana and Joan R. Rosell-Polo and Josep-Ramon Morros and Javier Ruiz-Hidalgo and Eduard Gregorio},
  title        = {KFuji RGB-DS dataset},
  month        = may,
  year         = 2020,
  note         = {{This work was partly funded by the Secretaria d'Universitats i Recerca del Departament d'Empresa i Coneixement de la Generalitat de Catalunya, the Spanish Ministry of Economy and  and the European Regional Development Fund (ERDF) under Grants 2017 SGR 646, AGL2013-48297-C2-2-R and MALEGRA, TEC2016-75976-R. The Spanish Ministry of Education is thanked for Mr. J. Gené's pre-doctoral fellowships (FPU15/03355). We would also like to thank Nufri and Vicens Maquinaria Agrícola S.A. for their support during data acquisition.}},
  publisher    = {Zenodo},
  doi          = {10.5281/zenodo.3715991},
  url          = {https://doi.org/10.5281/zenodo.3715991}
}
If you are happy with Dataset Ninja and use provided visualizations and tools in your work, please cite us:
@misc{ visualization-tools-for-kfuji-dataset,
  title = { Visualization Tools for KFuji RGB-DS Dataset },
  type = { Computer Vision Tools },
  author = { Dataset Ninja },
  howpublished = { \url{ https://datasetninja.com/kfuji } },
  url = { https://datasetninja.com/kfuji },
  journal = { Dataset Ninja },
  publisher = { Dataset Ninja },
  year = { 2026 },
  month = { jan },
  note = { visited on 2026-01-26 },
}
Download #
Dataset KFuji RGB-DS can be downloaded in Supervisely format:
As an alternative, it can be downloaded with dataset-tools package:
pip install --upgrade dataset-tools
… using following python code:
import dataset_tools as dtools

dtools.download(dataset='KFuji RGB-DS', dst_dir='~/dataset-ninja/')
Make sure not to overlook the python code example available on the Supervisely Developer Portal. It will give you a clear idea of how to effortlessly work with the downloaded dataset.
The data in original format can be downloaded here:
Disclaimer #
Our gal from the legal dep told us we need to post this:
Dataset Ninja provides visualizations and statistics for some datasets that can be found online and can be downloaded by general audience. Dataset Ninja is not a dataset hosting platform and can only be used for informational purposes. The platform does not claim any rights for the original content, including images, videos, annotations and descriptions. Joint publishing is prohibited.
You take full responsibility when you use datasets presented at Dataset Ninja, as well as other information, including visualizations and statistics we provide. You are in charge of compliance with any dataset license and all other permissions. You are required to navigate datasets homepage and make sure that you can use it. In case of any questions, get in touch with us at hello@datasetninja.com.


