

Introduction #
The authors present a KITTI Object Detection dataset (is a part of a larger KITTI dataset) obtained from a VW station wagon for application in mobile robotics and autonomous driving research. They meticulously recorded 6 hours of traffic scenarios at 10–100 Hz, utilizing a range of sensor modalities, including high-resolution color and grayscale stereo cameras, a Velodyne 3D laser scanner, and a high-precision GPS/IMU inertial navigation system. The dataset encompasses diverse scenarios, capturing real-world traffic situations across freeways, rural areas, and inner-city scenes with numerous static and dynamic objects. The data is calibrated, synchronized, timestamped, and provided in rectified and raw image sequences. Additionally, the dataset contains object labels in the form of 3D tracklets, and the authors offer online benchmarks for stereo, optical flow, object detection, and other tasks. The paper details the recording platform, data format, and utilities provided by the authors.
Recording platform. The VW Passat station wagon is equipped with four video cameras (two color and two grayscale cameras), a rotating 3D laser scanner and a combined GPS/IMU inertial navigation system.
The KITTI dataset, recorded from a moving platform around Karlsruhe, Germany, includes camera images, laser scans, high-precision GPS measurements, and IMU accelerations. Its primary objective is to advance the development of computer vision and robotic algorithms for autonomous driving.
The dataset includes specifications for cameras, lenses, laser scanner, and inertial and GPS navigation system. Notably, the color cameras exhibit limitations in resolution due to the Bayer pattern interpolation process and reduced sensitivity to light. Two stereo camera rigs are employed, one for grayscale and one for color, each with a baseline of approximately 54 cm.
Sensor setup. This figure illustrates the dimensions and mounting positions of the sensors (red) with respect to the vehicle body. Heights above ground are marked in green and measured with respect to the road surface. Transformations between sensors are shown in blue.
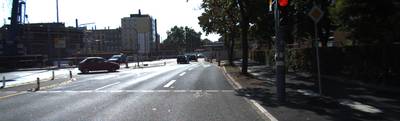
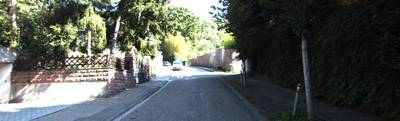
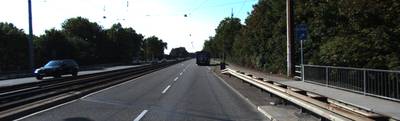
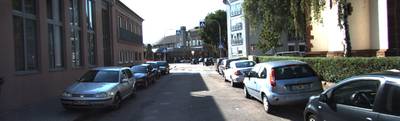
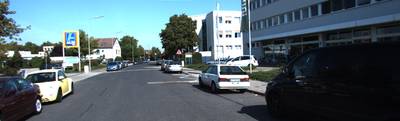
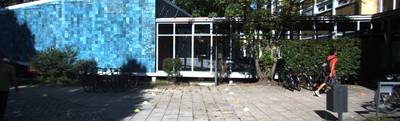
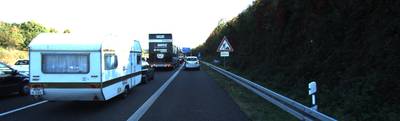
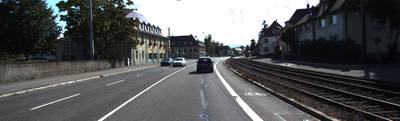
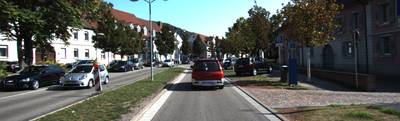
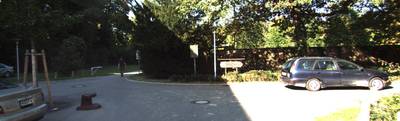
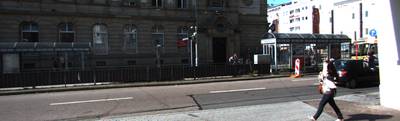
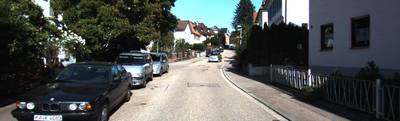
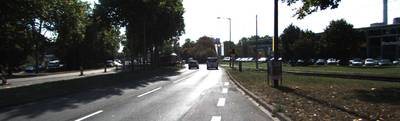
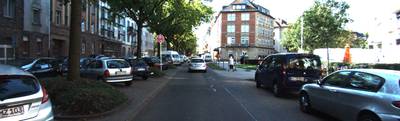
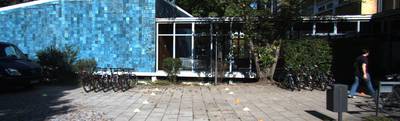
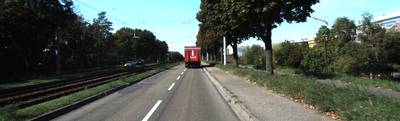
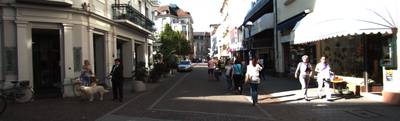
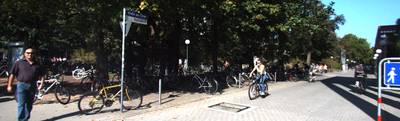
The raw data constitutes approximately 25% of the overall recordings. The dataset includes sequences categorized as ‘Road,’ ‘City,’ ‘Residential,’ ‘Campus,’ and ‘Person.’ Each sequence is accompanied by raw data, object annotations in the form of 3D bounding box tracklets, and a calibration file. Example frames are illustrated, and recordings occurred on specific dates in September and October 2011 during daytime, resulting in a dataset size of 180 GB.
Object coordinates. This figure illustrates the coordinate system of the annotated 3D bounding boxes with respect to the coordinate system of the 3D Velodyne laser scanner. In z-direction, the object coordinate system is located at the bottom of the object (contact point with the supporting surface).
Annotations for dynamic objects within the reference camera’s field of view are provided in the form of 3D bounding box tracklets, represented in Velodyne coordinates. Object classes include car, van, truck, pedestrian, and others. Each object is assigned a class and its 3D dimensions (height, width, length), along with translation and rotation y information in 3D for each frame. The development kit contains C++/MATLAB code for reading and writing tracklets.
To offer further insights into the dataset’s properties, statistics for sequences with annotated objects are provided. Figures show the total number of objects, object orientations, object labels per image, sequence length, and egomotion of the platform recorded by the GPS/IMU system. Statistics are presented for the whole dataset and per street category.
Number of object labels per class and image. This figure shows how often an object occurs in an image.
 Homepage
 Research Paper
Summary #
KITTI Object Detection is a dataset for an object detection task. It is used in the automotive industry.
The dataset consists of 14999 images with 51865 labeled objects belonging to 9 different classes including car, dont care, van, and other: pedestrian, cyclist, truck, misc, tram, and person sitting.
Images in the KITTI Object Detection dataset have bounding box annotations. There are 7518 (50% of the total) unlabeled images (i.e. without annotations). There are 2 splits in the dataset: test (7518 images) and train (7481 images). The dataset was released in 2012 by the Karlsruhe Institute of Technology, Germany, Max Planck Institute for Intelligent Systems, Germany, and Toyota Technological Institute at Chicago, USA.
Here are the visualized examples for the classes:
Explore #
KITTI Object Detection dataset has 14999 images. Click on one of the examples below or open "Explore" tool anytime you need to view dataset images with annotations. This tool has extended visualization capabilities like zoom, translation, objects table, custom filters and more. Hover the mouse over the images to hide or show annotations.


Class balance #
There are 9 annotation classes in the dataset. Find the general statistics and balances for every class in the table below. Click any row to preview images that have labels of the selected class. Sort by column to find the most rare or prevalent classes.

Class ㅤ | Images ㅤ | Objects ㅤ | Count on image average | Area on image average |
|---|---|---|---|---|
car➔ rectangle | 6684 | 28742 | 4.3 | 8.93% |
dont care➔ rectangle | 5365 | 11295 | 2.11 | 0.89% |
van➔ rectangle | 2145 | 2914 | 1.36 | 4.56% |
pedestrian➔ rectangle | 1779 | 4487 | 2.52 | 3.05% |
cyclist➔ rectangle | 1141 | 1627 | 1.43 | 2% |
truck➔ rectangle | 1036 | 1094 | 1.06 | 3.47% |
misc➔ rectangle | 778 | 973 | 1.25 | 2.88% |
tram➔ rectangle | 349 | 511 | 1.46 | 7.22% |
person sitting➔ rectangle | 99 | 222 | 2.24 | 3.73% |
Co-occurrence matrix #
Co-occurrence matrix is an extremely valuable tool that shows you the images for every pair of classes: how many images have objects of both classes at the same time. If you click any cell, you will see those images. We added the tooltip with an explanation for every cell for your convenience, just hover the mouse over a cell to preview the description.
Images #
Explore every single image in the dataset with respect to the number of annotations of each class it has. Click a row to preview selected image. Sort by any column to find anomalies and edge cases. Use horizontal scroll if the table has many columns for a large number of classes in the dataset.
Object distribution #
Interactive heatmap chart for every class with object distribution shows how many images are in the dataset with a certain number of objects of a specific class. Users can click cell and see the list of all corresponding images.
Class sizes #
The table below gives various size properties of objects for every class. Click a row to see the image with annotations of the selected class. Sort columns to find classes with the smallest or largest objects or understand the size differences between classes.
Class | Object count | Avg area | Max area | Min area | Min height | Min height | Max height | Max height | Avg height | Avg height | Min width | Min width | Max width | Max width |
|---|---|---|---|---|---|---|---|---|---|---|---|---|---|---|
car rectangle | 28742 | 2.46% | 28.14% | 0.01% | 13px | 3.47% | 336px | 89.6% | 67px | 17.9% | 1px | 0.08% | 582px | 46.86% |
dont care rectangle | 11295 | 0.42% | 29.79% | 0% | 3px | 0.8% | 375px | 99.73% | 27px | 7.12% | 4px | 0.32% | 710px | 57.17% |
pedestrian rectangle | 4487 | 1.39% | 20.27% | 0% | 15px | 4.05% | 295px | 78.88% | 105px | 28.12% | 1px | 0.08% | 360px | 29.41% |
van rectangle | 2914 | 3.39% | 40.1% | 0.06% | 18px | 4.8% | 376px | 100% | 85px | 22.57% | 4px | 0.32% | 538px | 43.32% |
cyclist rectangle | 1627 | 1.47% | 17.22% | 0.03% | 17px | 4.53% | 296px | 78.93% | 78px | 20.83% | 7px | 0.56% | 371px | 30.31% |
truck rectangle | 1094 | 3.29% | 41.14% | 0.16% | 28px | 7.47% | 376px | 100% | 87px | 23.31% | 3px | 0.24% | 511px | 41.14% |
misc rectangle | 973 | 2.38% | 36.66% | 0.07% | 14px | 3.73% | 376px | 100% | 75px | 20.12% | 6px | 0.48% | 455px | 36.66% |
tram rectangle | 511 | 5.44% | 40.7% | 0.12% | 22px | 5.87% | 375px | 100% | 105px | 28.07% | 25px | 2.01% | 538px | 43.46% |
person sitting rectangle | 222 | 2.14% | 9.26% | 0.14% | 32px | 8.53% | 228px | 60.96% | 103px | 27.6% | 5px | 0.4% | 231px | 18.66% |
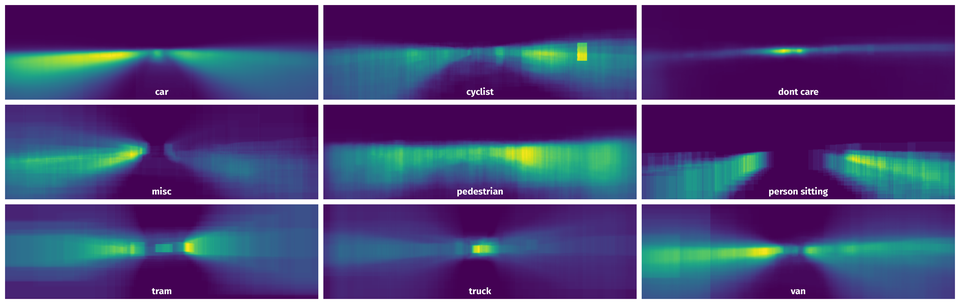
Spatial Heatmap #
The heatmaps below give the spatial distributions of all objects for every class. These visualizations provide insights into the most probable and rare object locations on the image. It helps analyze objects' placements in a dataset.
Objects #
Table contains all 51865 objects. Click a row to preview an image with annotations, and use search or pagination to navigate. Sort columns to find outliers in the dataset.
Object ID ㅤ | Class ㅤ | Image name click row to open | Image size height x width | Height ㅤ | Height ㅤ | Width ㅤ | Width ㅤ | Area ㅤ |
|---|---|---|---|---|---|---|---|---|
1➔ | pedestrian rectangle | 002287.png | 370 x 1224 | 142px | 38.38% | 78px | 6.37% | 2.45% |
2➔ | car rectangle | 002592.png | 374 x 1238 | 167px | 44.65% | 268px | 21.65% | 9.67% |
3➔ | car rectangle | 002592.png | 374 x 1238 | 79px | 21.12% | 87px | 7.03% | 1.48% |
4➔ | car rectangle | 002592.png | 374 x 1238 | 56px | 14.97% | 68px | 5.49% | 0.82% |
5➔ | car rectangle | 002592.png | 374 x 1238 | 43px | 11.5% | 42px | 3.39% | 0.39% |
6➔ | car rectangle | 002592.png | 374 x 1238 | 143px | 38.24% | 219px | 17.69% | 6.76% |
7➔ | car rectangle | 002592.png | 374 x 1238 | 32px | 8.56% | 52px | 4.2% | 0.36% |
8➔ | car rectangle | 002592.png | 374 x 1238 | 35px | 9.36% | 42px | 3.39% | 0.32% |
9➔ | car rectangle | 000136.png | 375 x 1242 | 165px | 44% | 372px | 29.95% | 13.18% |
10➔ | car rectangle | 000136.png | 375 x 1242 | 40px | 10.67% | 55px | 4.43% | 0.47% |
License #
KITTI Object Detection is under CC BY-NC-SA 3.0 license.
Citation #
If you make use of the KITTI Object Detection data, please cite the following reference:
@INPROCEEDINGS{Geiger2012CVPR,
  author = {Andreas Geiger and Philip Lenz and Raquel Urtasun},
  title = {Are we ready for Autonomous Driving? The KITTI Vision Benchmark Suite},
  booktitle = {Conference on Computer Vision and Pattern Recognition (CVPR)},
  year = {2012}
}
If you are happy with Dataset Ninja and use provided visualizations and tools in your work, please cite us:
@misc{ visualization-tools-for-kitti-object-detection-dataset,
  title = { Visualization Tools for KITTI Object Detection Dataset },
  type = { Computer Vision Tools },
  author = { Dataset Ninja },
  howpublished = { \url{ https://datasetninja.com/kitti-object-detection } },
  url = { https://datasetninja.com/kitti-object-detection },
  journal = { Dataset Ninja },
  publisher = { Dataset Ninja },
  year = { 2026 },
  month = { jul },
  note = { visited on 2026-07-18 },
}
Download #
Dataset KITTI Object Detection can be downloaded in Supervisely format:
As an alternative, it can be downloaded with dataset-tools package:
pip install --upgrade dataset-tools
… using following python code:
import dataset_tools as dtools

dtools.download(dataset='KITTI Object Detection', dst_dir='~/dataset-ninja/')
Make sure not to overlook the python code example available on the Supervisely Developer Portal. It will give you a clear idea of how to effortlessly work with the downloaded dataset.
The data in original format can be downloaded here.
Disclaimer #
Our gal from the legal dep told us we need to post this:
Dataset Ninja provides visualizations and statistics for some datasets that can be found online and can be downloaded by general audience. Dataset Ninja is not a dataset hosting platform and can only be used for informational purposes. The platform does not claim any rights for the original content, including images, videos, annotations and descriptions. Joint publishing is prohibited.
You take full responsibility when you use datasets presented at Dataset Ninja, as well as other information, including visualizations and statistics we provide. You are in charge of compliance with any dataset license and all other permissions. You are required to navigate datasets homepage and make sure that you can use it. In case of any questions, get in touch with us at hello@datasetninja.com.