

Introduction #
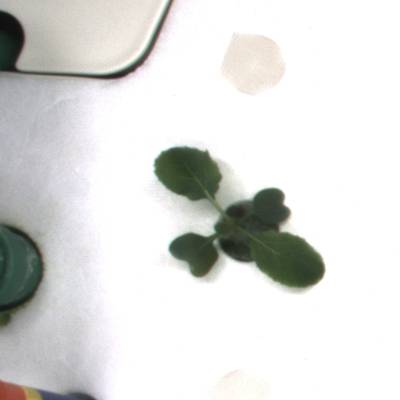
The authors of the KOMATSUNA dataset present a 3D phenotyping platform designed to measure both plant growth and environmental information within small indoor environments, specifically tailored for plant image datasets. The primary objective is to create a comprehensive and compact platform using readily available commercial devices, enabling researchers to initiate plant phenotyping in their laboratories. The dataset includes rgb-d and multi-view images depicting the early growth stages of Komatsuna, complete with leaf annotations.
Motivation
Plant growth is influenced by various factors, including plant seeds, temperature, CO2, solar radiation, soil, and fertilizers. The appearance characteristics of a plant, known as its phenotype, result from the interplay between genetic properties and environmental conditions. Understanding this complex relationship is crucial for enhancing the quality and quantity of plant cultivation.
The authors meticulously selected the Komatsuna plant species for its growth properties, resilience to insects, and rapid growth in indoor environments. Hydroponic culture, chosen for its cleanliness and automation advantages, was adopted over traditional soil culture. The authors selected a hydroponic culture toolkit designed for small kitchen gardens, facilitating constant cultivation without daily maintenance.
Platform to create KOMATSUNA datasets in indoor environments. To cultivate plants, a compact and complete platform for 3D plant phenotyping was developed using commercial devices only.
Lighting, Sensors and Cameras
Controlling lighting conditions is essential for indoor plant growth. The authors employed controllable switches for power sources, enabling programmable lighting durations. They utilized three types of lights—incandescent, fluorescent, and LED lights—opting for LED lights due to their controllability and spectrum composition. The Philips hue with programmable features was chosen, and its arrangement around the hydroponic culture toolkit was carefully considered.
To measure temperature, humidity, and light intensity, the authors utilized a Sony MESH device. This compact and cost-effective IoT device constantly measured and transferred data to a smartphone through Bluetooth. Lux was used as a simplified index for light intensity, although photosynthetic photon flux density (PPFD) is considered more appropriate for biological studies.
Two imaging systems were developed using an RGB-D camera (Intel RealSense SR300) and multiple high-resolution RGB cameras (FLIR cameras with Kowa lenses). The RGB-D camera was optimized for short-range capture, while the multiple RGB cameras addressed the low resolution of depth images, ensuring clear capture of plant shapes.
Data Annotation
The manual annotation tool developed by the authors facilitates the creation of ground-truth labels for leaves in plant images on a pixel-by-pixel basis. This tool was designed to streamline the time-consuming task of annotation, incorporating various functions for efficient label creation.
Annotation process:
-
Color Segmentation: An initial mask for leaves was generated using thresholding-based binarization for each color channel, allowing for easy adjustment of threshold values. Users could adjust values by checking the generated mask superimposed onto the input image.
-
Manual Segmentation: To separate connected or overlapped leaves, a manual segmentation tool was implemented. Users could draw a freehand splitting curved line to divide one region into two with new leaf labels.
-
Erasing: An eraser tool was implemented to remove false positive regions in the initial mask, providing quick and easy removal of any size of the false positive region.
-
Label Assignment: Each closed region in the mask was assigned one leaf label of a unique color. The label color was predefined and loaded into the tool. Users could fill a region with a colored label by selecting a label and clicking a pixel in the region. Additionally, a region label could be modified by clicking a pixel with another label.
Dataset Creation
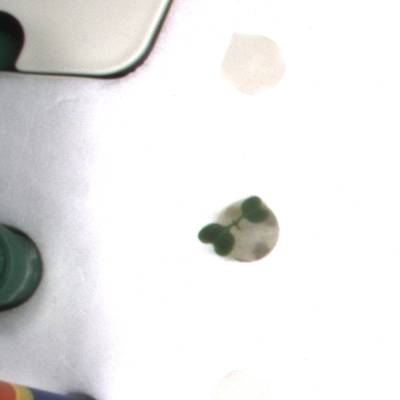
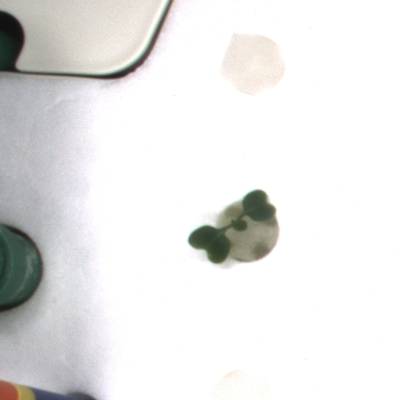
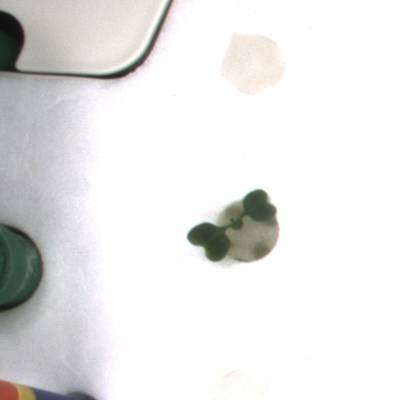
The authors generated two distinct datasets utilizing both an RGB-D camera and multiple RGB cameras publicly available on the web. Common and consistent environmental conditions were maintained across both datasets, with lighting, temperature, and humidity set at approximately 2400 lux, 28°C, and 30%, respectively. To expedite the growth of Komatsuna, lighting was provided continuously for 24 hours. In each dataset, images of five plants were captured every 4 hours over 10 days. This allowed for the measurement of leaf shape and size changes in 3D space over both short and long terms.
In the RGB-D dataset, an RGB-D camera captured the entire hydroponic culture toolkit. Each plant region was manually segmented, forming individual plant images labeled in a label image. To facilitate temporal leaf tracking, consistent leaf labels were assigned to corresponding leaves in images captured at different times. The original camera resolution was 640 × 480, with plant images typically at 166 × 190 pixels. The alignment between RGB and depth images was crucial, considering the physical differences in viewpoints. To address this, a depth image was aligned into an RGB image, and the original depth image and transformation matrix were provided for further adjustments without interpolations.
The image name nomenclature and other file-specific descriptions can be found in the original rgbd_README
The RGB-D camera’s advantage lies in its ability to measure object shape even when lights are off, thanks to the emission of infrared lights. This facilitates the tracking of leaf movement for 24 hours, offering insights into the relationship between leaf shape and light source positions. Calibration of cameras and distances between them was achieved using a standard technique for 3D reconstruction.
In the Multiview Dataset, images of five plants were captured from three viewpoints and manually segmented into individual plant images. Similar to the RGB-D dataset, consistent leaf labels were assigned for spatial-temporal leaf tracking across different cameras and times. Unlike the RGB-D dataset, the ground truth for 3D shape was not measured due to the challenge of capturing more accurate 3D shapes than high-resolution multiple-view images. Future research may explore solutions, potentially involving RGB-D sensors. This dataset proves valuable for evaluating spatial-temporal instance segmentation across multiple views, addressing a gap where instance segmentation has traditionally been performed using single-view images. The authors suggest combining instance segmentation and stereo-matching as a potential avenue for solving this challenge.
The image name nomenclature and other file-specific descriptions can be found in the original multi_README
 Homepage
 Research PaperRGBD ReadmeMulti-View Readme
Summary #
KOMATSUNA Dataset for Instance Segmentation, Tracking and Reconstruction is a dataset for instance segmentation, semantic segmentation, object detection, and monocular depth estimation tasks. It is used in the biological research.
The dataset consists of 1560 images with 6184 labeled objects belonging to 1 single class (leaf).
Images in the KOMATSUNA dataset have pixel-level instance segmentation annotations. Due to the nature of the instance segmentation task, it can be automatically transformed into a semantic segmentation (only one mask for every class) or object detection (bounding boxes for every object) tasks. There are 360 (23% of the total) unlabeled images (i.e. without annotations). There are 2 splits in the dataset: multi-view (1080 images) and rgb-d (480 images). Alternatively, the dataset could be split into 6 image splits: multi_plant (900 images), rgbd_plant (300 images), multi_original (180 images), rgbd_depth (60 images), rgbd_depth_ours (60 images), and rgbd_original (60 images). Additionally, images are grouped by im_id, and every leaf has old tag. Explore it in supervisely labeling tool. The dataset was released in 2017 by the Kyushu University, Japan.
Explore #
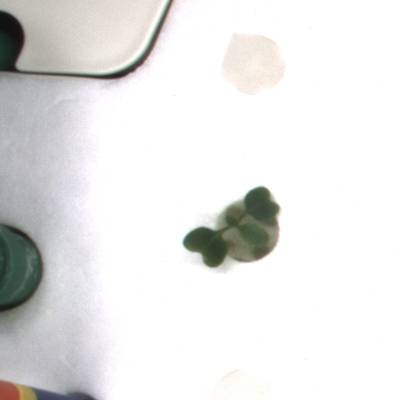
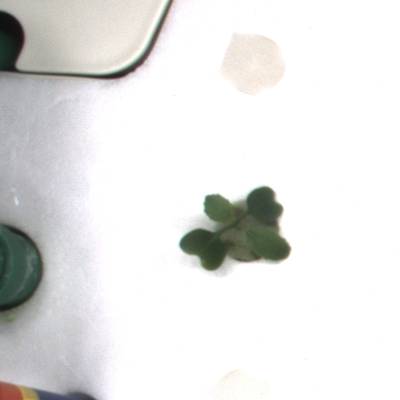
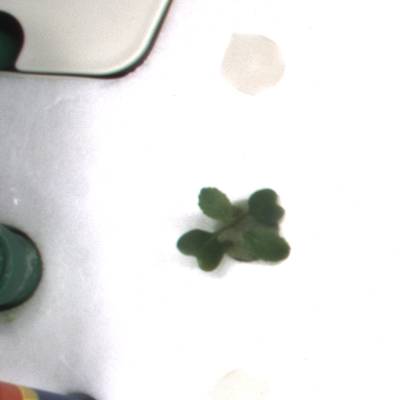
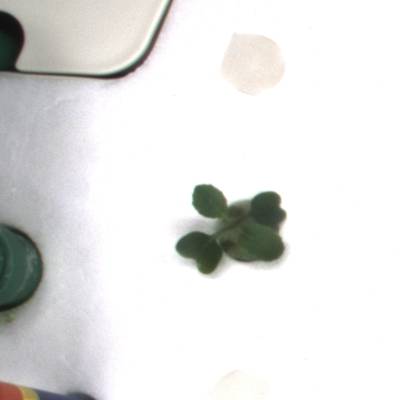
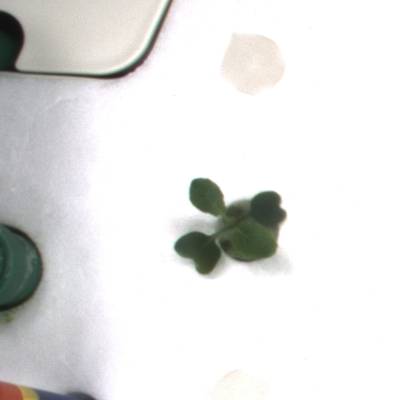
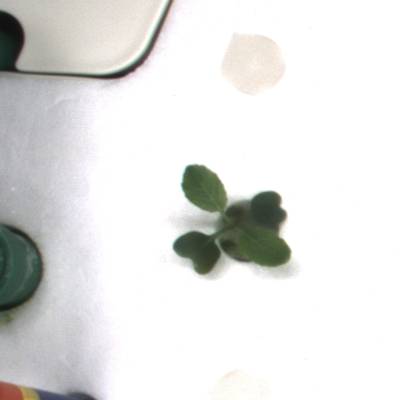
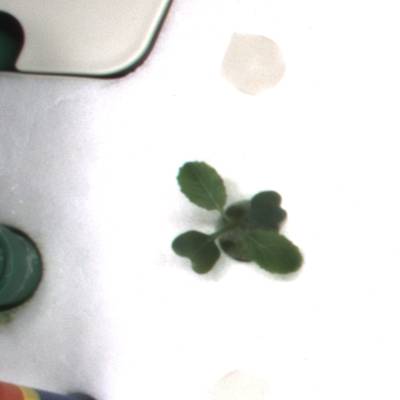
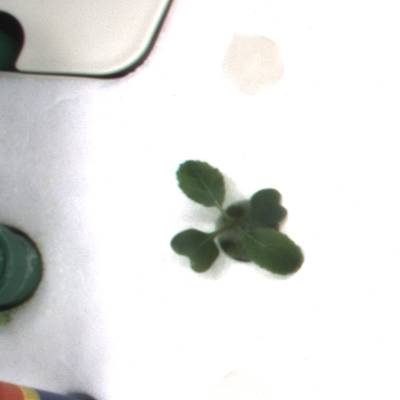
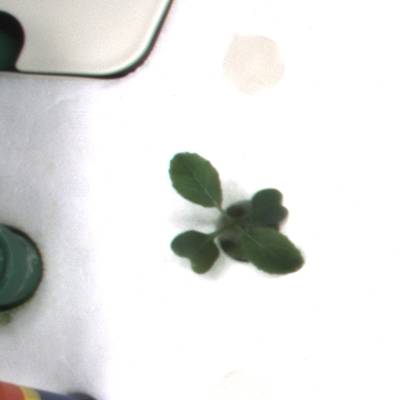
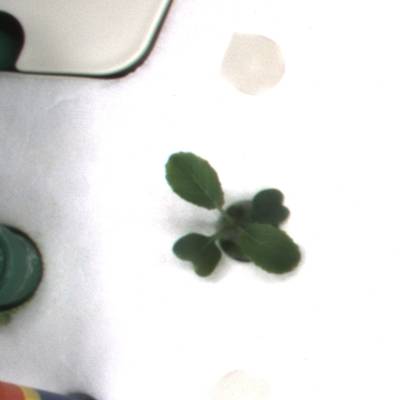
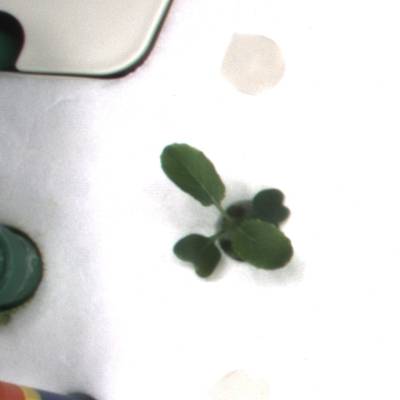
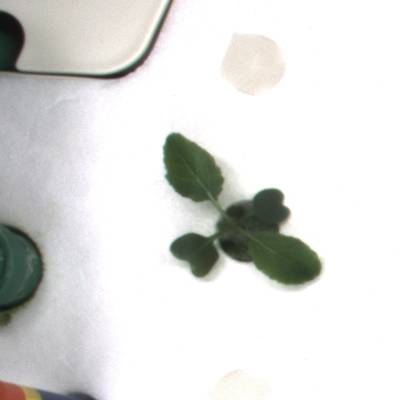
KOMATSUNA dataset has 1560 images. Click on one of the examples below or open "Explore" tool anytime you need to view dataset images with annotations. This tool has extended visualization capabilities like zoom, translation, objects table, custom filters and more. Hover the mouse over the images to hide or show annotations.


Class balance #
There are 1 annotation classes in the dataset. Find the general statistics and balances for every class in the table below. Click any row to preview images that have labels of the selected class. Sort by column to find the most rare or prevalent classes.

Class ㅤ | Images ㅤ | Objects ㅤ | Count on image average | Area on image average |
|---|---|---|---|---|
leaf➔ mask | 1200 | 6184 | 5.15 | 9.08% |
Images #
Explore every single image in the dataset with respect to the number of annotations of each class it has. Click a row to preview selected image. Sort by any column to find anomalies and edge cases. Use horizontal scroll if the table has many columns for a large number of classes in the dataset.
Object distribution #
Interactive heatmap chart for every class with object distribution shows how many images are in the dataset with a certain number of objects of a specific class. Users can click cell and see the list of all corresponding images.
Class sizes #
The table below gives various size properties of objects for every class. Click a row to see the image with annotations of the selected class. Sort columns to find classes with the smallest or largest objects or understand the size differences between classes.
Class | Object count | Avg area | Max area | Min area | Min height | Min height | Max height | Max height | Avg height | Avg height | Min width | Min width | Max width | Max width |
|---|---|---|---|---|---|---|---|---|---|---|---|---|---|---|
leaf mask | 6184 | 1.76% | 14.51% | 0% | 1px | 0.21% | 257px | 53.54% | 59px | 14.48% | 1px | 0.18% | 294px | 57.92% |
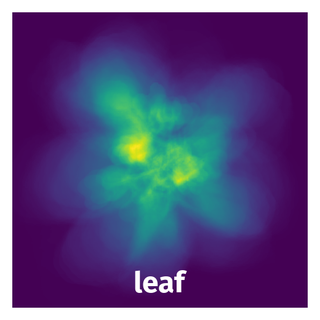
Spatial Heatmap #
The heatmaps below give the spatial distributions of all objects for every class. These visualizations provide insights into the most probable and rare object locations on the image. It helps analyze objects' placements in a dataset.
Objects #
Table contains all 6184 objects. Click a row to preview an image with annotations, and use search or pagination to navigate. Sort columns to find outliers in the dataset.
Object ID ㅤ | Class ㅤ | Image name click row to open | Image size height x width | Height ㅤ | Height ㅤ | Width ㅤ | Width ㅤ | Area ㅤ |
|---|---|---|---|---|---|---|---|---|
1➔ | leaf mask | rgb_01_00_003_04.png | 480 x 480 | 58px | 12.08% | 67px | 13.96% | 0.83% |
2➔ | leaf mask | rgb_01_00_003_04.png | 480 x 480 | 42px | 8.75% | 60px | 12.5% | 0.61% |
3➔ | leaf mask | rgb_01_00_003_04.png | 480 x 480 | 59px | 12.29% | 80px | 16.67% | 1.06% |
4➔ | leaf mask | rgb_01_00_003_04.png | 480 x 480 | 74px | 15.42% | 59px | 12.29% | 0.97% |
5➔ | leaf mask | rgb_02_03_005_05.png | 480 x 480 | 53px | 11.04% | 55px | 11.46% | 0.76% |
6➔ | leaf mask | rgb_02_03_005_05.png | 480 x 480 | 43px | 8.96% | 46px | 9.58% | 0.53% |
7➔ | leaf mask | rgb_02_03_005_05.png | 480 x 480 | 80px | 16.67% | 112px | 23.33% | 1.51% |
8➔ | leaf mask | rgb_02_03_005_05.png | 480 x 480 | 101px | 21.04% | 109px | 22.71% | 2.81% |
9➔ | leaf mask | rgb_02_03_005_05.png | 480 x 480 | 43px | 8.96% | 49px | 10.21% | 0.52% |
10➔ | leaf mask | rgb_02_03_005_05.png | 480 x 480 | 13px | 2.71% | 10px | 2.08% | 0.04% |
License #
The KOMATSUNA Dataset for Instance Segmentation, Tracking and Reconstruction is publicly available.
Citation #
If you make use of the KOMATSUNA data, please cite the following reference:
@InProceedings{Uchiyama_2017_ICCV_Workshops,
  author = {Uchiyama, Hideaki and Sakurai, Shunsuke and Mishima, Masashi and Arita, Daisaku and Okayasu, Takashi and Shimada, Atsushi and Taniguchi, Rin-ichiro},
  title = {An Easy-To-Setup 3D Phenotyping Platform for KOMATSUNA Dataset},
  booktitle = {Proceedings of the IEEE International Conference on Computer Vision (ICCV) Workshops},
  month = {Oct},
  year = {2017}
}
If you are happy with Dataset Ninja and use provided visualizations and tools in your work, please cite us:
@misc{ visualization-tools-for-komatsuna-dataset,
  title = { Visualization Tools for KOMATSUNA Dataset },
  type = { Computer Vision Tools },
  author = { Dataset Ninja },
  howpublished = { \url{ https://datasetninja.com/komatsuna } },
  url = { https://datasetninja.com/komatsuna },
  journal = { Dataset Ninja },
  publisher = { Dataset Ninja },
  year = { 2026 },
  month = { jul },
  note = { visited on 2026-07-29 },
}
Download #
Dataset KOMATSUNA can be downloaded in Supervisely format:
As an alternative, it can be downloaded with dataset-tools package:
pip install --upgrade dataset-tools
… using following python code:
import dataset_tools as dtools

dtools.download(dataset='KOMATSUNA', dst_dir='~/dataset-ninja/')
Make sure not to overlook the python code example available on the Supervisely Developer Portal. It will give you a clear idea of how to effortlessly work with the downloaded dataset.
The data in original format can be downloaded here.
Disclaimer #
Our gal from the legal dep told us we need to post this:
Dataset Ninja provides visualizations and statistics for some datasets that can be found online and can be downloaded by general audience. Dataset Ninja is not a dataset hosting platform and can only be used for informational purposes. The platform does not claim any rights for the original content, including images, videos, annotations and descriptions. Joint publishing is prohibited.
You take full responsibility when you use datasets presented at Dataset Ninja, as well as other information, including visualizations and statistics we provide. You are in charge of compliance with any dataset license and all other permissions. You are required to navigate datasets homepage and make sure that you can use it. In case of any questions, get in touch with us at hello@datasetninja.com.