Introduction #
The authors of the Kvasir-Instrument dataset highlight the need for improved tracking and analysis of gastrointestinal (GI) procedures, particularly during and after colonoscopies. The dataset comprises 590 annotated frames featuring GI procedure tools like snares, balloons, and biopsy forceps. It includes ground truth masks and bounding boxes, validated by two expert GI endoscopists. The authors emphasize that critical information, such as disease borders, development, and the size of resected areas, often goes untracked, leading to challenges in follow-up and post-treatment reassessment. Additionally, they provide a baseline for GI tool segmentation to promote algorithm development.
In the context of minimally invasive surgery (MIS), the authors acknowledge its advantages, such as reduced pain, shorter hospital stays, faster recovery, and less scarring compared to traditional open surgery. They note the complexity of MIS procedures, where surgeons must navigate precise hand-eye coordination, often resulting in limited mobility and a restricted field of view. Importantly, they highlight that, unlike accessory organ treatments, GI tract procedures don’t require incisions, making them less invasive. GI procedures encompass both surveillance and treatment, involving various tools like balloon dilatation, biopsy forceps, snares, and submucosal injections. The authors suggest that computer and robotic-assisted surgical systems can enhance surgical capabilities by providing additional patient information for decision-making. However, they stress the need to understand the spatial relationships between surgical instruments, cameras, and anatomy, particularly in GI tract endoscopy.
Kvasir-Instrument labels were made using HyperKvasir unlabelled data. The dataset was sourced from endoscopic examinations conducted at Bærum Hospital in Norway, using images and videos captured with Olympus and Pentax endoscopy equipment. They emphasize that all data collection adhered to patient consent protocols, and patient information was not used for archiving. Anonymization measures, such as random naming for publicly released frames, were implemented.
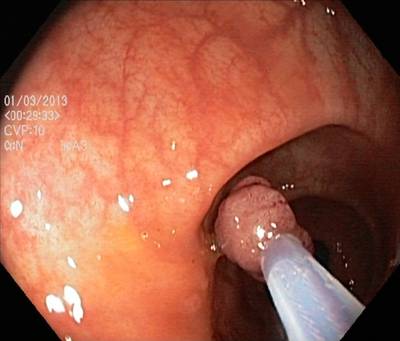
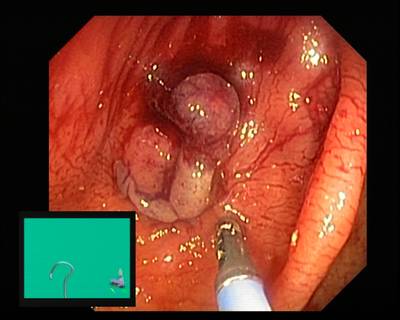
Regarding the annotation strategy, the authors describe uploading the dataset to labelbox and labeling the Region of Interest (ROI) for diagnostic and therapeutic tools, generating ground truth masks. They provide examples of annotated images, bounding boxes, image annotations, and generated masks:
The First two rows represent frames within biopsy forceps, the middle row consists of the metallic clip, the fourth row is a radiofrequency ablation probe and the last row depicts the crescent and hexagonal-shaped snares for polyp removal.
Annotation was performed in a three-step strategy: initial labeling by two experienced research assistants, cross-validation by two experienced GI experts, and final validation based on expert feedback. The Kvasir-Instrument dataset encompasses 590 frames featuring various GI endoscopy tools, annotated with bounding boxes and segmentation masks. Most tools are small to medium-sized, and the dataset is made publicly available, including original images, masks, bounding box information, and a visualization script for researchers to access and use.
Summary #
Kvasir Instrument: A Gastrointestinal Instrument Dataset is a dataset for instance segmentation, semantic segmentation, and object detection tasks. It is used in the medical industry.
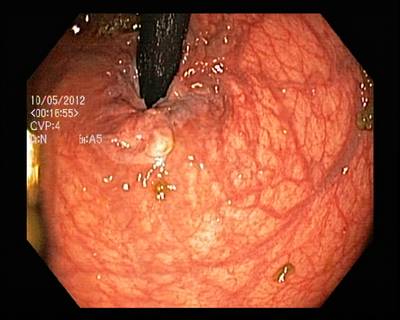
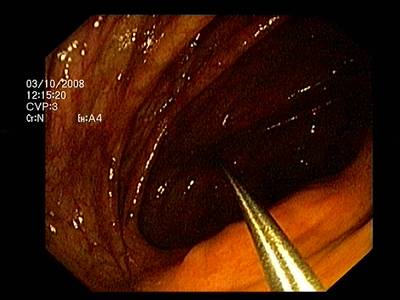
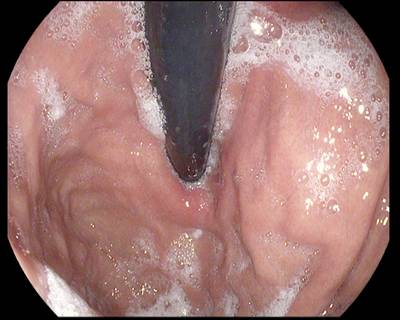
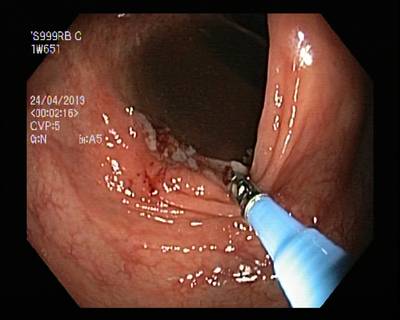
The dataset consists of 590 images with 1240 labeled objects belonging to 1 single class (instrument).
Images in the Kvasir Instrument dataset have pixel-level instance segmentation and bounding box annotations. Due to the nature of the instance segmentation task, it can be automatically transformed into a semantic segmentation task (only one mask for every class). All images are labeled (i.e. with annotations). There are 2 splits in the dataset: train (472 images) and test (118 images). The dataset was released in 2020 by the NOR-SWE-UK joint research group.

Explore #
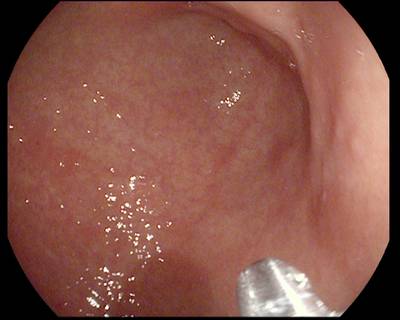
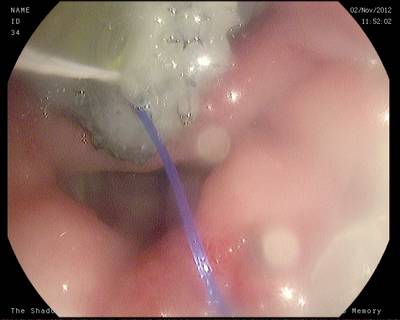
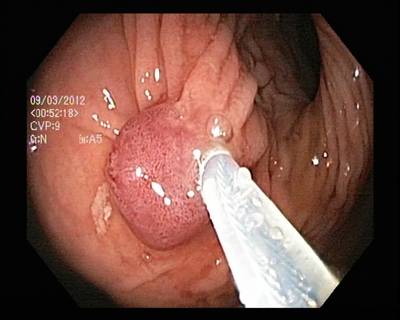
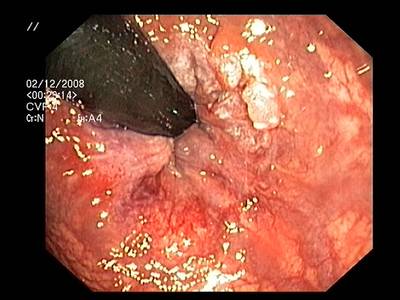
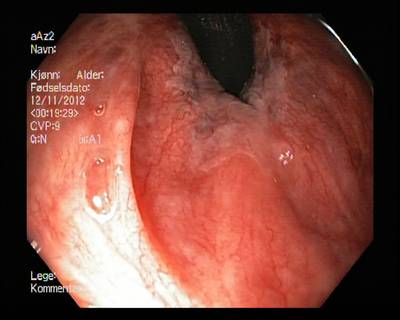
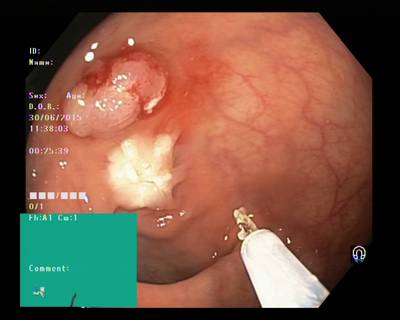
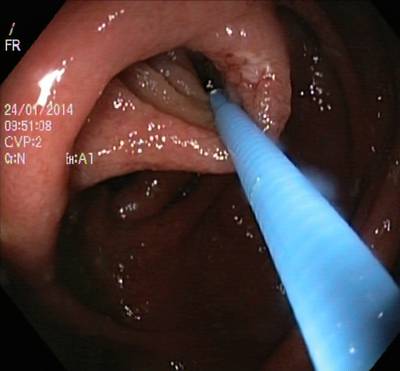
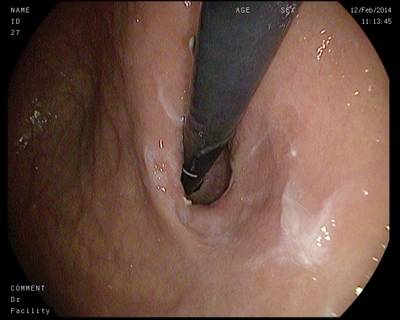
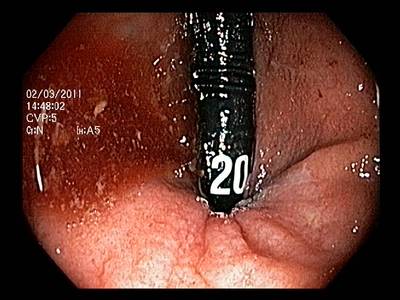
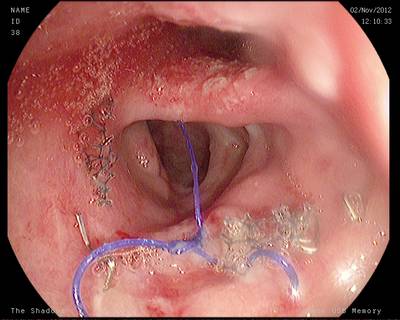
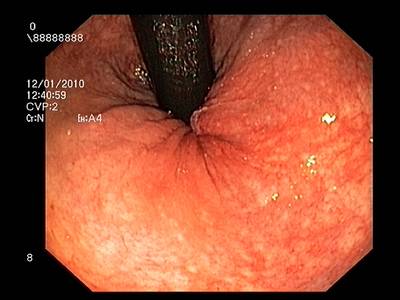
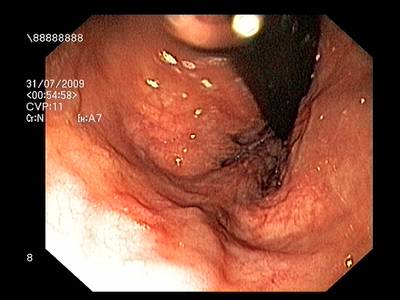
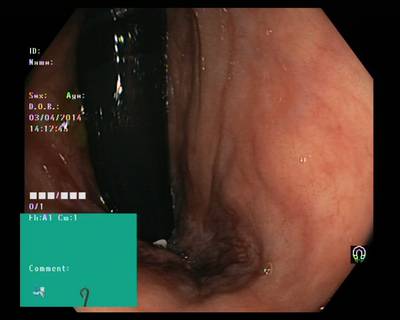
Kvasir Instrument dataset has 590 images. Click on one of the examples below or open "Explore" tool anytime you need to view dataset images with annotations. This tool has extended visualization capabilities like zoom, translation, objects table, custom filters and more. Hover the mouse over the images to hide or show annotations.


















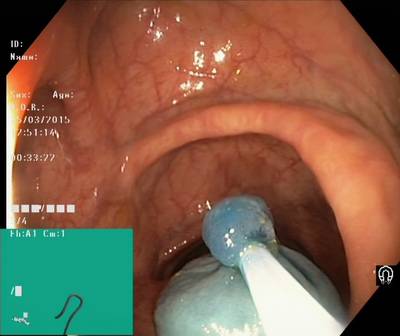

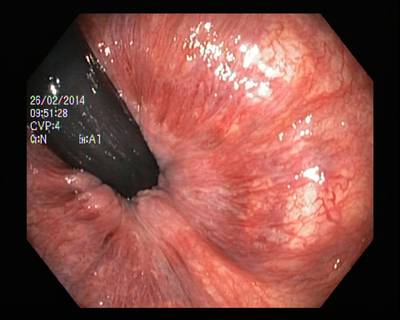

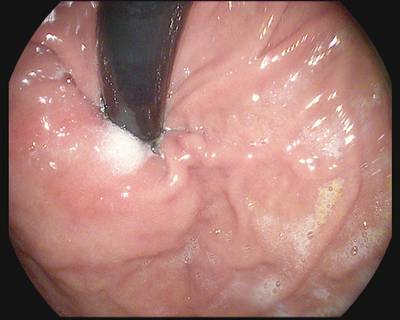


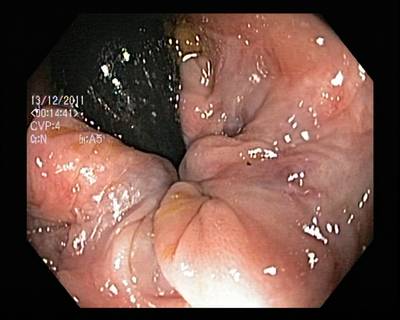

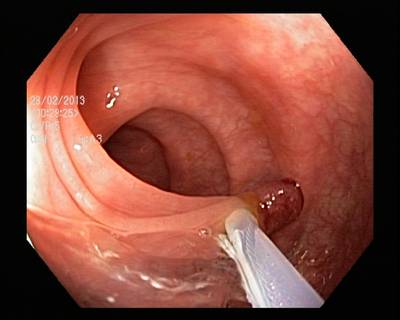

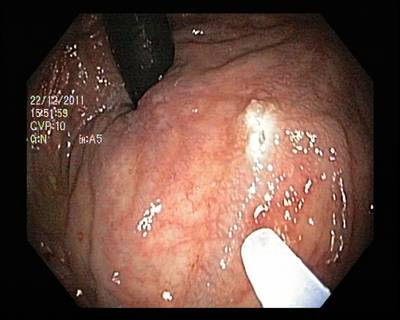

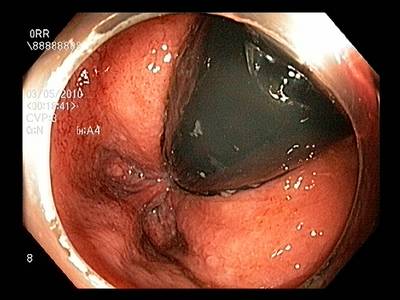

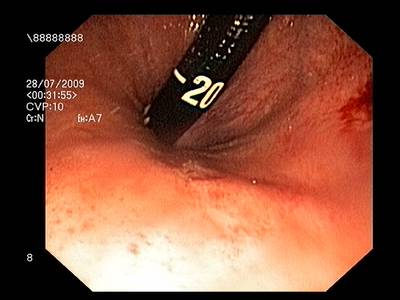





Class balance #
There are 1 annotation classes in the dataset. Find the general statistics and balances for every class in the table below. Click any row to preview images that have labels of the selected class. Sort by column to find the most rare or prevalent classes.
Class ㅤ | Images ㅤ | Objects ㅤ | Count on image average | Area on image average |
|---|---|---|---|---|
instrument➔ any | 590 | 1240 | 2.1 | 18.18% |
Images #
Explore every single image in the dataset with respect to the number of annotations of each class it has. Click a row to preview selected image. Sort by any column to find anomalies and edge cases. Use horizontal scroll if the table has many columns for a large number of classes in the dataset.
Object distribution #
Interactive heatmap chart for every class with object distribution shows how many images are in the dataset with a certain number of objects of a specific class. Users can click cell and see the list of all corresponding images.
Class sizes #
The table below gives various size properties of objects for every class. Click a row to see the image with annotations of the selected class. Sort columns to find classes with the smallest or largest objects or understand the size differences between classes.
Class | Object count | Avg area | Max area | Min area | Min height | Min height | Max height | Max height | Avg height | Avg height | Min width | Min width | Max width | Max width |
|---|---|---|---|---|---|---|---|---|---|---|---|---|---|---|
instrument any | 1240 | 13.37% | 100% | 0.16% | 50px | 8.68% | 855px | 100% | 317px | 48.94% | 45px | 4.92% | 1170px | 100% |
Spatial Heatmap #
The heatmaps below give the spatial distributions of all objects for every class. These visualizations provide insights into the most probable and rare object locations on the image. It helps analyze objects' placements in a dataset.

Objects #
Table contains all 1240 objects. Click a row to preview an image with annotations, and use search or pagination to navigate. Sort columns to find outliers in the dataset.
Object ID ㅤ | Class ㅤ | Image name click row to open | Image size height x width | Height ㅤ | Height ㅤ | Width ㅤ | Width ㅤ | Area ㅤ |
|---|---|---|---|---|---|---|---|---|
1➔ | instrument any | ckcx45a9z000n3b5y7ql1o5d6.jpg | 1024 x 1280 | 449px | 43.85% | 382px | 29.84% | 13.09% |
2➔ | instrument any | ckcx45a9z000n3b5y7ql1o5d6.jpg | 1024 x 1280 | 447px | 43.65% | 380px | 29.69% | 5.97% |
3➔ | instrument any | ckcvuxt6g000d3b5y3b9n1z8f.jpg | 1024 x 1280 | 519px | 50.68% | 323px | 25.23% | 12.79% |
4➔ | instrument any | ckcvuxt6g000d3b5y3b9n1z8f.jpg | 1024 x 1280 | 518px | 50.59% | 321px | 25.08% | 8.99% |
5➔ | instrument any | ckd0aaflt00013b5y0szhvahy.jpg | 576 x 768 | 453px | 78.65% | 362px | 47.14% | 37.07% |
6➔ | instrument any | ckd0aaflt00013b5y0szhvahy.jpg | 576 x 768 | 451px | 78.3% | 360px | 46.88% | 17.43% |
7➔ | instrument any | ckcx3ooqo00053b5ybcja5sfq.jpg | 576 x 720 | 213px | 36.98% | 183px | 25.42% | 9.4% |
8➔ | instrument any | ckcx3ooqo00053b5ybcja5sfq.jpg | 576 x 720 | 211px | 36.63% | 181px | 25.14% | 5.47% |
9➔ | instrument any | ckcvuzl1l000g3b5y1imjacq7.jpg | 576 x 768 | 196px | 34.03% | 174px | 22.66% | 7.71% |
10➔ | instrument any | ckcvuzl1l000g3b5y1imjacq7.jpg | 576 x 768 | 194px | 33.68% | 172px | 22.4% | 3.57% |
License #
Terms of use
The use of the Kvasir-instrument dataset is restricted to research and education purposes. The use of the dataset is forbidden for commercial use without prior written permission. For other purposes, contact authors via Email. In all documents and publications that use the Kvasir-SEG dataset or report experimental results based on the Kvasir-Instrument dataset, a reference to the dataset paper has to be included (see above). Please email debesh@simula.no if you have any questions regarding how to cite the dataset.
Citation #
If you make use of the Kvasir Instrument data, please cite the following reference:
@inproceedings{10.1007/978-3-030-67835-7_19,
  title = {Kvasir-Instrument: Diagnostic and Therapeutic
      Tool Segmentation Dataset in Gastrointestinal Endoscopy},
  author = {
      Jha, Debesh and Ali, Sharib and Emanuelsen, Krister and Hicks, Steven A. and
      Thambawita, Vajira and Garcia-Ceja, Enrique and Riegler, Michael A. and
      de Lange, Thomas and Schmidt, Peter T. and Johansen, H{\aa}vard D. and
      Johansen, Dag and Halvorsen, P{\aa}l
  },
  booktitle = {MultiMedia Modeling},
  year = {2021},
  publisher = {Springer International Publishing},
  address = {Cham},
  pages = {218--229},
}
If you are happy with Dataset Ninja and use provided visualizations and tools in your work, please cite us:
@misc{ visualization-tools-for-kvasir-instrument-dataset,
  title = { Visualization Tools for Kvasir Instrument Dataset },
  type = { Computer Vision Tools },
  author = { Dataset Ninja },
  howpublished = { \url{ https://datasetninja.com/kvasir-instrument } },
  url = { https://datasetninja.com/kvasir-instrument },
  journal = { Dataset Ninja },
  publisher = { Dataset Ninja },
  year = { 2026 },
  month = { feb },
  note = { visited on 2026-02-23 },
}
Download #
Dataset Kvasir Instrument can be downloaded in Supervisely format:
As an alternative, it can be downloaded with dataset-tools package:
pip install --upgrade dataset-tools
… using following python code:
import dataset_tools as dtools

dtools.download(dataset='Kvasir Instrument', dst_dir='~/dataset-ninja/')
Make sure not to overlook the python code example available on the Supervisely Developer Portal. It will give you a clear idea of how to effortlessly work with the downloaded dataset.
The data in original format can be downloaded here.
Disclaimer #
Our gal from the legal dep told us we need to post this:
Dataset Ninja provides visualizations and statistics for some datasets that can be found online and can be downloaded by general audience. Dataset Ninja is not a dataset hosting platform and can only be used for informational purposes. The platform does not claim any rights for the original content, including images, videos, annotations and descriptions. Joint publishing is prohibited.
You take full responsibility when you use datasets presented at Dataset Ninja, as well as other information, including visualizations and statistics we provide. You are in charge of compliance with any dataset license and all other permissions. You are required to navigate datasets homepage and make sure that you can use it. In case of any questions, get in touch with us at hello@datasetninja.com.


