

Introduction #
To provide a shared basis for comparing traffic light recognition (TLR) systems, the authors publish an extensive public LISA Traffic Light Dataset based on footage from US roads. The dataset contains annotated video sequences, captured under varying light and weather conditions using a stereo camera. The database consists of continuous test and training video sequences, totaling 43,007 frames and 113,888 annotated traffic lights. The sequences are captured by a stereo camera mounted on the roof of a vehicle driving under both night- and daytime with varying light and weather conditions.
Motivation
The effectiveness of transportation systems profoundly influences workforce mobility, environmental conditions, and energy consumption, thereby exerting a significant impact on foreign policy. Given the integral role transportation plays in people’s daily lives, its efficiency, safety, and cleanliness directly affect their health and well-being. Future enhancements to transportation systems are anticipated to stem from advancements in sensing, communication, and processing technologies. The advent of the automobile revolution in the early 20th century sparked a dramatic surge in road transportation, overwhelming the capacity of existing road networks to accommodate the escalating traffic volume. In response, traffic control devices (TCD) were developed to facilitate efficient and safe transportation by guiding, regulating, and warning drivers. These TCDs encompass various infrastructure elements, including signs, signaling lights, and pavement markings, aimed at communicating critical information to drivers.
Traffic control devices for safe and efficient traffic flow.
Traffic control devices (TCDs) play a crucial role in complex environments like intersections, where a wealth of information needs to be conveyed. Balancing the provision of adequate information with the avoidance of overwhelming and distracting drivers is key. The effectiveness of TCDs hinges on the driver’s ability to process the information within the constraints of time and volume. Excessive speed and information overload can lead to errors and stress among drivers.
For TCDs to function optimally, compliance from all road users is essential to prevent potentially hazardous situations. However, there are instances where drivers deliberately ignore TCDs. Research indicates that more than a third of Americans admit to intentionally running red lights in the past month. Non-compliance can stem from various factors such as rushing to beat a light, aggressive driving behaviors, distractions, misunderstandings, or faulty TCDs. While driving is often perceived as effortless due to automation of many tasks, this can lead to drivers being less focused, resulting in delayed reactions to critical events. Conversely, highly attentive driving can also lead to delayed reaction times due to stress, fatigue, or mental overload.
While widespread adoption of autonomous driving remains a distant prospect, lives can be safeguarded through the implementation of driver assistance systems (DAS) capable of monitoring the environment and intervening in critical situations. To effectively support drivers, DAS must compensate for their limitations. For instance, drivers may have difficulty noticing and recognizing certain TCDs. Studies indicate that while speed limit signs are almost always noticed, pedestrian crossing signs are often overlooked. The reaction times of drivers is longest in the center of the interval, where the decision is the most difficult.
Fused DAS system in intersection scenarios. (a) Turn right on red assistance. (b) Dilemma zone assistance.
Traffic lights
Traffic lights (TLs) play a vital role in regulating traffic flow by providing clear instructions to drivers regarding the right of way. This allocation of right of way is meticulously designed to minimize conflicts between vehicles and pedestrians traversing intersecting paths. TLs are intentionally conspicuous, employing bright-colored lamps, typically circular or arrow-shaped, housed within uniformly colored containers. The standard TL configuration features the familiar red-yellow-green sequence, with each light indicating whether drivers should halt, prepare to stop, or proceed. However, to address the complexities of various intersections, a range of alternative TL configurations has been developed.
Examples of vertical TLs found in California.
The orientation, color, size, and shape of the container will vary country to country and even city to city.
(a) San Diego, California. (b) Cincinnati, Ohio.
Besides the various configurations of TLs, the state sequence is an important characteristic of a TL. For increasing road safety and making it easier for drivers when driving across states, TLs in USA are regulated by the Federal Highway Administration in the Manual on Uniform Traffic Control Devices.
Basic TL sequence for states: green, yellow, and red.
Dataset description
Until now no comprehensive survey of traffic light recognition (TLR) research has been published. The authors presented an introductory overview of ongoing work on traffic light detection along with the LISA Traffic Light Dataset. Most published TLR systems are evaluated on datasets which are unavailable to the public. This makes comparison between existing methods and new contributions difficult. The contributions made in this survey paper are thus, fourfold:
- Clarifying challenges facing TLR systems.
- Overview of current methods in TLR research.
- Common evaluation procedure for TLR systems.
- High resolution, annotated, stereo video dataset.
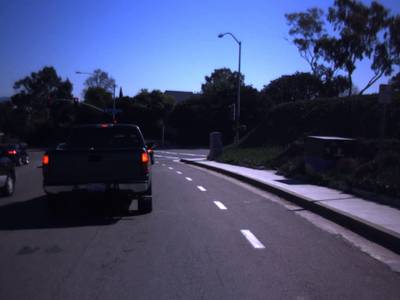
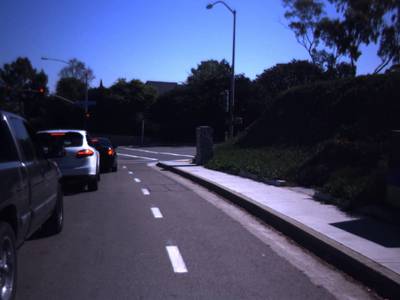
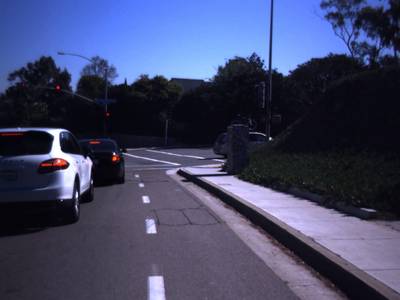
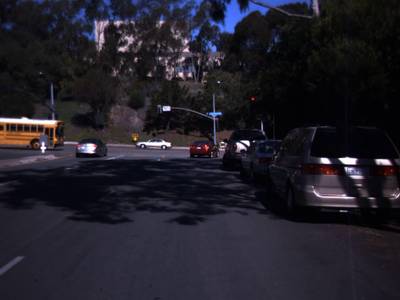
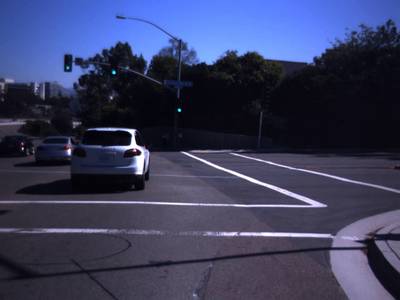
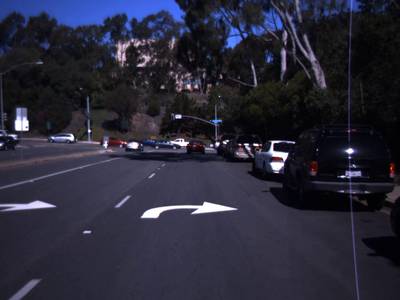
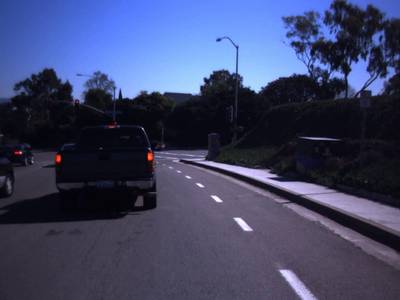
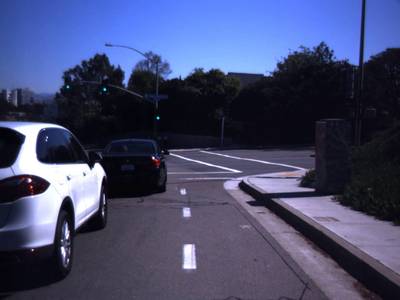
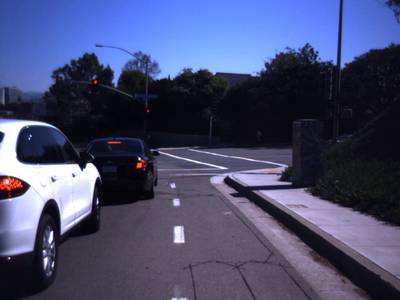
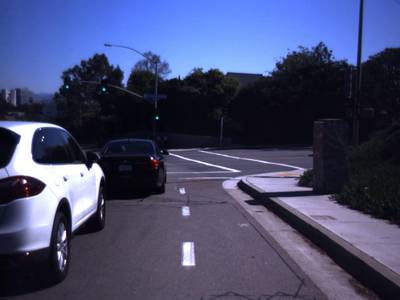
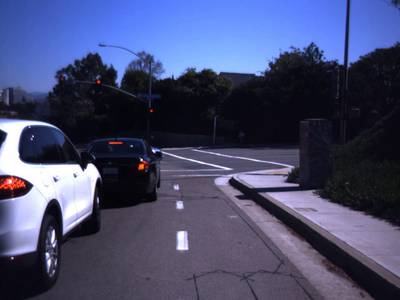
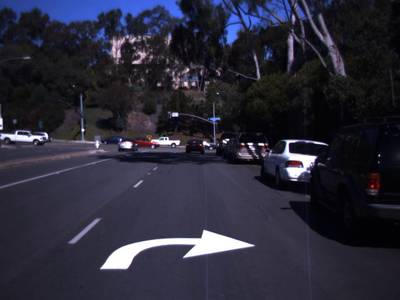
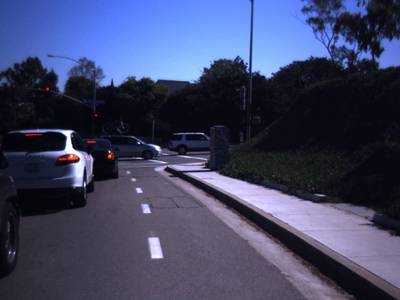
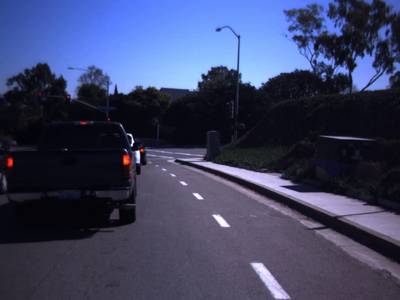
The LISA Traffic Light Dataset comprises traffic lights (TLs) located in San Diego, California, USA. This dataset offers two daytime and two nighttime sequences for testing purposes. The test sequences entail 23 minutes and 25 seconds of driving through San Diego. Stereo image pairs are captured using Point Grey’s Bumblebee XB3 (BBX3-13S2C-60), equipped with three lenses, each capturing images at a resolution of 1280x960. These lenses boast a Field of View (FoV) of 66°. With three lenses, the stereo camera accommodates two different baselines, 12 and 24 cm, with the wider baseline utilized for the LISA Traffic Light Dataset. The stereo images are uncompressed and rectified in real time. The Bumblebee XB3 is positioned centrally on the roof of the vehicle and connected to a laptop via FireWire-800 (IEEE-1394b). In addition to the four test sequences, 18 shorter video clips are provided for training and testing purposes. Manual adjustments were made to the gain and shutter speed to prevent oversaturation and minimize flickering effects from the TLs. For daytime clips, the shutter speed was set to 1/5000 sec with a gain of 0, while for nighttime clips, the shutter speed was 1/100 sec with a gain of 8. Alongside the stereo images, a Triclops calibration file is included, containing the factory calibration data for the Bumblebee XB3 camera used in the dataset.
The LISA Traffic Light Dataset utilizes stereo vision capturing techniques, as stereo vision is widely employed in various computer vision applications, including Traffic Light Recognition (TLR). Each sequence within the dataset is accompanied by manually labeled annotations specifically for the left stereo frame. These annotations encompass essential details such as the frame number, the outlined rectangular area surrounding the illuminated traffic light (TL) lamp, and its corresponding state. Examining a heatmap generated from all annotations within the dataset reveals a consistent trend: the majority of annotations cluster in the upper right portion of the frames, with only a few TLs annotated on the far left side. Consequently, it is prudent to focus the search for traffic lights primarily on the upper regions of the frames.
Aspect ratio histogram of LISA TL Dataset.
 Homepage
 Research Paper
Summary #
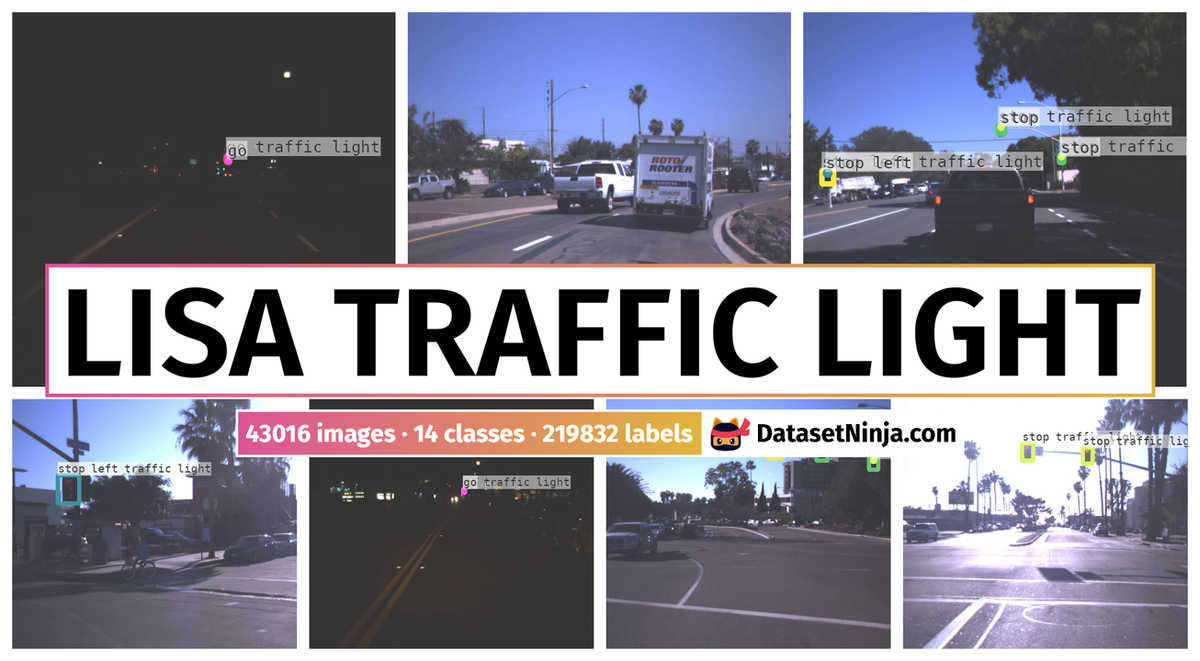
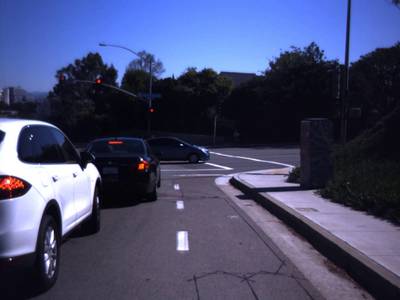
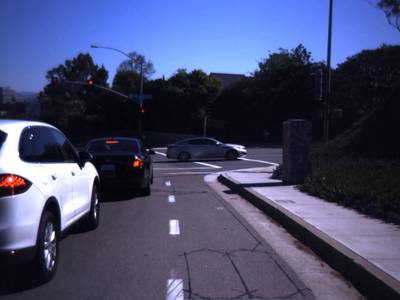
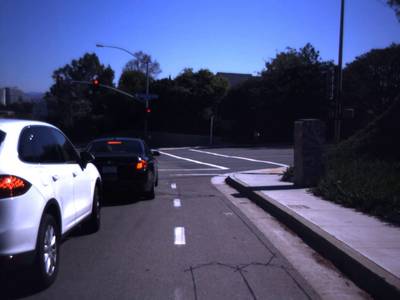
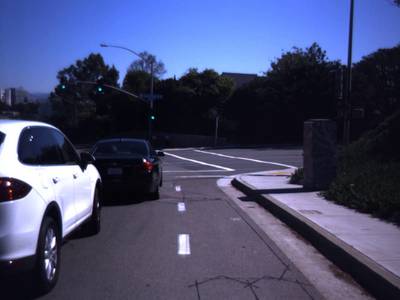
LISA Traffic Light Dataset is a dataset for an object detection task. It is used in the automotive industry.
The dataset consists of 43016 images with 219832 labeled objects belonging to 14 different classes including go, stop, go traffic light, and other: stop traffic light, stop left, stop left traffic light, go left, go left traffic light, warning, warning traffic light, warning left, warning left traffic light, go forward, and go forward traffic light.
Images in the LISA Traffic Light dataset have bounding box annotations. There are 6626 (15% of the total) unlabeled images (i.e. without annotations). There are 2 splits in the dataset: test (22481 images) and train (20535 images). Alternatively, the dataset could be split into 2 times of day: day (24988 images) and night (18028 images). Additionally, every image marked with its sequence and track frame number tags. The dataset was released in 2016 by the BEUMER Group, Denmark, Aalborg University, Denmark, and University of California, USA.
Explore #
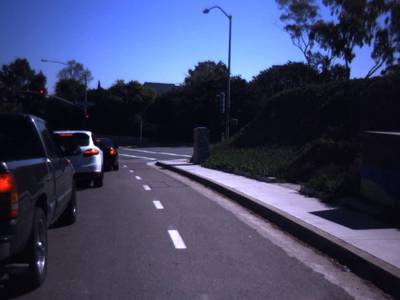
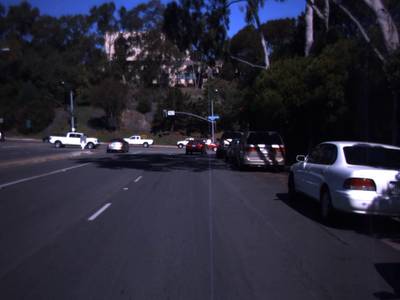
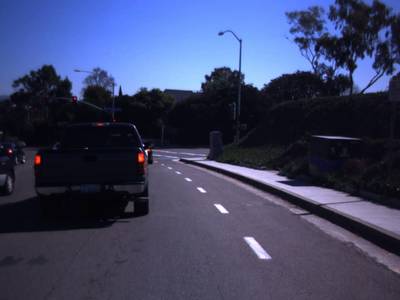
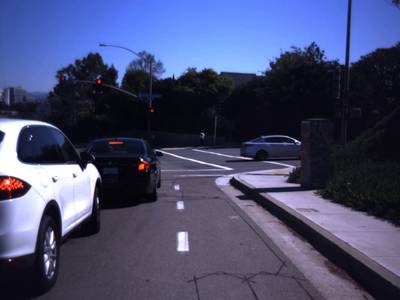
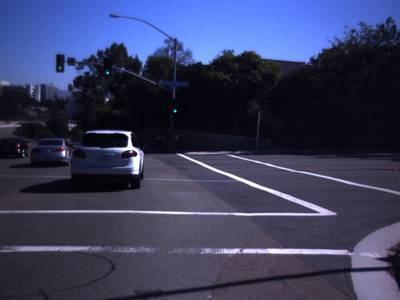
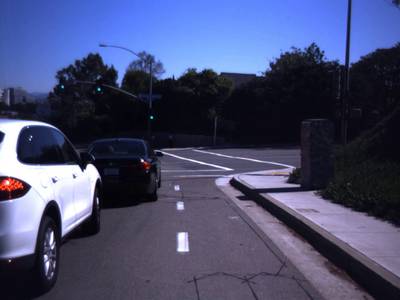
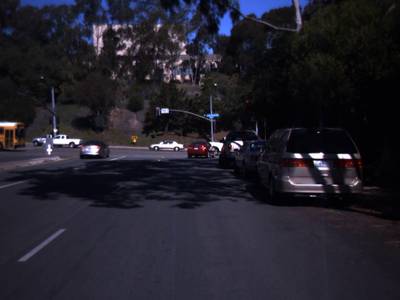
LISA Traffic Light dataset has 43016 images. Click on one of the examples below or open "Explore" tool anytime you need to view dataset images with annotations. This tool has extended visualization capabilities like zoom, translation, objects table, custom filters and more. Hover the mouse over the images to hide or show annotations.


Class balance #
There are 14 annotation classes in the dataset. Find the general statistics and balances for every class in the table below. Click any row to preview images that have labels of the selected class. Sort by column to find the most rare or prevalent classes.

Class ㅤ | Images ㅤ | Objects ㅤ | Count on image average | Area on image average |
|---|---|---|---|---|
go➔ rectangle | 18678 | 47237 | 2.53 | 0.11% |
stop➔ rectangle | 18652 | 44574 | 2.39 | 0.12% |
go traffic light➔ rectangle | 18626 | 46723 | 2.51 | 0.26% |
stop traffic light➔ rectangle | 18591 | 44318 | 2.38 | 0.26% |
stop left➔ rectangle | 10380 | 12750 | 1.23 | 0.05% |
stop left traffic light➔ rectangle | 10367 | 12734 | 1.23 | 0.25% |
go left➔ rectangle | 1888 | 2490 | 1.32 | 0.1% |
go left traffic light➔ rectangle | 1874 | 2476 | 1.32 | 0.26% |
warning➔ rectangle | 1129 | 2750 | 2.44 | 0.09% |
warning traffic light➔ rectangle | 1106 | 2669 | 2.41 | 0.16% |
Co-occurrence matrix #
Co-occurrence matrix is an extremely valuable tool that shows you the images for every pair of classes: how many images have objects of both classes at the same time. If you click any cell, you will see those images. We added the tooltip with an explanation for every cell for your convenience, just hover the mouse over a cell to preview the description.
Images #
Explore every single image in the dataset with respect to the number of annotations of each class it has. Click a row to preview selected image. Sort by any column to find anomalies and edge cases. Use horizontal scroll if the table has many columns for a large number of classes in the dataset.
Object distribution #
Interactive heatmap chart for every class with object distribution shows how many images are in the dataset with a certain number of objects of a specific class. Users can click cell and see the list of all corresponding images.
Class sizes #
The table below gives various size properties of objects for every class. Click a row to see the image with annotations of the selected class. Sort columns to find classes with the smallest or largest objects or understand the size differences between classes.
Class | Object count | Avg area | Max area | Min area | Min height | Min height | Max height | Max height | Avg height | Avg height | Min width | Min width | Max width | Max width |
|---|---|---|---|---|---|---|---|---|---|---|---|---|---|---|
go rectangle | 47237 | 0.04% | 1.55% | 0% | 3px | 0.31% | 171px | 17.81% | 23px | 2.4% | 3px | 0.23% | 161px | 12.58% |
go traffic light rectangle | 46723 | 0.1% | 1.92% | 0.01% | 13px | 1.35% | 195px | 20.31% | 41px | 4.24% | 8px | 0.62% | 161px | 12.58% |
stop rectangle | 44574 | 0.05% | 0.45% | 0% | 3px | 0.31% | 100px | 10.42% | 27px | 2.84% | 3px | 0.23% | 61px | 4.77% |
stop traffic light rectangle | 44318 | 0.11% | 0.62% | 0.01% | 11px | 1.15% | 113px | 11.77% | 43px | 4.52% | 7px | 0.55% | 70px | 5.47% |
stop left rectangle | 12750 | 0.04% | 1.78% | 0% | 4px | 0.42% | 185px | 19.27% | 22px | 2.33% | 4px | 0.31% | 118px | 9.22% |
stop left traffic light rectangle | 12734 | 0.2% | 1.78% | 0.01% | 11px | 1.15% | 185px | 19.27% | 53px | 5.53% | 7px | 0.55% | 118px | 9.22% |
warning rectangle | 2750 | 0.04% | 0.55% | 0% | 3px | 0.31% | 101px | 10.52% | 23px | 2.38% | 3px | 0.23% | 71px | 5.55% |
warning traffic light rectangle | 2669 | 0.07% | 0.55% | 0.01% | 11px | 1.15% | 101px | 10.52% | 35px | 3.67% | 7px | 0.55% | 71px | 5.55% |
go left rectangle | 2490 | 0.08% | 1.39% | 0% | 4px | 0.42% | 151px | 15.73% | 30px | 3.14% | 4px | 0.31% | 161px | 12.58% |
go left traffic light rectangle | 2476 | 0.2% | 1.69% | 0.02% | 16px | 1.67% | 191px | 19.9% | 55px | 5.7% | 10px | 0.78% | 161px | 12.58% |
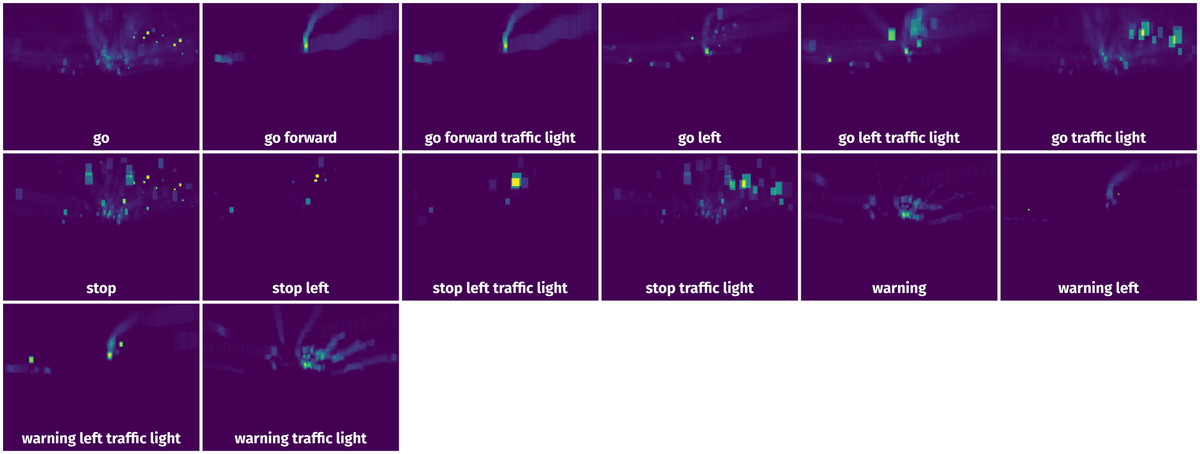
Spatial Heatmap #
The heatmaps below give the spatial distributions of all objects for every class. These visualizations provide insights into the most probable and rare object locations on the image. It helps analyze objects' placements in a dataset.
Objects #
Table contains all 100848 objects. Click a row to preview an image with annotations, and use search or pagination to navigate. Sort columns to find outliers in the dataset.
Object ID ㅤ | Class ㅤ | Image name click row to open | Image size height x width | Height ㅤ | Height ㅤ | Width ㅤ | Width ㅤ | Area ㅤ |
|---|---|---|---|---|---|---|---|---|
1➔ | go traffic light rectangle | dayClip2--00718.jpg | 960 x 1280 | 66px | 6.88% | 43px | 3.36% | 0.23% |
2➔ | go rectangle | dayClip2--00718.jpg | 960 x 1280 | 14px | 1.46% | 15px | 1.17% | 0.02% |
3➔ | go traffic light rectangle | nightClip2--01048.jpg | 960 x 1280 | 46px | 4.79% | 28px | 2.19% | 0.1% |
4➔ | go traffic light rectangle | nightClip2--01048.jpg | 960 x 1280 | 34px | 3.54% | 29px | 2.27% | 0.08% |
5➔ | go rectangle | nightClip2--01048.jpg | 960 x 1280 | 16px | 1.67% | 16px | 1.25% | 0.02% |
6➔ | go rectangle | nightClip2--01048.jpg | 960 x 1280 | 12px | 1.25% | 17px | 1.33% | 0.02% |
7➔ | go traffic light rectangle | dayClip12--00083.jpg | 960 x 1280 | 56px | 5.83% | 43px | 3.36% | 0.2% |
8➔ | go traffic light rectangle | dayClip12--00083.jpg | 960 x 1280 | 76px | 7.92% | 61px | 4.77% | 0.38% |
9➔ | go rectangle | dayClip12--00083.jpg | 960 x 1280 | 12px | 1.25% | 15px | 1.17% | 0.01% |
10➔ | go rectangle | dayClip12--00083.jpg | 960 x 1280 | 16px | 1.67% | 21px | 1.64% | 0.03% |
License #
LISA Traffic Light Dataset is under CC BY-NC-SA 4.0 license.
Citation #
If you make use of the LISA Traffic Light data, please cite the following reference:
@article{jensen2016vision,
  title={Vision for looking at traffic lights: Issues, survey, and perspectives},
  author={Jensen, Morten Born{\o} and Philipsen, Mark Philip and M{\o}gelmose, Andreas and Moeslund, Thomas Baltzer and Trivedi, Mohan Manubhai},
  journal={IEEE Transactions on Intelligent Transportation Systems},
  volume={17},
  number={7},
  pages={1800--1815},
  year={2016},
  doi={10.1109/TITS.2015.2509509},
  publisher={IEEE}
}
If you are happy with Dataset Ninja and use provided visualizations and tools in your work, please cite us:
@misc{ visualization-tools-for-lisa-traffic-light-dataset,
  title = { Visualization Tools for LISA Traffic Light Dataset },
  type = { Computer Vision Tools },
  author = { Dataset Ninja },
  howpublished = { \url{ https://datasetninja.com/lisa-traffic-light } },
  url = { https://datasetninja.com/lisa-traffic-light },
  journal = { Dataset Ninja },
  publisher = { Dataset Ninja },
  year = { 2026 },
  month = { jul },
  note = { visited on 2026-07-18 },
}
Download #
Dataset LISA Traffic Light can be downloaded in Supervisely format:
As an alternative, it can be downloaded with dataset-tools package:
pip install --upgrade dataset-tools
… using following python code:
import dataset_tools as dtools

dtools.download(dataset='LISA Traffic Light', dst_dir='~/dataset-ninja/')
Make sure not to overlook the python code example available on the Supervisely Developer Portal. It will give you a clear idea of how to effortlessly work with the downloaded dataset.
The data in original format can be downloaded here.
Disclaimer #
Our gal from the legal dep told us we need to post this:
Dataset Ninja provides visualizations and statistics for some datasets that can be found online and can be downloaded by general audience. Dataset Ninja is not a dataset hosting platform and can only be used for informational purposes. The platform does not claim any rights for the original content, including images, videos, annotations and descriptions. Joint publishing is prohibited.
You take full responsibility when you use datasets presented at Dataset Ninja, as well as other information, including visualizations and statistics we provide. You are in charge of compliance with any dataset license and all other permissions. You are required to navigate datasets homepage and make sure that you can use it. In case of any questions, get in touch with us at hello@datasetninja.com.