

Introduction #
According to the authors of Maize Tassel Detection dataset, the timing of flowering profoundly impacts crop productivity in agriculture, as early flowering can lead to premature maturation, and late flowering may result in season-related damage. Maize, in particular, is highly sensitive during its flowering stage. The dataset was created to focus on the development and comparison of two deep learning-based methods for automatic tassel detection using imagery from unmanned aerial vehicles. This approach was applied to 500 genotypes, comprising 750 plots within a 2-hectare breeding field.
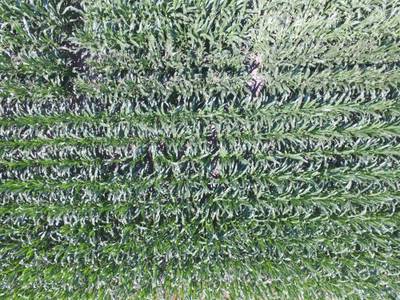
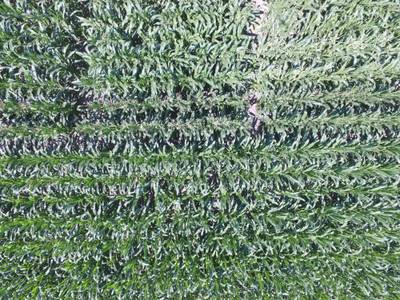
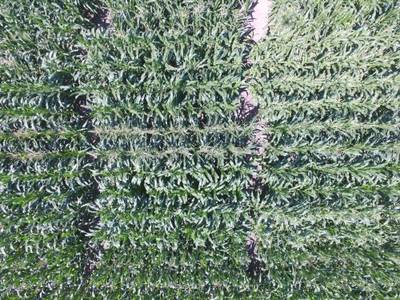
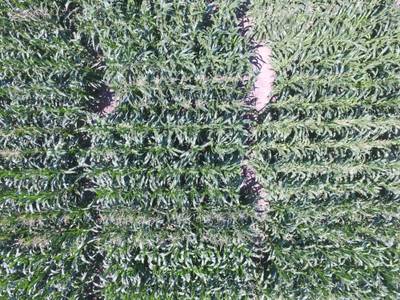
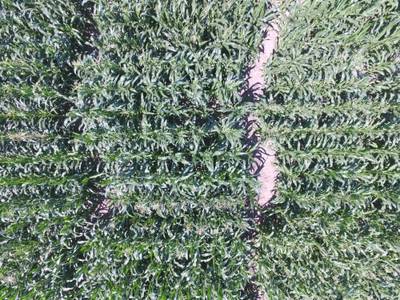
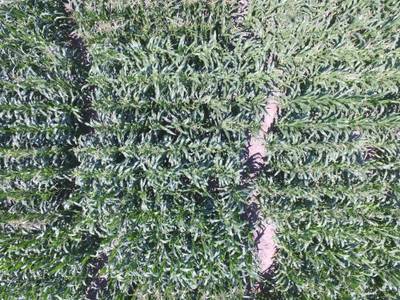
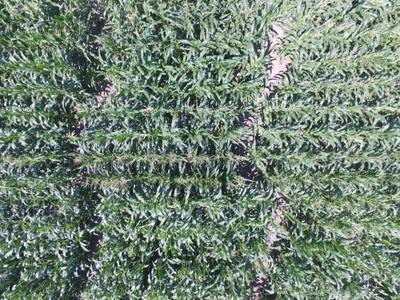
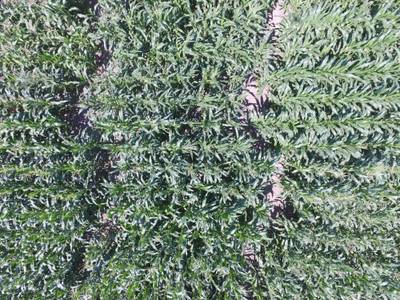
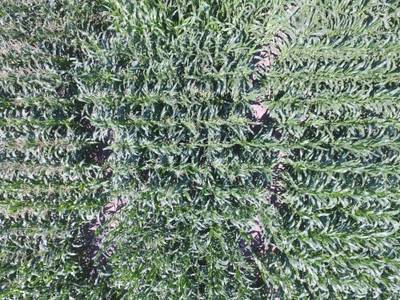
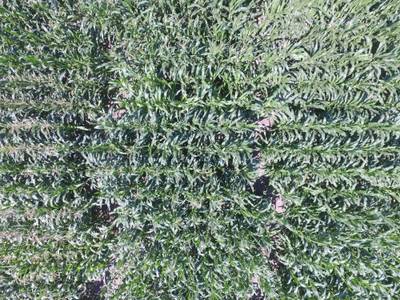
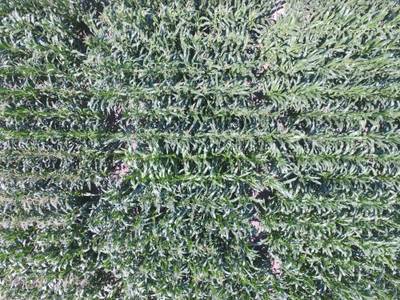
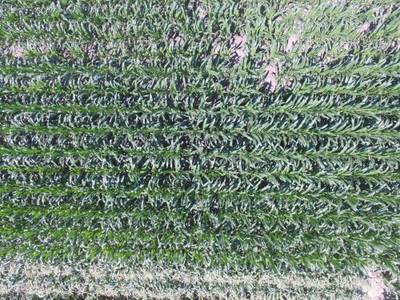
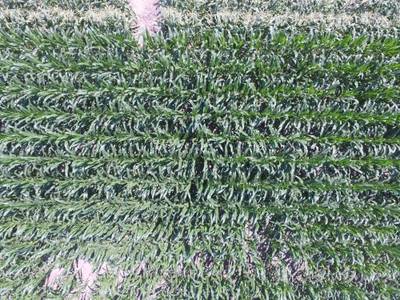
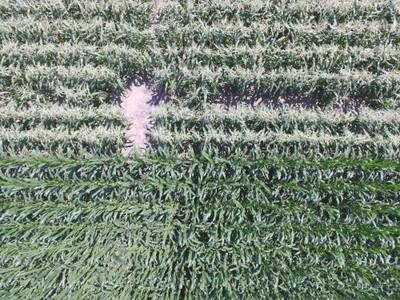
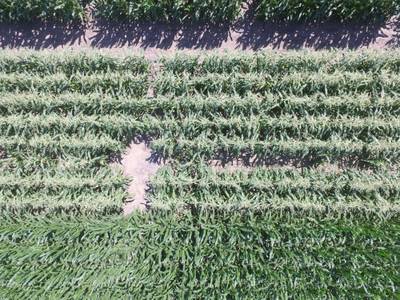
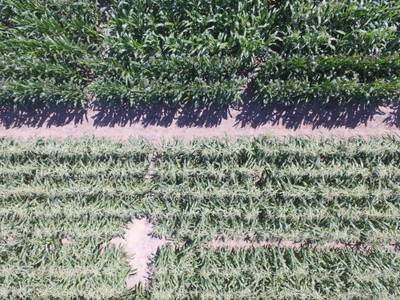
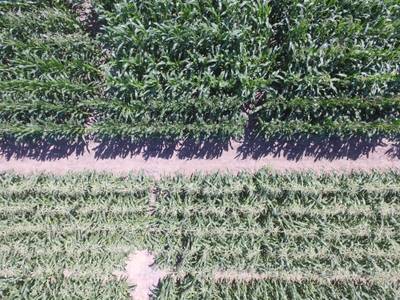
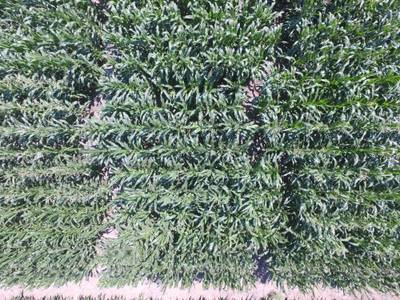
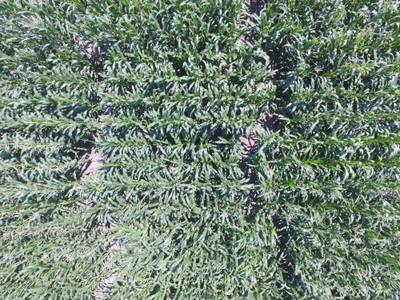
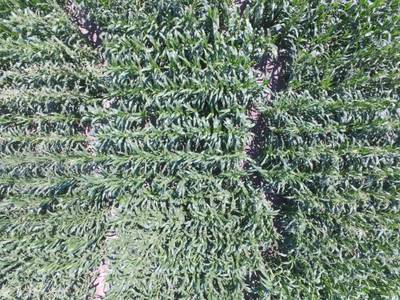
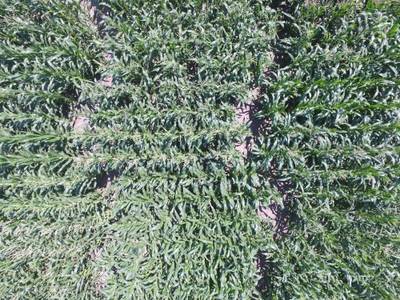
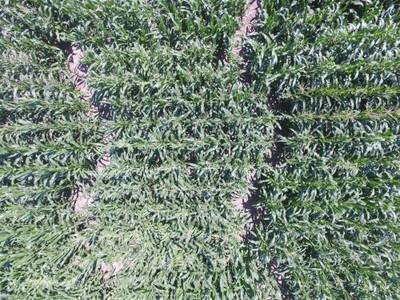
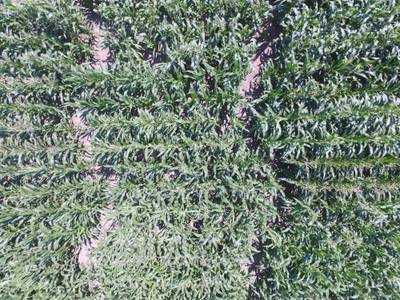
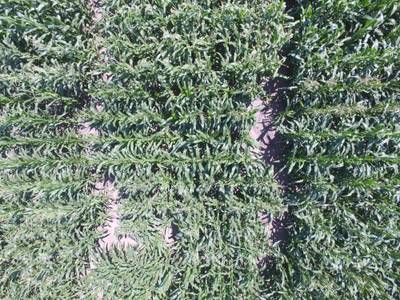
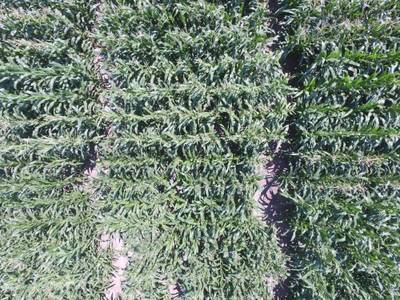
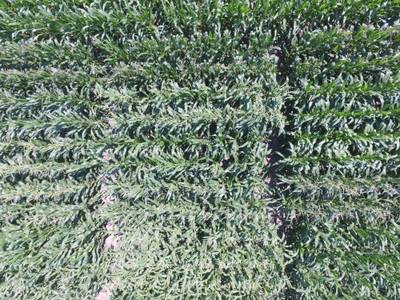
The aerial RGB imagery was collected by a UAV (DJI Phantom 3 Pro) over a maize breeding field located in Mead, Nebraska, in late July 2017. The UAV was flying at a low altitude (20 m AGL), capturing images with approximately 90% forward overlap and 85% side overlap. Images were collected in July 2017, fifty-four days after planting, coinciding with the flowering stage of a substantial portion of the research varieties.
The raw images, characterized by a high resolution of 3000 × 4000 pixels, posed challenges in terms of precise labeling and the computational resources required for tassel identification. The authors divided each raw image into non-overlapping sub-images measuring 1000 × 1000 pixels, creating a 3 × 4 grid of smaller images from each original image. These smaller images were subsequently utilized in the labeling process and for training the deep learning models. The maize tassels were later labeled and used to train CNN models to automatically detect the tassels.
 Homepage
 Research Paper
 GitHub
Summary #
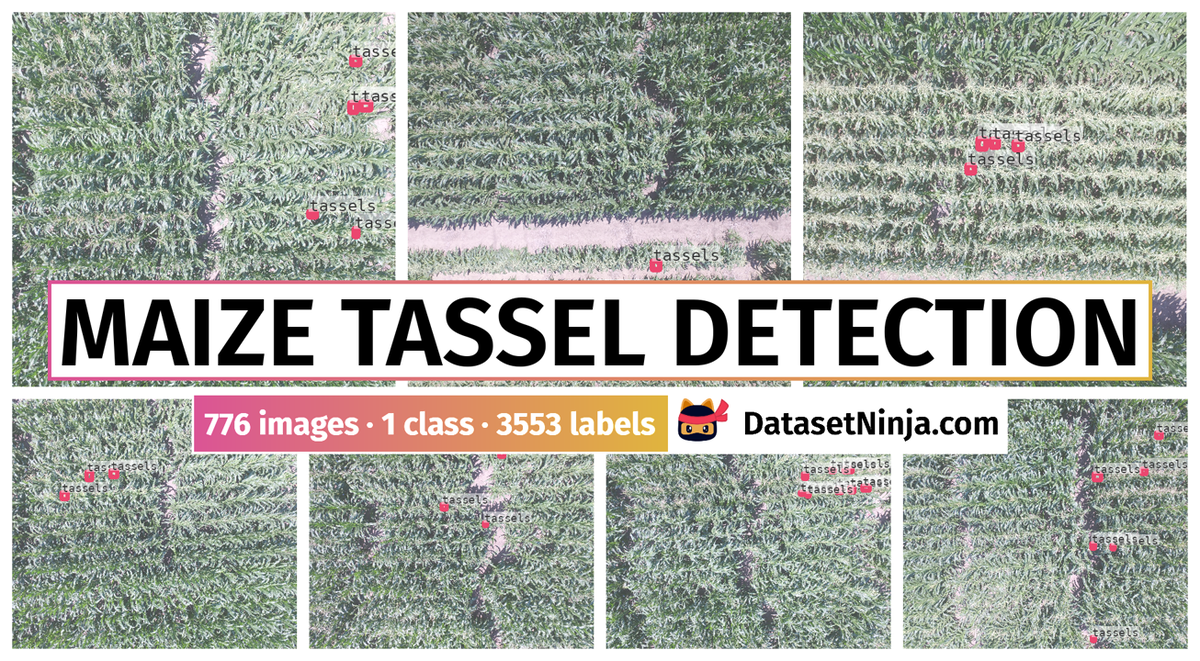
Maize Tassel Detection from UAV Imagery Using Deep Learning is a dataset for an object detection task. It is used in the agricultural industry.
The dataset consists of 776 images with 3553 labeled objects belonging to 1 single class (tassels).
Images in the Maize Tassel Detection dataset have bounding box annotations. There are 101 (13% of the total) unlabeled images (i.e. without annotations). There are no pre-defined train/val/test splits in the dataset. The dataset was released in 2021 by the University of Nebraska-Lincoln, USA and University of Illinois at Urbana Champaign, USA.
Explore #
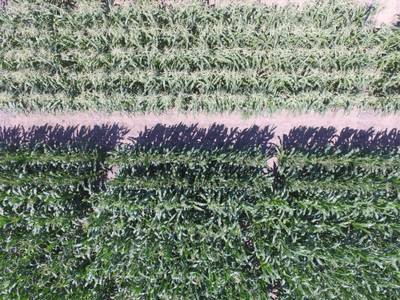
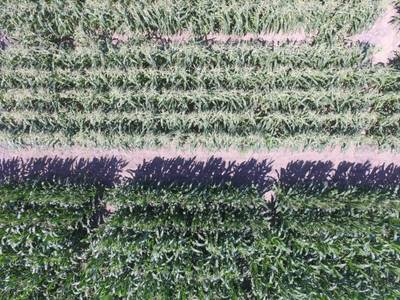
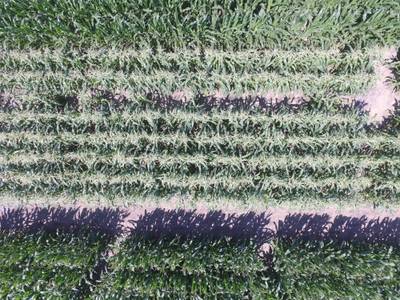
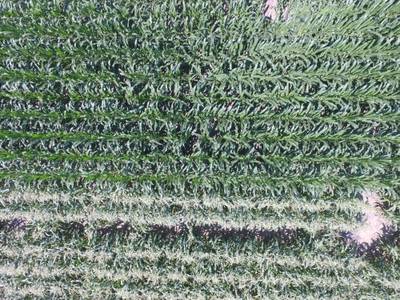
Maize Tassel Detection dataset has 776 images. Click on one of the examples below or open "Explore" tool anytime you need to view dataset images with annotations. This tool has extended visualization capabilities like zoom, translation, objects table, custom filters and more. Hover the mouse over the images to hide or show annotations.


Class balance #
There are 1 annotation classes in the dataset. Find the general statistics and balances for every class in the table below. Click any row to preview images that have labels of the selected class. Sort by column to find the most rare or prevalent classes.

Class ㅤ | Images ㅤ | Objects ㅤ | Count on image average | Area on image average |
|---|---|---|---|---|
tassels➔ rectangle | 675 | 3553 | 5.26 | 0.18% |
Images #
Explore every single image in the dataset with respect to the number of annotations of each class it has. Click a row to preview selected image. Sort by any column to find anomalies and edge cases. Use horizontal scroll if the table has many columns for a large number of classes in the dataset.
Object distribution #
Interactive heatmap chart for every class with object distribution shows how many images are in the dataset with a certain number of objects of a specific class. Users can click cell and see the list of all corresponding images.
Class sizes #
The table below gives various size properties of objects for every class. Click a row to see the image with annotations of the selected class. Sort columns to find classes with the smallest or largest objects or understand the size differences between classes.
Class | Object count | Avg area | Max area | Min area | Min height | Min height | Max height | Max height | Avg height | Avg height | Min width | Min width | Max width | Max width |
|---|---|---|---|---|---|---|---|---|---|---|---|---|---|---|
tassels rectangle | 3553 | 0.03% | 0.58% | 0% | 12px | 0.4% | 373px | 12.43% | 67px | 2.24% | 9px | 0.23% | 862px | 21.55% |
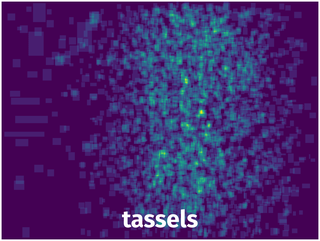
Spatial Heatmap #
The heatmaps below give the spatial distributions of all objects for every class. These visualizations provide insights into the most probable and rare object locations on the image. It helps analyze objects' placements in a dataset.
Objects #
Table contains all 3553 objects. Click a row to preview an image with annotations, and use search or pagination to navigate. Sort columns to find outliers in the dataset.
Object ID ㅤ | Class ㅤ | Image name click row to open | Image size height x width | Height ㅤ | Height ㅤ | Width ㅤ | Width ㅤ | Area ㅤ |
|---|---|---|---|---|---|---|---|---|
1➔ | tassels rectangle | DJI_0524.JPG | 3000 x 4000 | 65px | 2.17% | 72px | 1.8% | 0.04% |
2➔ | tassels rectangle | DJI_0524.JPG | 3000 x 4000 | 62px | 2.07% | 68px | 1.7% | 0.04% |
3➔ | tassels rectangle | DJI_0524.JPG | 3000 x 4000 | 72px | 2.4% | 38px | 0.95% | 0.02% |
4➔ | tassels rectangle | DJI_0821.JPG | 3000 x 4000 | 68px | 2.27% | 46px | 1.15% | 0.03% |
5➔ | tassels rectangle | DJI_0821.JPG | 3000 x 4000 | 54px | 1.8% | 40px | 1% | 0.02% |
6➔ | tassels rectangle | DJI_0821.JPG | 3000 x 4000 | 48px | 1.6% | 34px | 0.85% | 0.01% |
7➔ | tassels rectangle | DJI_0821.JPG | 3000 x 4000 | 44px | 1.47% | 28px | 0.7% | 0.01% |
8➔ | tassels rectangle | DJI_0821.JPG | 3000 x 4000 | 40px | 1.33% | 48px | 1.2% | 0.02% |
9➔ | tassels rectangle | DJI_0821.JPG | 3000 x 4000 | 41px | 1.37% | 27px | 0.68% | 0.01% |
10➔ | tassels rectangle | DJI_0949.JPG | 3000 x 4000 | 39px | 1.3% | 43px | 1.07% | 0.01% |
License #
Citation #
If you make use of the Maize Tassel Detection data, please cite the following reference:
@dataset{shi_yeyin_2021_4922074,
  author       = {Shi, Yeyin and
                  Alzadjali, Aziza and
                  Alali, Mohammed and
                  Veeranampalayam-Sivakumar, Arun-Narenthiran and
                  Deogun, Jitender and
                  Scott, Stephen and
                  Schnable, James},
  title        = {{Maize tassel detection from UAV imagery using deep
                   learning}},
  month        = jun,
  year         = 2021,
  note         = {{<p>There are three folders when you download and
                   unzip the file here named
                   "Maize\_Tassels\_Recognition.zip":</p>  <ul>
                   <li>1\_ReadMe</li>
                   <li>2\_Raw\_RGB\_Images\_Collected\_by\_UAV</li>
                   <li>3\_Labels\_for\_CNN</li> </ul>  <p>In the
                   1\_ReadMe filder, there is a "readme.txt" file with
                   brief descriptions for the labels in the folder
                   3\_Labels\_for\_CNN:</p>  <p>a) xml files are
                   annotated images used to generate the labels, they
                   are used as an input to xml\_to\_csv.py script which
                   is going to generate a csv file.<br> b) The
                   generated csv file is used as an input to generate
                   the tfrecord files using the generate\_tfrecord.py
                   script as shown in below example:<br> \# Create
                   train data:  python generate\_tfrecord.py
                   --csv\_input='path to csv file'
                   --output\_path='path to output tfrecord file'<br>
                   </p> <p>Funding provided by: University of
                   Nebraska-Lincoln<br>Crossref Funder Registry ID:
                   http://dx.doi.org/10.13039/100008114<br>Award
                   Number: A-0000000325</p><p>Funding provided by:
                   U.S. Department of Agriculture<br>Crossref Funder
                   Registry ID:
                   http://dx.doi.org/10.13039/100000199<br>Award
                   Number: 1011130</p>}},
  publisher    = {Zenodo},
  doi          = {10.5061/dryad.r2280gbcg},
  url          = {https://doi.org/10.5061/dryad.r2280gbcg}
}
If you are happy with Dataset Ninja and use provided visualizations and tools in your work, please cite us:
@misc{ visualization-tools-for-maize-tassel-detection-dataset,
  title = { Visualization Tools for Maize Tassel Detection Dataset },
  type = { Computer Vision Tools },
  author = { Dataset Ninja },
  howpublished = { \url{ https://datasetninja.com/maize-tassel-detection } },
  url = { https://datasetninja.com/maize-tassel-detection },
  journal = { Dataset Ninja },
  publisher = { Dataset Ninja },
  year = { 2026 },
  month = { aug },
  note = { visited on 2026-08-02 },
}
Download #
Dataset Maize Tassel Detection can be downloaded in Supervisely format:
As an alternative, it can be downloaded with dataset-tools package:
pip install --upgrade dataset-tools
… using following python code:
import dataset_tools as dtools

dtools.download(dataset='Maize Tassel Detection', dst_dir='~/dataset-ninja/')
Make sure not to overlook the python code example available on the Supervisely Developer Portal. It will give you a clear idea of how to effortlessly work with the downloaded dataset.
The data in original format can be downloaded here.
Disclaimer #
Our gal from the legal dep told us we need to post this:
Dataset Ninja provides visualizations and statistics for some datasets that can be found online and can be downloaded by general audience. Dataset Ninja is not a dataset hosting platform and can only be used for informational purposes. The platform does not claim any rights for the original content, including images, videos, annotations and descriptions. Joint publishing is prohibited.
You take full responsibility when you use datasets presented at Dataset Ninja, as well as other information, including visualizations and statistics we provide. You are in charge of compliance with any dataset license and all other permissions. You are required to navigate datasets homepage and make sure that you can use it. In case of any questions, get in touch with us at hello@datasetninja.com.