

Introduction #
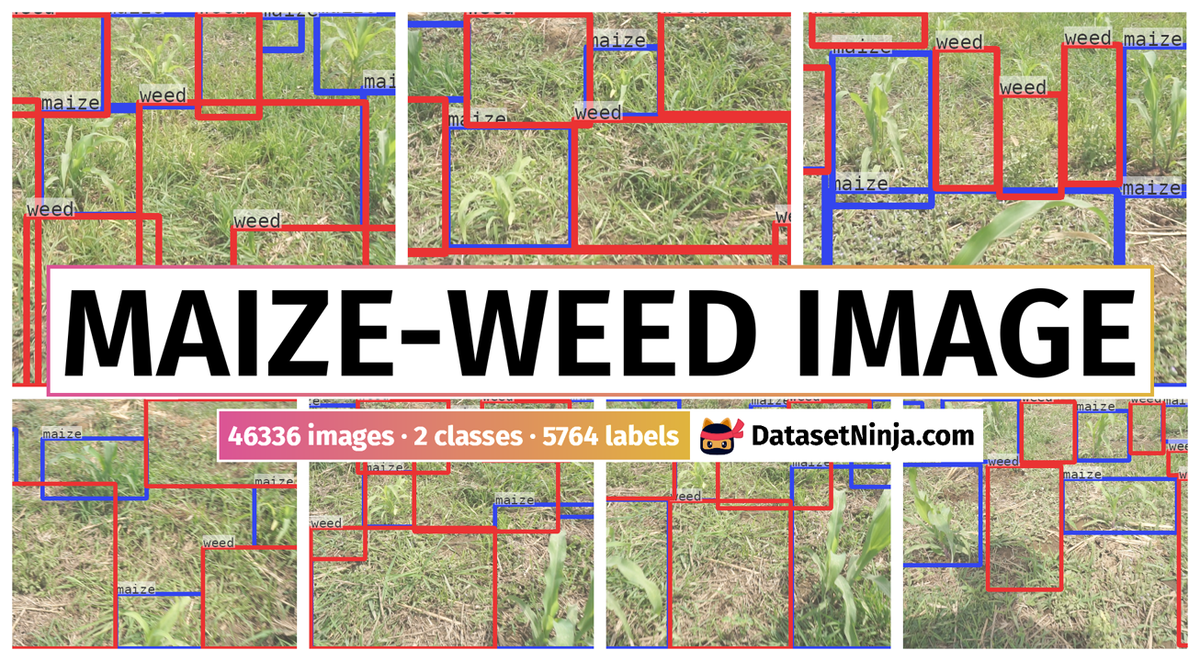
The Maize-Weed Image dataset contains 46336 images capturing 5764 labeled objects categorized into 2 classes: maize and weed. These high-resolution images were taken during weed surveys in both wet_season and dry_season using a digital camera and annotated using Labelmg suite. The dataset is a result of fieldwork across 18 farm locations in North Central Nigeria, part of ongoing research efforts for maize-weed identification in agricultural landscapes.
Please note that this is the second version of the dataset, with an increased number of original images.
Objective
The dataset was acquired locally in Niger State, North Central Nigeria, covering four local government areas. The goal is to localize the dataset in order to meet the urgent demands of the local farmers. Due to the varying types of soil and land in those places, the authors found that different agricultural practices were implemented in the various local government districts that were visited. In addition, a review of literature in paper sources indicated that data of this nature were not widely available; therefore, the authors had to curate a dataset for the public and save it in the public domain for use.
Data Description
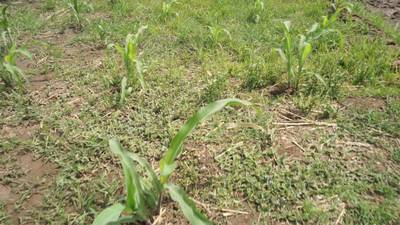
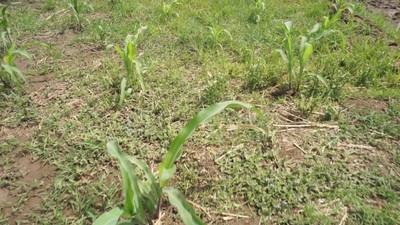
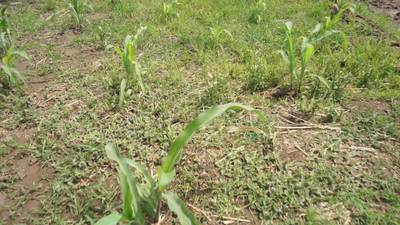
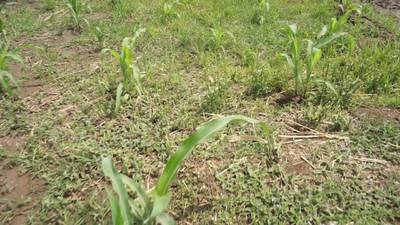
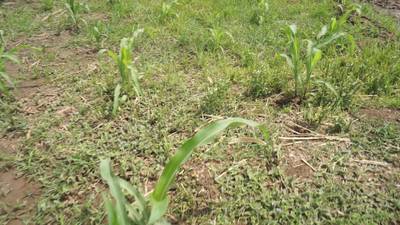
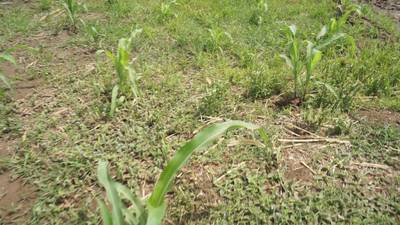
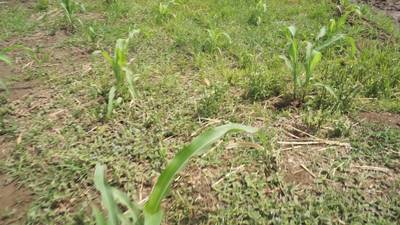
This dataset contains images of maize plants and weed species. The dataset contains 36,874 (46,336 in v2.0) images in total and is stored in four folders: Annotated Maize-Weed Images, Data Description and Questionnaire, Dry Season Maize Weed Images, and Wet Season Maize Weed Images.
The Dry Season contains 18,187 (19,600 in v2.0) images captured during the dry season farm survey. The Wet Season contains 18,187 (26,736 in v2.0) images captured during the wet season farm survey, and the Annotated contains 500 annotated images selected from the Dry Season survey saved in JSON, XML, and txt format. The images of the raw wet and dry seasons were captured using a highresolution digital camera during the Maize-Weed survey carried out on 18 farm locations in the North Central part of Nigeria. In contrast, the annotation of the images was achieved using the Labelmg suite, an open-source annotation tool.
Experimental Design, Materials and Methods
Several farms in four (Bosso, Gbako, Katcha, and Lapai) different Local Government Areas (LGAs) in Niger State, Nigeria were visited. The details of the farms visited and their geographic information are shown in Table 2. A total of 18 farms were visited with the lowest elevation of 76 metres above sea level(masl) and the highest elevation of 225 metres above sea level (masl). Primary data were collected from the respondents during the field visits (survey) with use of structured questionnaire.
Maize-based cropping system farms were surveyed in Bosso, Gbako, Katcha and Lapai LGAs between February and March 2022. A handheld Global Positioning System machine (GPS4300; Ethrex 10 Garmin, Taiwan) was used to record the coordinates of each location, and the data were used to map the surveyed locations.
| Local Government Area | Location | Latitude (⁰N) | Longitude ( ⁰E) | Altitude (m) |
|---|---|---|---|---|
| Bosso | Anguwan-Shaba_01 | 9.53589 | 6.58369 | 225 |
| Bosso | Anguwan-Shaba_02 | 9.53562 | 6.58379 | 214 |
| Gbako | Sabon-Gida_01 | 9.24997 | 6.16158 | 97 |
| Gbako | Sabon-Gida_02 | 9.24835 | 6.16103 | 95 |
| Gbako | Sabon-Gida_03 | 9.24729 | 6.16051 | 94 |
| Gbako | Sabon-Gida_04 | 9.24357 | 6.1626 | 76 |
| Gbako | Sabon-Gida_05 | 9.2445 | 6.16134 | 93 |
| Gbako | Sabon-Gida_06 | 9.25229 | 6.16061 | 90 |
| Gbako | Sabon-Gida_07 | 9.25239 | 6.15988 | 96 |
| Katcha | Katcha_01 | 9.25146 | 6.16168 | 99 |
| Katcha | Katcha_02 | 9.25192 | 6.16192 | 100 |
| Katcha | Katcha_03 | 9.25264 | 6.16187 | 96 |
| Katcha | Katcha_04 | 9.25264 | 6.16187 | 158 |
| Katcha | Katcha_05 | 9.25212 | 6.15733 | 95 |
| Katcha | Katcha_06 | 9.24982 | 6.16652 | 85 |
| Katcha | Katcha_07 | 9.25062 | 6.16691 | 79 |
| Lapai | Lapai GGSS-Day_01 | 9.02059 | 6.57805 | 140 |
| Lapai | Lapai GGSS-Day_02 | 9.01243 | 6.58276 | 146 |
Details of farms visited.
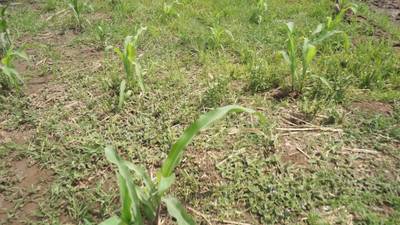
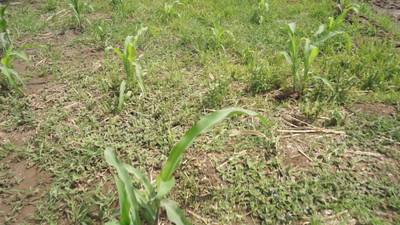
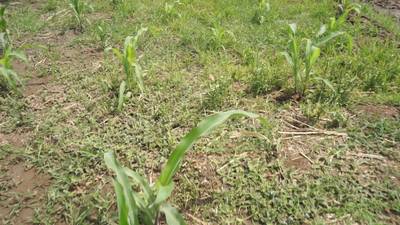
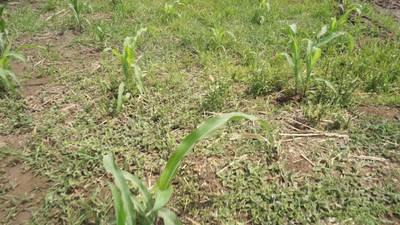
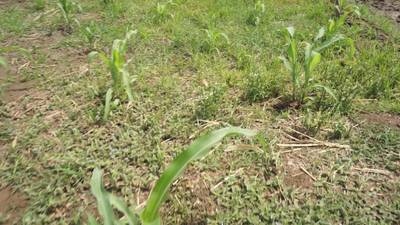
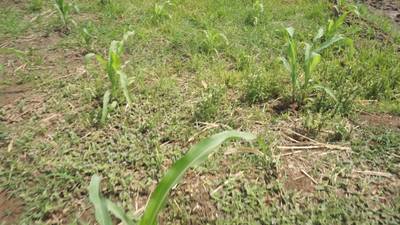
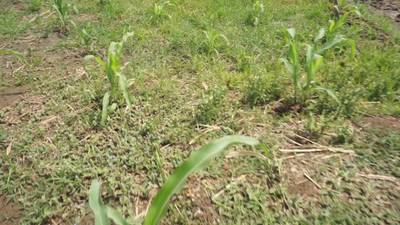
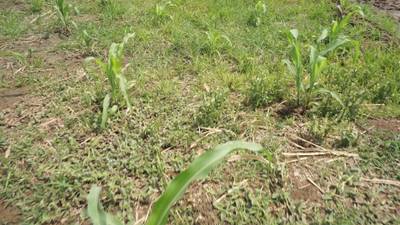
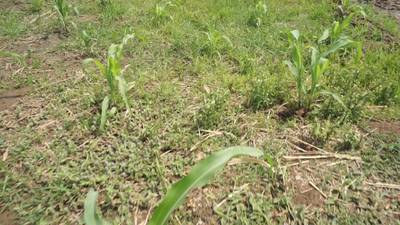
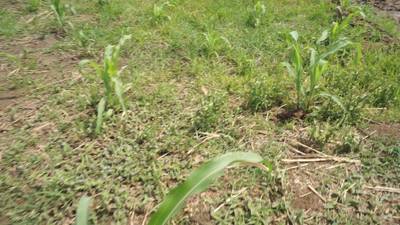
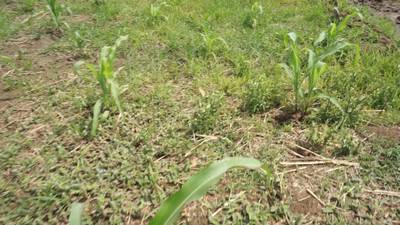
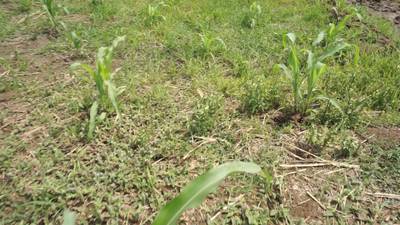
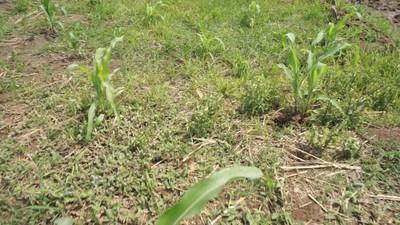
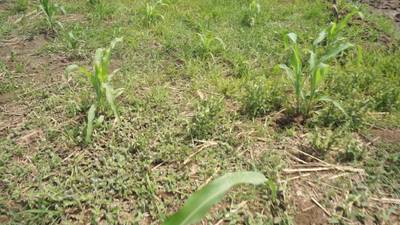
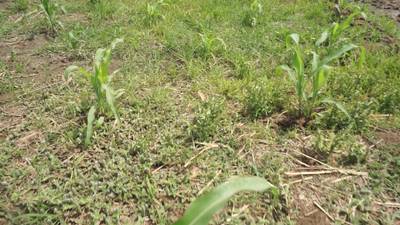
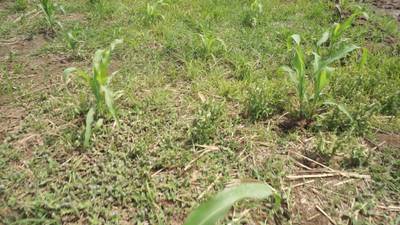
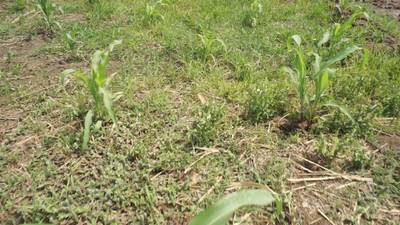
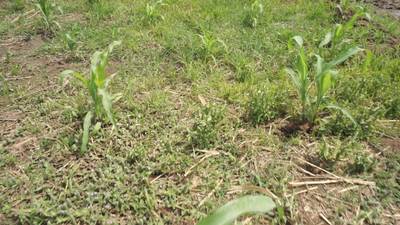
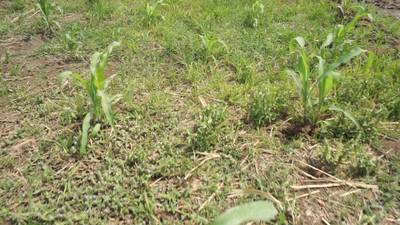
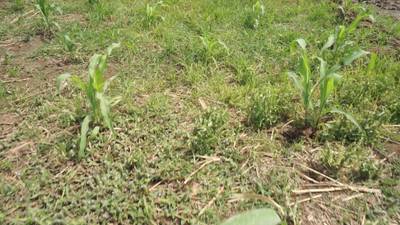
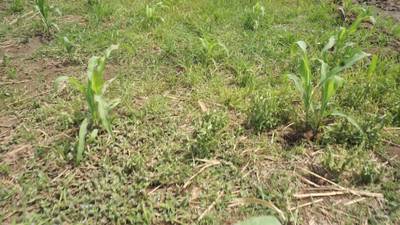
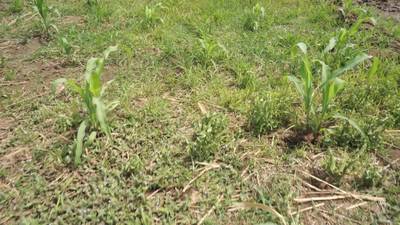
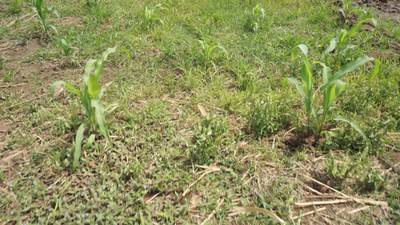
The dataset contains images of maize crops and their accompanying weeds that alongside farm. These images were taken on field trips to 18 different maize farmlands within four Local Government Areas of Niger State, Nigeria, West Africa. The data were collected from irrigated maize fields under traditional maize cultivation practices. Raw data of maize and weeds were captured in situ using a 24.3 MP digital picture camera (Sony A6000). The images and video frames were taken one foot away from the crop, with the camera held at a constant height. The images were acquired in a ’handheld’ manner. This implies that the photographer moved through the farmland while manually holding the camera. This manual data acquisition process was required because the terrain of the farmland and the spacing of the ridges did not allow for the use of a vehicle in which the camera could be mounted. The images were checked individually to ensure they were in focus and the blurry images removed from the dataset. Direct interviews and open discussion with the maize farmers were carried out on the status, perception of weed infestation and methods of weed control, and the need for a technology that can detect weeds and apply herbicide in their fields. This information was obtained from the maize farmers using a guided questionnaire during the survey.
Map of Nigeria showing the Local Government Areas of Niger State surveyed for weeds data capturing.
After data acquisition, the data were filtered to remove noise and outliers from the images. The filtered images were stored in the ‘JPEG’ format, the same as the acquired images to preserve data integrity. Furthermore, the data was annotated with the open-source annotation tool ’LabelImg’ and saved as XML and JSON formats.
 Homepage
 Research Paper
Summary #
Maize-Weed Image v2.0 is a dataset for an object detection task. It is used in the agricultural industry.
The dataset consists of 46336 images with 5764 labeled objects belonging to 2 different classes including maize and weed.
Images in the Maize-Weed Image dataset have bounding box annotations. There are 45836 (99% of the total) unlabeled images (i.e. without annotations). There are no pre-defined train/val/test splits in the dataset. Alternatively, the dataset could be split into 2 seasons: wet_season (26736 images) and dry_season (19600 images). The dataset was released in 2022 by the Federal University of Technology, Nigeria.
Explore #
Maize-Weed Image dataset has 46336 images. Click on one of the examples below or open "Explore" tool anytime you need to view dataset images with annotations. This tool has extended visualization capabilities like zoom, translation, objects table, custom filters and more. Hover the mouse over the images to hide or show annotations.


Class balance #
There are 2 annotation classes in the dataset. Find the general statistics and balances for every class in the table below. Click any row to preview images that have labels of the selected class. Sort by column to find the most rare or prevalent classes.

Class ㅤ | Images ㅤ | Objects ㅤ | Count on image average | Area on image average |
|---|---|---|---|---|
weed➔ rectangle | 500 | 2887 | 5.77 | 55.92% |
maize➔ rectangle | 500 | 2877 | 5.75 | 34.58% |
Co-occurrence matrix #
Co-occurrence matrix is an extremely valuable tool that shows you the images for every pair of classes: how many images have objects of both classes at the same time. If you click any cell, you will see those images. We added the tooltip with an explanation for every cell for your convenience, just hover the mouse over a cell to preview the description.
Images #
Explore every single image in the dataset with respect to the number of annotations of each class it has. Click a row to preview selected image. Sort by any column to find anomalies and edge cases. Use horizontal scroll if the table has many columns for a large number of classes in the dataset.
Object distribution #
Interactive heatmap chart for every class with object distribution shows how many images are in the dataset with a certain number of objects of a specific class. Users can click cell and see the list of all corresponding images.
Class sizes #
The table below gives various size properties of objects for every class. Click a row to see the image with annotations of the selected class. Sort columns to find classes with the smallest or largest objects or understand the size differences between classes.
Class | Object count | Avg area | Max area | Min area | Min height | Min height | Max height | Max height | Avg height | Avg height | Min width | Min width | Max width | Max width |
|---|---|---|---|---|---|---|---|---|---|---|---|---|---|---|
weed rectangle | 2887 | 10.36% | 55.1% | 0.23% | 34px | 3.15% | 1079px | 99.91% | 453px | 41.93% | 47px | 2.45% | 1919px | 99.95% |
maize rectangle | 2877 | 6.07% | 34.68% | 0.32% | 73px | 6.76% | 966px | 89.44% | 319px | 29.5% | 80px | 4.17% | 1056px | 55% |
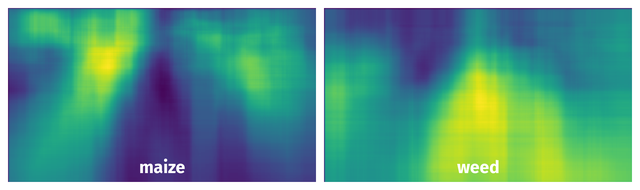
Spatial Heatmap #
The heatmaps below give the spatial distributions of all objects for every class. These visualizations provide insights into the most probable and rare object locations on the image. It helps analyze objects' placements in a dataset.
Objects #
Table contains all 5764 objects. Click a row to preview an image with annotations, and use search or pagination to navigate. Sort columns to find outliers in the dataset.
Object ID ㅤ | Class ㅤ | Image name click row to open | Image size height x width | Height ㅤ | Height ㅤ | Width ㅤ | Width ㅤ | Area ㅤ |
|---|---|---|---|---|---|---|---|---|
1➔ | maize rectangle | C00020878.jpg | 1080 x 1920 | 94px | 8.7% | 365px | 19.01% | 1.65% |
2➔ | maize rectangle | C00020878.jpg | 1080 x 1920 | 536px | 49.63% | 513px | 26.72% | 13.26% |
3➔ | maize rectangle | C00020878.jpg | 1080 x 1920 | 553px | 51.2% | 733px | 38.18% | 19.55% |
4➔ | maize rectangle | C00020878.jpg | 1080 x 1920 | 256px | 23.7% | 136px | 7.08% | 1.68% |
5➔ | weed rectangle | C00020878.jpg | 1080 x 1920 | 343px | 31.76% | 1909px | 99.43% | 31.58% |
6➔ | weed rectangle | C00020878.jpg | 1080 x 1920 | 96px | 8.89% | 1559px | 81.2% | 7.22% |
7➔ | weed rectangle | C00020878.jpg | 1080 x 1920 | 380px | 35.19% | 151px | 7.86% | 2.77% |
8➔ | weed rectangle | C00020878.jpg | 1080 x 1920 | 581px | 53.8% | 283px | 14.74% | 7.93% |
9➔ | maize rectangle | C00020852.jpg | 1080 x 1920 | 667px | 61.76% | 592px | 30.83% | 19.04% |
10➔ | maize rectangle | C00020852.jpg | 1080 x 1920 | 378px | 35% | 403px | 20.99% | 7.35% |
License #
Citation #
If you make use of the Maize-Weed Image data, please cite the following reference:
@article{OLANIYI2023109030,
  title = {Development of maize plant dataset for intelligent recognition and weed control},
  journal = {Data in Brief},
  volume = {47},
  pages = {109030},
  year = {2023},
  issn = {2352-3409},
  doi = {https://doi.org/10.1016/j.dib.2023.109030},
  url = {https://www.sciencedirect.com/science/article/pii/S2352340923001488},
  author = {Olayemi Mikail Olaniyi and Muhammadu Tajudeen Salaudeen and Emmanuel Daniya and Ibrahim Mohammed Abdullahi and Taliha Abiodun Folorunso and Jibril Abdullahi Bala and Bello Kontagora Nuhu and Adeyinka Peace Adedigba and Blessing Israel Oluwole and Abdullah Oreoluwa Bankole and Odunayo Moses Macarthy},
}
If you are happy with Dataset Ninja and use provided visualizations and tools in your work, please cite us:
@misc{ visualization-tools-for-maize-weed-image-dataset,
  title = { Visualization Tools for Maize-Weed Image Dataset },
  type = { Computer Vision Tools },
  author = { Dataset Ninja },
  howpublished = { \url{ https://datasetninja.com/maize-weed-image } },
  url = { https://datasetninja.com/maize-weed-image },
  journal = { Dataset Ninja },
  publisher = { Dataset Ninja },
  year = { 2026 },
  month = { jul },
  note = { visited on 2026-07-29 },
}
Download #
Dataset Maize-Weed Image can be downloaded in Supervisely format:
As an alternative, it can be downloaded with dataset-tools package:
pip install --upgrade dataset-tools
… using following python code:
import dataset_tools as dtools

dtools.download(dataset='Maize-Weed Image', dst_dir='~/dataset-ninja/')
Make sure not to overlook the python code example available on the Supervisely Developer Portal. It will give you a clear idea of how to effortlessly work with the downloaded dataset.
The data in original format can be downloaded here.
Disclaimer #
Our gal from the legal dep told us we need to post this:
Dataset Ninja provides visualizations and statistics for some datasets that can be found online and can be downloaded by general audience. Dataset Ninja is not a dataset hosting platform and can only be used for informational purposes. The platform does not claim any rights for the original content, including images, videos, annotations and descriptions. Joint publishing is prohibited.
You take full responsibility when you use datasets presented at Dataset Ninja, as well as other information, including visualizations and statistics we provide. You are in charge of compliance with any dataset license and all other permissions. You are required to navigate datasets homepage and make sure that you can use it. In case of any questions, get in touch with us at hello@datasetninja.com.