Introduction #
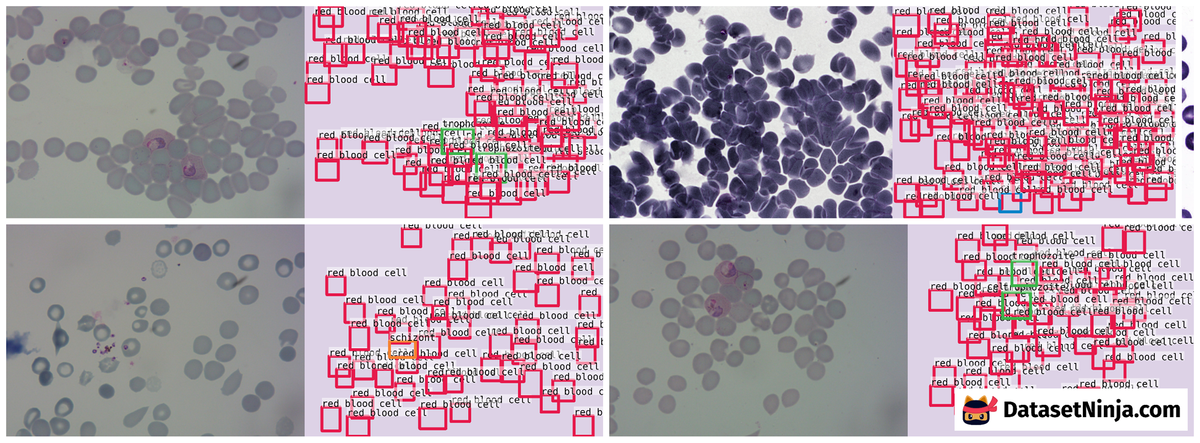
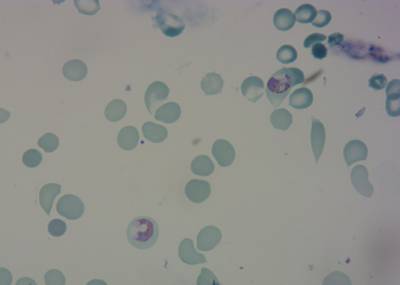
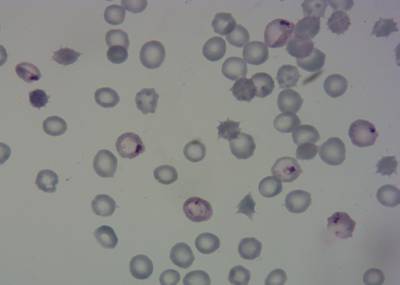
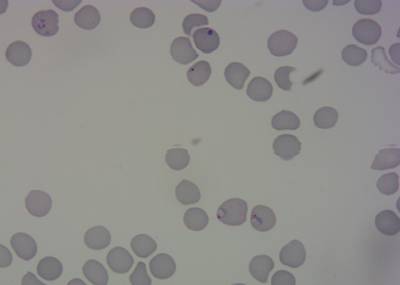
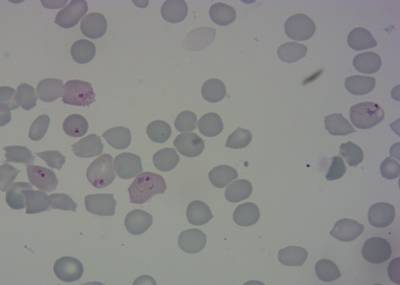
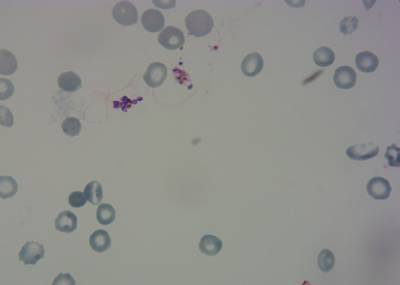
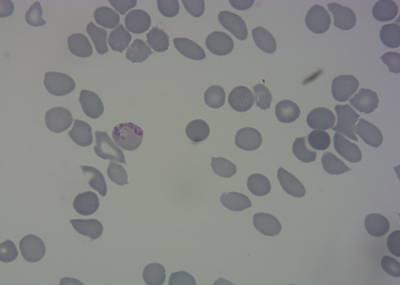
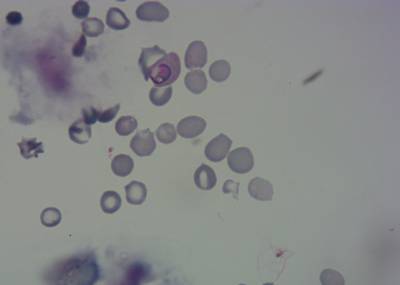
The authors of the P. Vivax (Malaria) Infected Human Blood Smears dataset address the ongoing threat of malaria, a disease caused by Plasmodium parasites that affects millions globally, causing substantial mortality. They highlight Plasmodium falciparum and Plasmodium vivax as the main species affecting humans. All non-RBC objects were annotated (boxed and labeled) by an expert malaria researcher. Seven labels were used to cover possible cell types of interest: red blood cells (RBC), leukocytes, gametocytes, rings, trophozoites, and schizonts.
In the context of malaria and other microbial infections, manual examination of thick and thin blood smears by skilled microscopists remains the standard approach for detecting parasites and determining their stages. This method is favoured due to its cost-effectiveness and adaptability, despite its low throughput and susceptibility to human bias. While automatic counting software exists, its usage is limited due to the complexities presented by variations in brightfield microscopy images. The authors emphasize the potential benefits of a robust automatic counting and cell classification solution, which could yield faster and more accurate quantitative results devoid of human variability. This advancement could enhance drug target characterization and patient reaction quantification.
Prior endeavours to automate malaria identification and quantification have faced challenges in replication, comparison, and extension, often due to the lack of shared image sets and standardized metrics for reporting outcomes. To address these issues, the authors introduce a dataset that encompasses two categories of uninfected cells (red blood cells and leukocytes) and four categories of infected cells (gametocytes, rings, trophozoites, and schizonts). Annotators were permitted to label certain cells as difficult if their classification wasn’t clearly aligned with any specific cell class. The dataset is characterized by a substantial imbalance between uninfected red blood cells, uninfected leukocytes, and infected cells, with the former accounting for over 95% of the total.
Each cell in the dataset is associated with a class label and a set of bounding box coordinates. Infected cells were classified according to their developmental stage by a malaria researcher.
The data was derived from samples of P. vivax infected patients obtained from various labs in Manaus, Brazil, and Thailand. The dataset was divided into training and validation subsets, with samples from Manaus and Thailand being employed for this purpose. Blood smears stained with Giemsa reagent were used to allow malaria researchers to examine infected cells and identify their stages. The dataset’s annotations were provided by an expert malaria researcher and encompassed seven labels to represent distinct cell types. The class imbalance was evident, with red blood cells constituting the majority, around 97% of the 100,000 cells in total.
Note, that in the original download data, only train and test image sets are available.
Summary #
P. Vivax (Malaria) Infected Human Blood Smears is a dataset for an object detection task. It is used in the biomedical research.
The dataset consists of 1328 images with 86035 labeled objects belonging to 7 different classes including red blood cell, trophozoite, difficult, and other: ring, schizont, gametocyte, and leukocyte.
Images in the P. Vivax (Malaria) Infected Human Blood Smears dataset have bounding box annotations. All images are labeled (i.e. with annotations). There are 2 splits in the dataset: training (1208 images) and test (120 images). The dataset was released in 2019 by the Broad Institute, UK.
Here is the visualized example grid with annotations:
Explore #
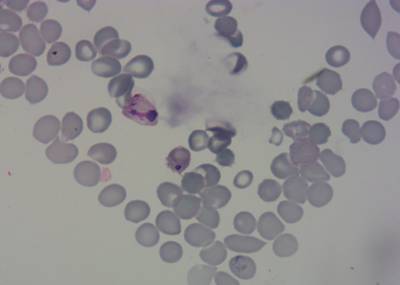
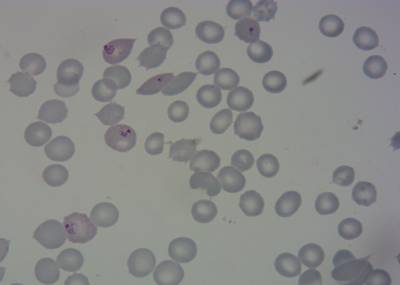
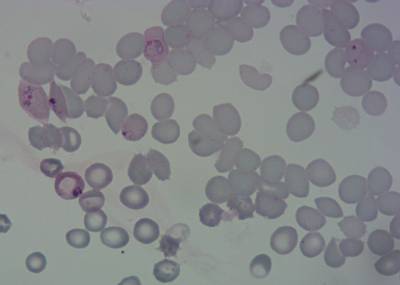
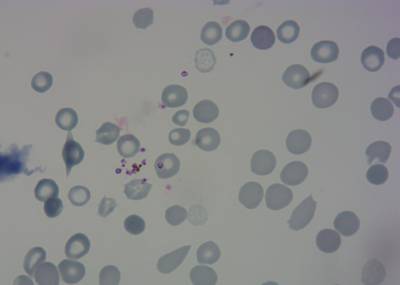
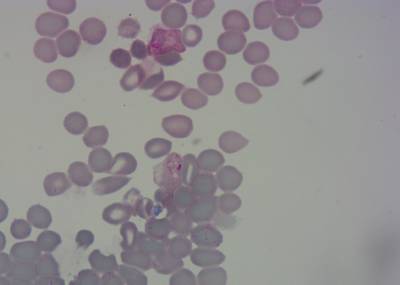
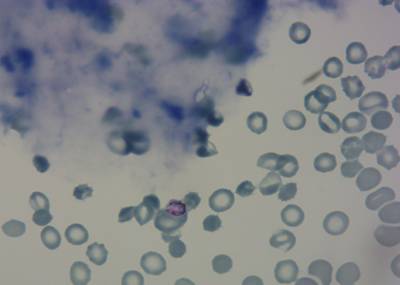
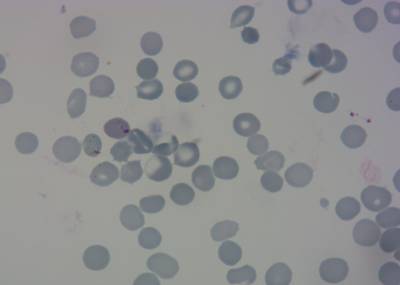
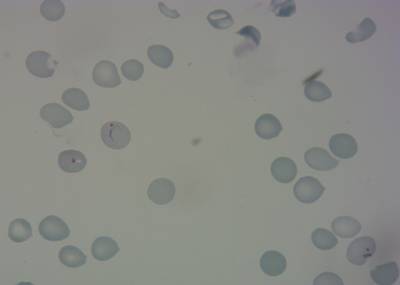
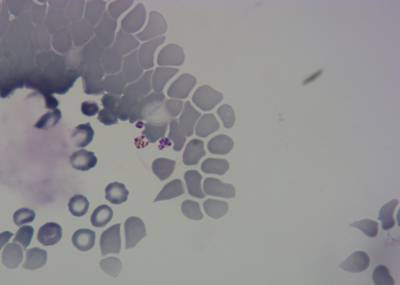
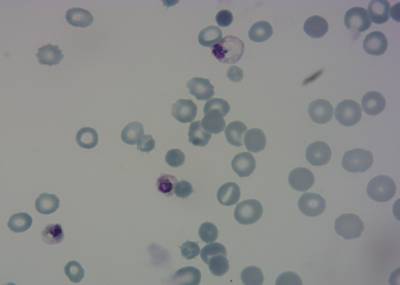
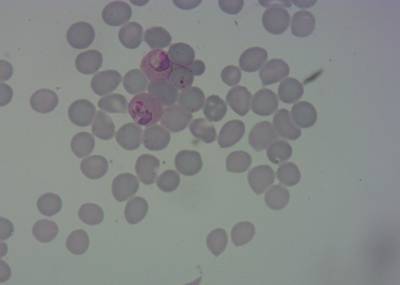
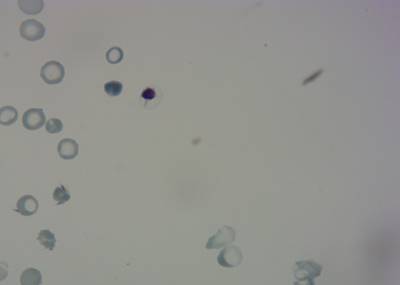
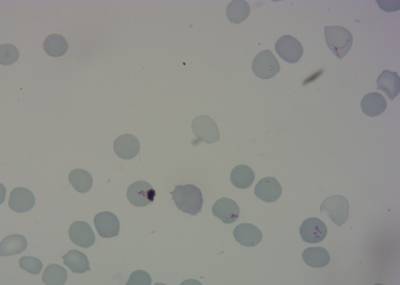
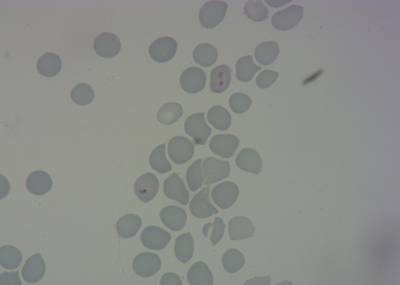
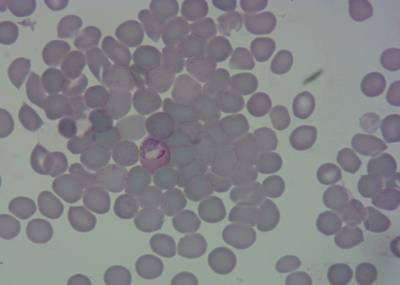
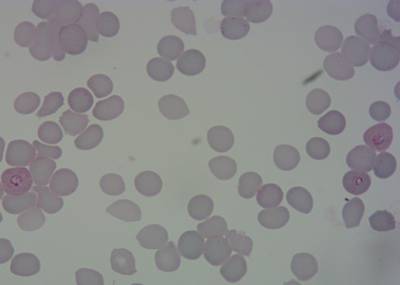
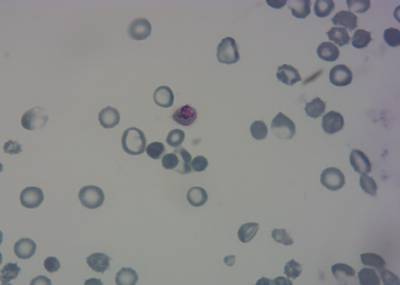
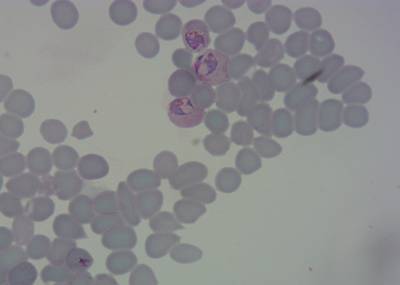
P. Vivax (Malaria) Infected Human Blood Smears dataset has 1328 images. Click on one of the examples below or open "Explore" tool anytime you need to view dataset images with annotations. This tool has extended visualization capabilities like zoom, translation, objects table, custom filters and more. Hover the mouse over the images to hide or show annotations.






























Class balance #
There are 7 annotation classes in the dataset. Find the general statistics and balances for every class in the table below. Click any row to preview images that have labels of the selected class. Sort by column to find the most rare or prevalent classes.
Class ㅤ | Images ㅤ | Objects ㅤ | Count on image average | Area on image average |
|---|---|---|---|---|
red blood cell➔ rectangle | 1328 | 83034 | 62.53 | 34.68% |
trophozoite➔ rectangle | 655 | 1584 | 2.42 | 2.28% |
difficult➔ rectangle | 347 | 446 | 1.29 | 1.25% |
ring➔ rectangle | 301 | 522 | 1.73 | 1.4% |
schizont➔ rectangle | 166 | 190 | 1.14 | 1.21% |
gametocyte➔ rectangle | 147 | 156 | 1.06 | 0.98% |
leukocyte➔ rectangle | 94 | 103 | 1.1 | 0.96% |
Co-occurrence matrix #
Co-occurrence matrix is an extremely valuable tool that shows you the images for every pair of classes: how many images have objects of both classes at the same time. If you click any cell, you will see those images. We added the tooltip with an explanation for every cell for your convenience, just hover the mouse over a cell to preview the description.
Images #
Explore every single image in the dataset with respect to the number of annotations of each class it has. Click a row to preview selected image. Sort by any column to find anomalies and edge cases. Use horizontal scroll if the table has many columns for a large number of classes in the dataset.
Class sizes #
The table below gives various size properties of objects for every class. Click a row to see the image with annotations of the selected class. Sort columns to find classes with the smallest or largest objects or understand the size differences between classes.
Class | Object count | Avg area | Max area | Min area | Min height | Min height | Max height | Max height | Avg height | Avg height | Min width | Min width | Max width | Max width |
|---|---|---|---|---|---|---|---|---|---|---|---|---|---|---|
red blood cell rectangle | 83034 | 0.62% | 2.06% | 0.21% | 54px | 4.5% | 228px | 18.67% | 110px | 9.06% | 55px | 3.44% | 310px | 15.95% |
trophozoite rectangle | 1584 | 0.95% | 2.73% | 0.33% | 64px | 5.33% | 256px | 21.33% | 137px | 11.26% | 59px | 3.69% | 297px | 15.28% |
ring rectangle | 522 | 0.81% | 1.81% | 0.41% | 83px | 6.36% | 241px | 20.08% | 130px | 10.33% | 77px | 4.81% | 240px | 12.35% |
difficult rectangle | 446 | 0.98% | 1.78% | 0.31% | 79px | 6.51% | 253px | 18.29% | 137px | 11.37% | 75px | 4.69% | 241px | 15.06% |
schizont rectangle | 190 | 1.06% | 1.74% | 0.26% | 82px | 6% | 218px | 18.17% | 144px | 11.93% | 83px | 4.27% | 212px | 13.25% |
gametocyte rectangle | 156 | 0.92% | 1.4% | 0.43% | 85px | 7.08% | 195px | 16.25% | 134px | 11.06% | 82px | 5.12% | 210px | 11.56% |
leukocyte rectangle | 103 | 0.87% | 2.23% | 0.24% | 67px | 5.58% | 213px | 17.75% | 125px | 10.44% | 70px | 4.38% | 251px | 15.69% |
Spatial Heatmap #
The heatmaps below give the spatial distributions of all objects for every class. These visualizations provide insights into the most probable and rare object locations on the image. It helps analyze objects' placements in a dataset.

Objects #
Table contains all 86035 objects. Click a row to preview an image with annotations, and use search or pagination to navigate. Sort columns to find outliers in the dataset.
Object ID ㅤ | Class ㅤ | Image name click row to open | Image size height x width | Height ㅤ | Height ㅤ | Width ㅤ | Width ㅤ | Area ㅤ |
|---|---|---|---|---|---|---|---|---|
1➔ | red blood cell rectangle | 96287315-87a1-4045-9e16-119e045bf12a.jpg | 1383 x 1944 | 129px | 9.33% | 142px | 7.3% | 0.68% |
2➔ | red blood cell rectangle | 96287315-87a1-4045-9e16-119e045bf12a.jpg | 1383 x 1944 | 130px | 9.4% | 133px | 6.84% | 0.64% |
3➔ | red blood cell rectangle | 96287315-87a1-4045-9e16-119e045bf12a.jpg | 1383 x 1944 | 130px | 9.4% | 143px | 7.36% | 0.69% |
4➔ | red blood cell rectangle | 96287315-87a1-4045-9e16-119e045bf12a.jpg | 1383 x 1944 | 130px | 9.4% | 127px | 6.53% | 0.61% |
5➔ | red blood cell rectangle | 96287315-87a1-4045-9e16-119e045bf12a.jpg | 1383 x 1944 | 143px | 10.34% | 130px | 6.69% | 0.69% |
6➔ | red blood cell rectangle | 96287315-87a1-4045-9e16-119e045bf12a.jpg | 1383 x 1944 | 123px | 8.89% | 139px | 7.15% | 0.64% |
7➔ | red blood cell rectangle | 96287315-87a1-4045-9e16-119e045bf12a.jpg | 1383 x 1944 | 114px | 8.24% | 126px | 6.48% | 0.53% |
8➔ | red blood cell rectangle | 96287315-87a1-4045-9e16-119e045bf12a.jpg | 1383 x 1944 | 123px | 8.89% | 139px | 7.15% | 0.64% |
9➔ | red blood cell rectangle | 96287315-87a1-4045-9e16-119e045bf12a.jpg | 1383 x 1944 | 122px | 8.82% | 124px | 6.38% | 0.56% |
10➔ | red blood cell rectangle | 96287315-87a1-4045-9e16-119e045bf12a.jpg | 1383 x 1944 | 119px | 8.6% | 120px | 6.17% | 0.53% |
License #
P. Vivax (Mlaria) Infected Human Blood Smears is under CC BY-NC-SA 3.0 IGO license.
Citation #
If you make use of the Malaria Bounding Boxes data, please cite the following reference:
We used image set BBBC041v1, available from the Broad Bioimage Benchmark Collection [Ljosa et al., Nature Methods, 2012].
If you are happy with Dataset Ninja and use provided visualizations and tools in your work, please cite us:
@misc{ visualization-tools-for-malaria-bounding-boxes-dataset,
  title = { Visualization Tools for P. Vivax (Malaria) Infected Human Blood Smears Dataset },
  type = { Computer Vision Tools },
  author = { Dataset Ninja },
  howpublished = { \url{ https://datasetninja.com/malaria-bounding-boxes } },
  url = { https://datasetninja.com/malaria-bounding-boxes },
  journal = { Dataset Ninja },
  publisher = { Dataset Ninja },
  year = { 2026 },
  month = { feb },
  note = { visited on 2026-02-20 },
}
Download #
Dataset P. Vivax (Malaria) Infected Human Blood Smears can be downloaded in Supervisely format:
As an alternative, it can be downloaded with dataset-tools package:
pip install --upgrade dataset-tools
… using following python code:
import dataset_tools as dtools

dtools.download(dataset='P. Vivax (Malaria) Infected Human Blood Smears', dst_dir='~/dataset-ninja/')
Make sure not to overlook the python code example available on the Supervisely Developer Portal. It will give you a clear idea of how to effortlessly work with the downloaded dataset.
The data in original format can be downloaded here.
Disclaimer #
Our gal from the legal dep told us we need to post this:
Dataset Ninja provides visualizations and statistics for some datasets that can be found online and can be downloaded by general audience. Dataset Ninja is not a dataset hosting platform and can only be used for informational purposes. The platform does not claim any rights for the original content, including images, videos, annotations and descriptions. Joint publishing is prohibited.
You take full responsibility when you use datasets presented at Dataset Ninja, as well as other information, including visualizations and statistics we provide. You are in charge of compliance with any dataset license and all other permissions. You are required to navigate datasets homepage and make sure that you can use it. In case of any questions, get in touch with us at hello@datasetninja.com.


