Introduction #
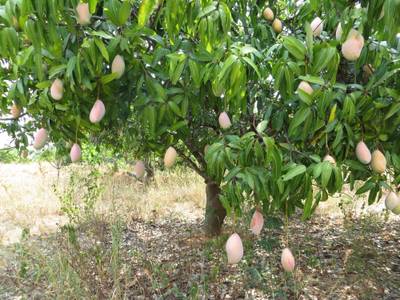
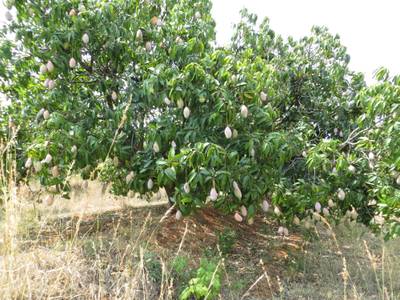
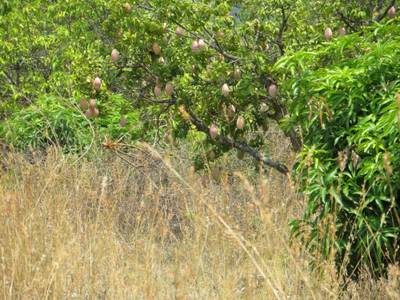
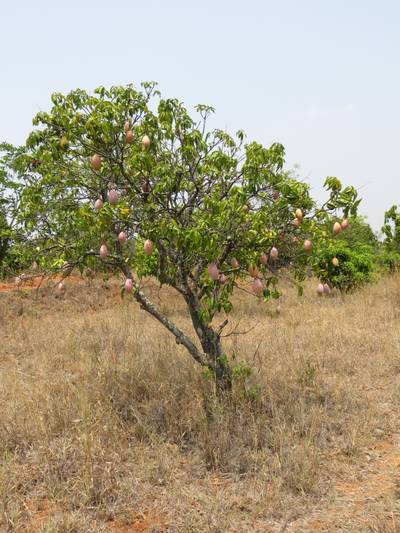
In the pursuit of enhancing mango yield estimation, the authors of the The MangoNet Semantic Dataset introduce a method for detecting and counting mangoes within RGB images. The dataset contains 11,096 image patches, each sized at 200×200 pixels, extracted from a pool of 40 images. Testing is subsequently conducted on 1500 image patches generated from four distinct test images. These images are sourced from a mango orchard during the pre-harvest stage, under open field conditions. The proposed methodology leverages MangoNet, a deep convolutional neural network architecture designed for mango detection through semantic segmentation.
India, as the world’s foremost mango producer, contributes to over 52% of the global production, totaling around 23 million metric tonnes. A significant portion of these mangoes, approximately 30%, is sold to pre-harvest contractors. The value of this crop is contingent upon accurate yield estimation, a task currently executed manually. Manual yield estimation involves sampling blocks within the mango orchards, often in conditions characterized by heat and humidity, common to tropical climates where mangoes thrive. This manual process imposes limitations on the accuracy of orchard assessment, rendering it labor-intensive, time-consuming, error-prone, and subject to considerable variability.
Data Acquisition
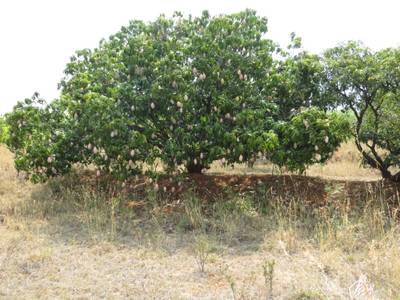
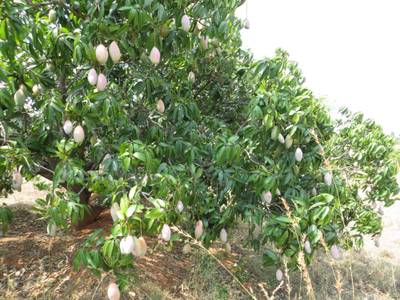
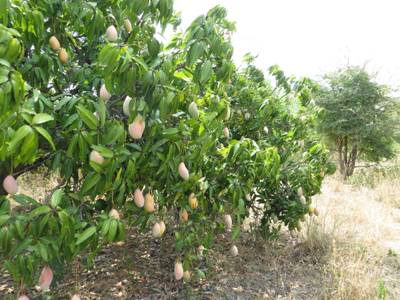
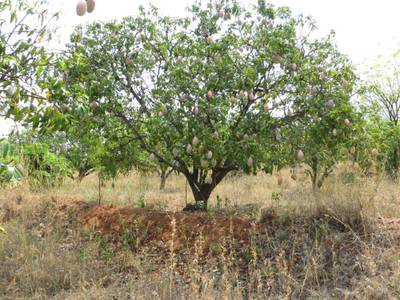
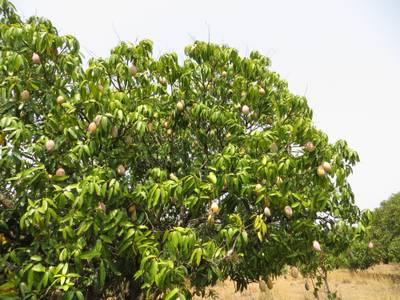
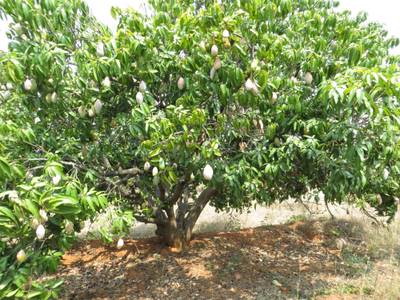
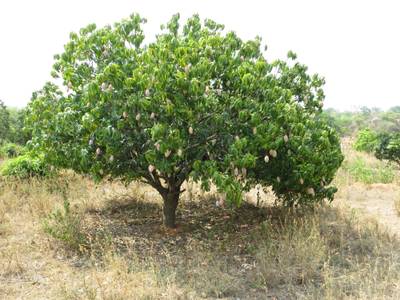
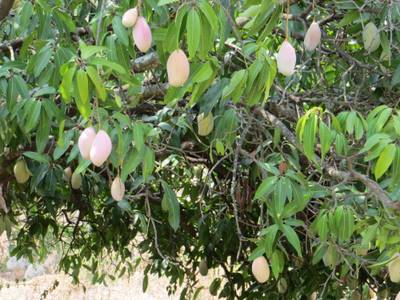
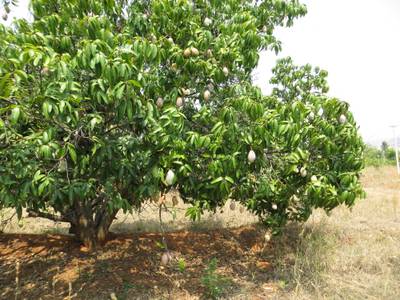
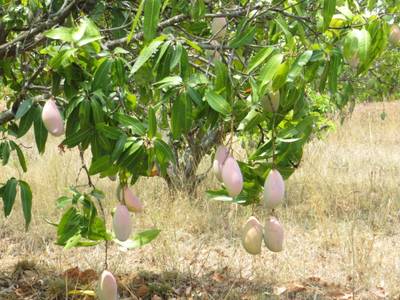
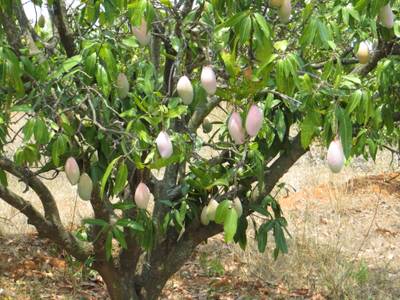
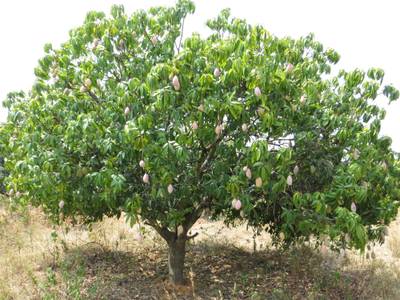
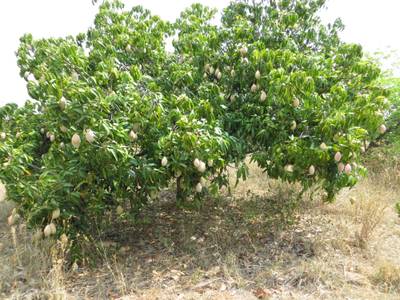
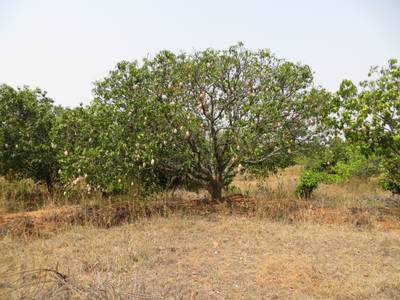
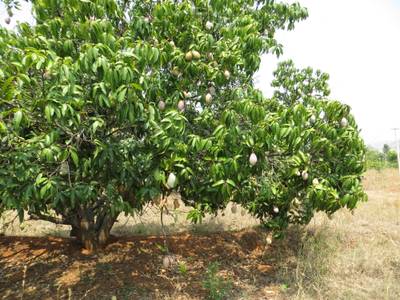
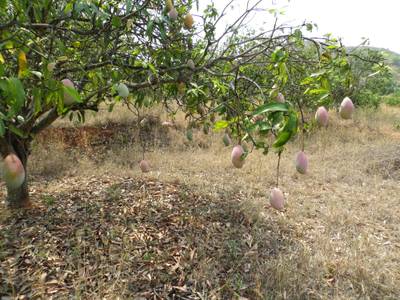
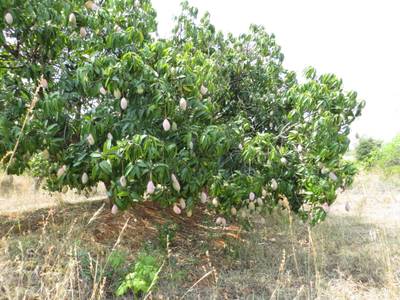
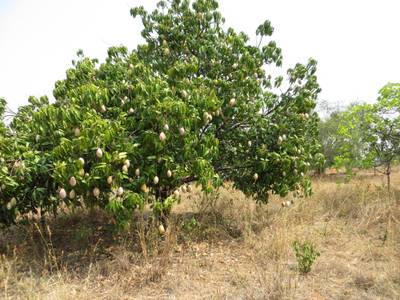
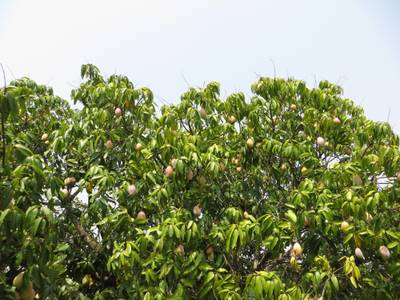
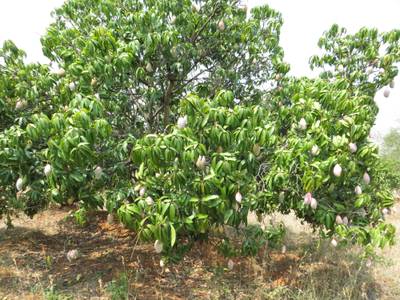
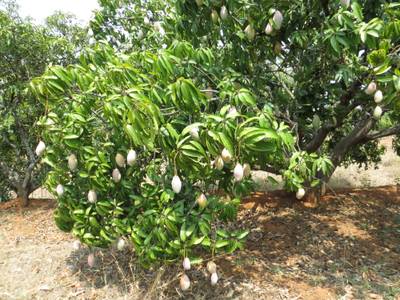
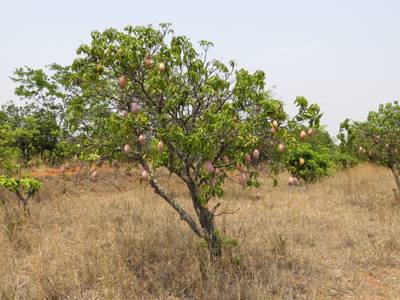
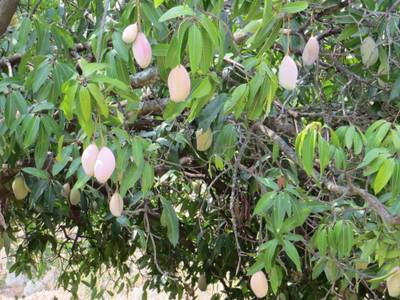
The dataset includes images of mango trees, featuring mangoes ready for harvest within a week. These images were captured using an RGB camera with spatial resolution. The acquisition took place during a bright afternoon in April, between 1:00 pm and 3:00 pm, amid tropical summer conditions. Images that adequately represented mangoes were selected for subsequent analysis. The experiment site is a mango orchard located in Mudimadagu village, situated at Latitude 13.56N and Longitude 78.36E within the Rayalpad sub-division of the Srinivaspur taluk. This region is renowned for mango cultivation within the southeastern part of the Indian peninsula.
Ground truth data was meticulously generated using an open-source image editing tool. Annotation was conducted for binary classification, distinguishing between mango and non-mango classes. Mango pixels were distinctly marked in green (Note, that in DatasetNinja its color has been changed to magenta), while non-mango regions were designated in black. Each mango pixel group was enclosed within an annotated box, and each box exclusively contained one mango. The annotated box coordinates played a crucial role in evaluating mango detection and counting.
Summary #
The MangoNet Semantic Dataset is a dataset for instance segmentation, semantic segmentation, and object detection tasks. It is used in the agricultural industry.
The dataset consists of 49 images with 6799 labeled objects belonging to 1 single class (mango).
Images in the MangoNet dataset have pixel-level instance segmentation annotations. Due to the nature of the instance segmentation task, it can be automatically transformed into a semantic segmentation (only one mask for every class) or object detection (bounding boxes for every object) tasks. All images are labeled (i.e. with annotations). There are 2 splits in the dataset: train_data (45 images) and test_data (4 images). The dataset was released in 2018 by the Indian Institute of Science and Birla Institute of Technology and Science, India.
Here is the visualized example grid with animated annotations:
Explore #
MangoNet dataset has 49 images. Click on one of the examples below or open "Explore" tool anytime you need to view dataset images with annotations. This tool has extended visualization capabilities like zoom, translation, objects table, custom filters and more. Hover the mouse over the images to hide or show annotations.






























Class balance #
There are 1 annotation classes in the dataset. Find the general statistics and balances for every class in the table below. Click any row to preview images that have labels of the selected class. Sort by column to find the most rare or prevalent classes.
Class ㅤ | Images ㅤ | Objects ㅤ | Count on image average | Area on image average |
|---|---|---|---|---|
mango➔ mask | 49 | 6799 | 138.76 | 3.4% |
Images #
Explore every single image in the dataset with respect to the number of annotations of each class it has. Click a row to preview selected image. Sort by any column to find anomalies and edge cases. Use horizontal scroll if the table has many columns for a large number of classes in the dataset.
Class sizes #
The table below gives various size properties of objects for every class. Click a row to see the image with annotations of the selected class. Sort columns to find classes with the smallest or largest objects or understand the size differences between classes.
Class | Object count | Avg area | Max area | Min area | Min height | Min height | Max height | Max height | Avg height | Avg height | Min width | Min width | Max width | Max width |
|---|---|---|---|---|---|---|---|---|---|---|---|---|---|---|
mango mask | 6799 | 0.02% | 1.06% | 0% | 7px | 0.23% | 3000px | 100% | 67px | 2.21% | 7px | 0.17% | 4000px | 100% |
Spatial Heatmap #
The heatmaps below give the spatial distributions of all objects for every class. These visualizations provide insights into the most probable and rare object locations on the image. It helps analyze objects' placements in a dataset.

Objects #
Table contains all 6799 objects. Click a row to preview an image with annotations, and use search or pagination to navigate. Sort columns to find outliers in the dataset.
Object ID ㅤ | Class ㅤ | Image name click row to open | Image size height x width | Height ㅤ | Height ㅤ | Width ㅤ | Width ㅤ | Area ㅤ |
|---|---|---|---|---|---|---|---|---|
1➔ | mango mask | IMG_0150.JPG | 3000 x 4000 | 61px | 2.03% | 99px | 2.48% | 0.04% |
2➔ | mango mask | IMG_0150.JPG | 3000 x 4000 | 152px | 5.07% | 78px | 1.95% | 0.07% |
3➔ | mango mask | IMG_0150.JPG | 3000 x 4000 | 104px | 3.47% | 68px | 1.7% | 0.04% |
4➔ | mango mask | IMG_0150.JPG | 3000 x 4000 | 86px | 2.87% | 55px | 1.38% | 0.02% |
5➔ | mango mask | IMG_0150.JPG | 3000 x 4000 | 149px | 4.97% | 70px | 1.75% | 0.07% |
6➔ | mango mask | IMG_0150.JPG | 3000 x 4000 | 39px | 1.3% | 44px | 1.1% | 0.01% |
7➔ | mango mask | IMG_0150.JPG | 3000 x 4000 | 270px | 9% | 184px | 4.6% | 0.21% |
8➔ | mango mask | IMG_0150.JPG | 3000 x 4000 | 31px | 1.03% | 36px | 0.9% | 0.01% |
9➔ | mango mask | IMG_0150.JPG | 3000 x 4000 | 102px | 3.4% | 57px | 1.43% | 0.03% |
10➔ | mango mask | IMG_0150.JPG | 3000 x 4000 | 64px | 2.13% | 28px | 0.7% | 0.01% |
License #
Citation #
If you make use of the MangoNet data, please cite the following reference:
@article{KESTUR201959,
  title = {MangoNet: A deep semantic segmentation architecture for a method to detect and count mangoes in an open orchard},
  journal = {Engineering Applications of Artificial Intelligence},
  volume = {77},
  pages = {59-69},
  year = {2019},
  issn = {0952-1976},
  doi = {https://doi.org/10.1016/j.engappai.2018.09.011},
  url = {https://www.sciencedirect.com/science/article/pii/S0952197618301970},
  author = {Ramesh Kestur and Avadesh Meduri and Omkar Narasipura},
  keywords = {Deep learning, Semantic segmentation, Object detection, Mango detection, Convolutional neural networks, Fully convolutional networks},
  abstract = {This work presents a method for detection and counting of mangoes in RGB images for further yield estimation. The RGB images are acquired in open field conditions from a mango orchard in the pre-harvest stage. The proposed method uses MangoNet, a deep convolutional neural network based architecture for mango detection using semantic segmentation. Further, mango objects are detected in the semantic segmented output using contour based connected object detection. The MangoNet is trained using 11,096 image patches of size 200×200 obtained from 40 images. Testing was carried out on 1500 image patches generated from 4 test images. The results are analyzed for performance of segmentation and detection of mangoes. Results are analyzed using the precision, recall, F1 parameters derived from contingency matrix. Results demonstrate the robustness of detection for a multitude of factors such as scale, occlusion, distance and illumination conditions, characteristic to open field conditions. The performance of the MangoNet is compared with FCN variant architectures trained on the same data. MangoNet outperforms its variant architectures.}
}
If you are happy with Dataset Ninja and use provided visualizations and tools in your work, please cite us:
@misc{ visualization-tools-for-mangonet-semantic-dataset-dataset,
  title = { Visualization Tools for MangoNet Dataset },
  type = { Computer Vision Tools },
  author = { Dataset Ninja },
  howpublished = { \url{ https://datasetninja.com/mangonet-semantic-dataset } },
  url = { https://datasetninja.com/mangonet-semantic-dataset },
  journal = { Dataset Ninja },
  publisher = { Dataset Ninja },
  year = { 2026 },
  month = { feb },
  note = { visited on 2026-02-04 },
}
Download #
Dataset MangoNet can be downloaded in Supervisely format:
As an alternative, it can be downloaded with dataset-tools package:
pip install --upgrade dataset-tools
… using following python code:
import dataset_tools as dtools

dtools.download(dataset='MangoNet', dst_dir='~/dataset-ninja/')
Make sure not to overlook the python code example available on the Supervisely Developer Portal. It will give you a clear idea of how to effortlessly work with the downloaded dataset.
The data in original format can be downloaded here.
Disclaimer #
Our gal from the legal dep told us we need to post this:
Dataset Ninja provides visualizations and statistics for some datasets that can be found online and can be downloaded by general audience. Dataset Ninja is not a dataset hosting platform and can only be used for informational purposes. The platform does not claim any rights for the original content, including images, videos, annotations and descriptions. Joint publishing is prohibited.
You take full responsibility when you use datasets presented at Dataset Ninja, as well as other information, including visualizations and statistics we provide. You are in charge of compliance with any dataset license and all other permissions. You are required to navigate datasets homepage and make sure that you can use it. In case of any questions, get in touch with us at hello@datasetninja.com.


