

Introduction #
The Mapillary Vistas Dataset is a substantial, street-level image dataset containing 25,000 high-resolution images annotated across 124 classes (70 instance-specific, 46 stuff, 8 void or crowd). Annotation adopts a dense, fine-grained style using polygons to delineate individual objects. The dataset, authored by the dataset creators, is notably larger, by a factor of 5, than the combined fine annotations in Cityscapes. It encompasses images captured worldwide, encompassing diverse weather, seasonal, and daytime conditions. The images are sourced from various devices such as mobile phones, tablets, action cameras, professional capturing rigs, and different experienced photographers, thus embracing diversity, detail richness, and global coverage.
The default benchmark tasks defined by the authors are semantic image segmentation and instance-specific image segmentation, with the intent of advancing state-of-the-art methods for understanding road scenes visually. The dataset is built upon images extracted from www.mapillary.com, a community-led platform for visualizing the world through street-level photos. Anyone can contribute photos of various places, and the data is available under a CC-BY-SA license agreement.
Illustration of number of labeled instances per category and corresponding macro- and root-level class (v1.2)
Image and Category Selection
In order to accept an image for the semantic annotation process, several criteria have to be met. First, the image resolution has to be at least full HD, i.e., a minimum width/height of 1920x1080 was imposed. Additionally, approximately 90% of the images should be selected from road/sidewalk views in urban areas, and the remaining ones from highways, rural areas, and off-road. The database was queried in a way to randomly present potential candidates to a human for further evaluation and selection. Images with strong wide-angle views or 360° images were removed. Degraded images exhibiting strong motion blur, rolling shutter artifacts, interlacing artifacts, major windshield reflections, or containing dominant image parts from the capturing vehicle/device were removed as well. A small amount of distortion for motion blur was accepted, as long as individual objects could still be recognized and precisely annotated.
The expertise level of users who contributed images to the dataset is considered, and the dataset’s worldwide distribution is visually displayed on a map, highlighting its global coverage and diversity.
Categories
The dataset distinguishes between 124 visual object categories, mostly pertaining to a street-level scene domain. The categories are organized into 7 (+1) root-level groups, namely object, construction, human, marking (+marking-only), nature, void, and animal. Each root-level group is organized into different macro-groups.
| root-level | macro-level | |||||
|---|---|---|---|---|---|---|
| object | sign | support | traffic-light | traffic-sign | vehicle | water |
| construction | barrier | flat | structure | |||
| human | person | rider | ||||
| marking | continous | discrete | arrow | hatched | symbol | |
| marking-only | continous | discrete | ||||
| nature | ||||||
| void | ||||||
| animal |
Image Annotation
Image annotation was conducted by a team of 69 professional image annotators, delivering an average rate of approximately 5.1 images per annotator per day. The average annotation time is around 94 minutes per image. The annotation protocol was designed for each object category with systematic instructions and fallback annotation solutions.
Quality Assurance
The dataset follows a two-stage quality assurance (QA) process targeting instance-specific annotation accuracies with precision and recall both greater than or equal to 97%. The first round of QA is applied to each image and is conducted as a follow-up step after annotation to correct potential mislabeling in terms of precision and recall. The second QA process is guided by a modified variant of the four-eyes principle.
Dataset Splitting
The dataset is split into training, validation, and test sets. Training and validation data comprise 18,000 and 2,000 images, respectively, and the remaining 5,000 images form the test set. Each of the sets is additionally grouped by geographical regions. In such a way, segmentation assessment can be performed on more regional levels, potentially revealing classifier discrepancies e.g. when comparing results on images from North America to Asia.
Statistical Analysis
The dataset is diverse in terms of image resolution, focal length, and camera model. It spans all the continents except for Antarctica, indicating a rich variety of images from different parts of the world. The dataset also contains a large number of object instances, making it suitable for fine-grained segmentation tasks.
All images are at least FullHD, but we have images with more than 22 Mpixels. Most pictures are in landscape orientation. The dominant aspect ratio is 4:3, followed by 16:9, but other ratios are represented (mean ratio is 1.38). The mode of distribution is at about 35,000 uploaded images with 50 users.
Top-left. Distribution of image resolution. The minimum size is fixed at Full HD (bottom left) and the maximum image resolution is >22 MPixels. Top-right. Focal length distribution. Bottom. Distribution of camera sensors/devices used for image capturing.
There is a predominance of mobile devices from Apple and Samsung, but in general, the dataset spans a wide range of different camera types, such as head- or car-mounted ones like Garmin and GoPro.
 Homepage
 Research Paper
 GitHub
Summary #
The Mapillary Vistas Dataset for Semantic Understanding of Street Scenes v2.0 is a dataset for instance segmentation, semantic segmentation, and object detection tasks. It is used in the automotive industry.
The dataset consists of 25000 images with 1872892 labeled objects belonging to 124 different classes including sky, road, pole, and other: vegetation, car, building, static, street light, traffic sign (front), curb, sidewalk, lane marking - straight line, lane marking - dashed line, fence, traffic sign (back), signage - advertisement, traffic sign - direction (front), utility pole, person, terrain, wall, curb cut, traffic light - general (upright), vehicle group, signage - store, ground, dynamic, traffic light - pedestrians, and 96 more.
Images in the Mapillary Vistas dataset have pixel-level instance segmentation annotations. Due to the nature of the instance segmentation task, it can be automatically transformed into a semantic segmentation (only one mask for every class) or object detection (bounding boxes for every object) tasks. There are 5000 (20% of the total) unlabeled images (i.e. without annotations). There are 3 splits in the dataset: training (18000 images), testing (5000 images), and validation (2000 images). Alternatively, the dataset could be split into 8 root-level classes: object (1124545 objects), construction (270803 objects), void (141485 objects), marking (137680 objects), nature (121753 objects), human (70856 objects), marking-only (3701 objects), and animal (2069 objects), or into 15 macro-level classes: support (393381 objects), vehicle (191281 objects), traffic-sign (170912 objects), barrier (131699 objects), flat (102671 objects), sign (86497 objects), continuous (81843 objects), traffic-light (79512 objects), person (62531 objects), discrete (59538 objects), structure (36433 objects), arrow (9948 objects), rider (8325 objects), hatched (2932 objects), and symbol (2565 objects). Explore them in supervisely labeling tool. The dataset was released in 2020 by the Mapillary, Sweden.
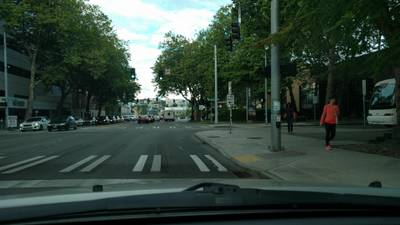
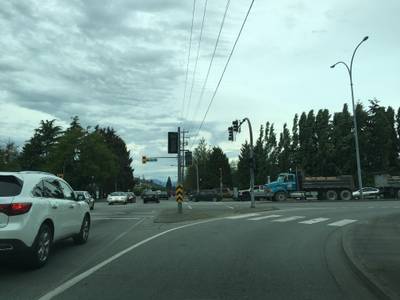
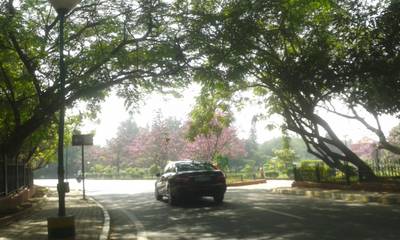
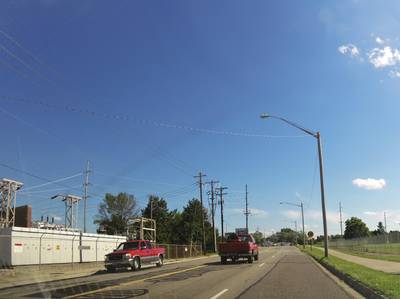
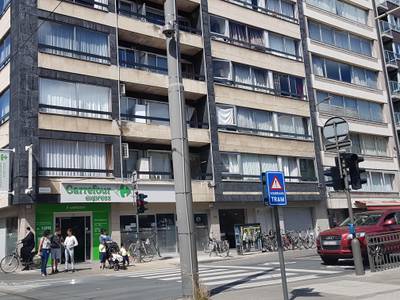
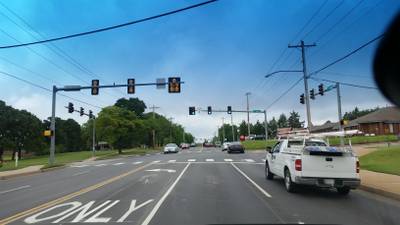
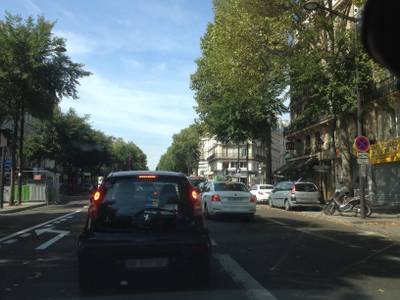
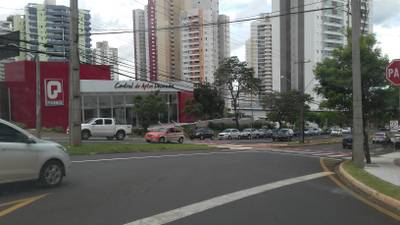
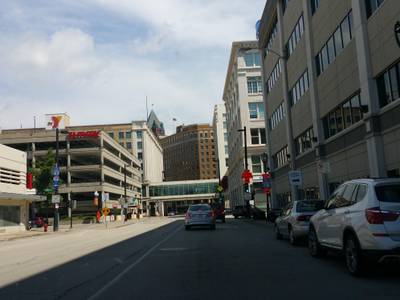
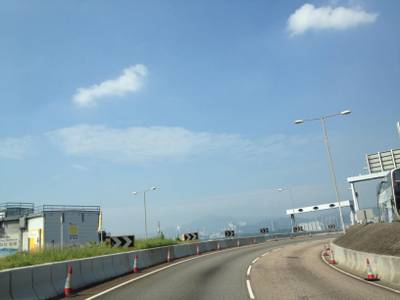
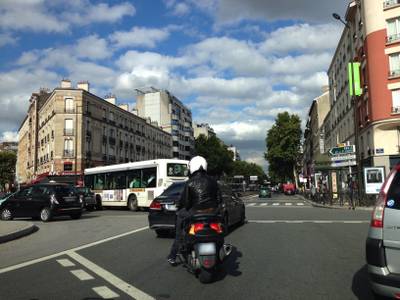
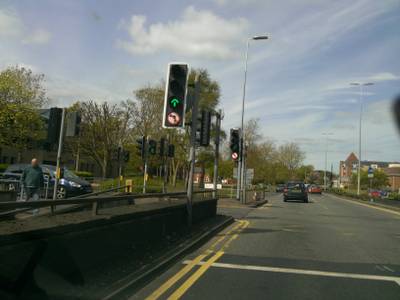
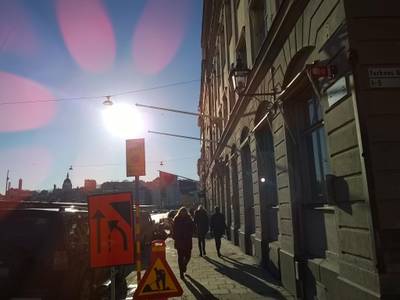
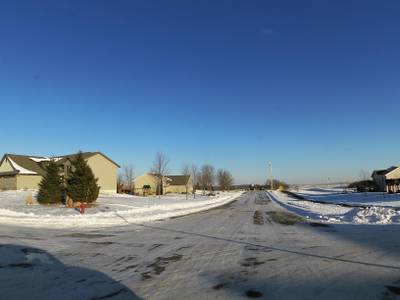
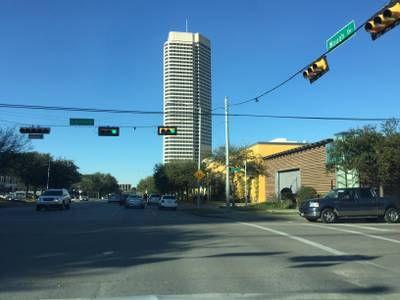
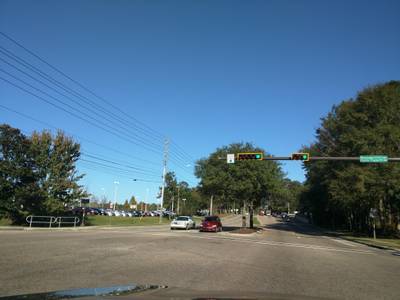
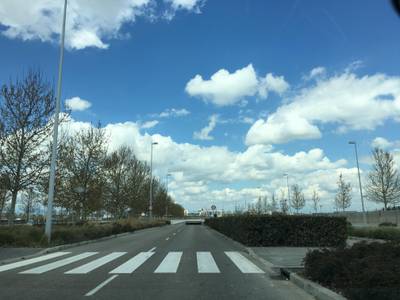
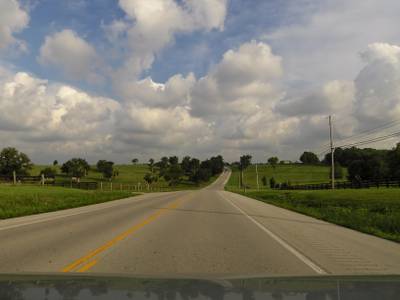
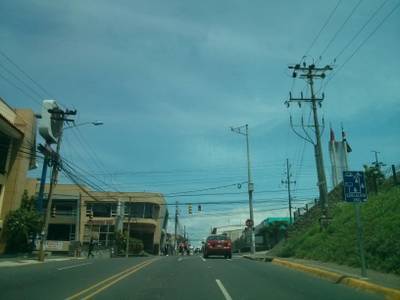
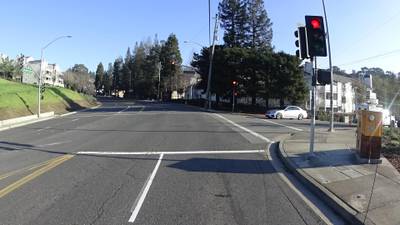
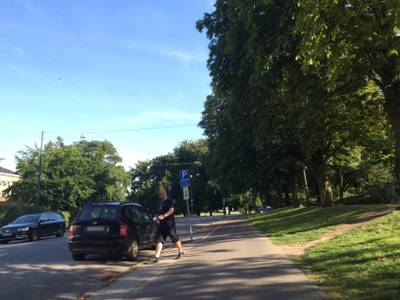
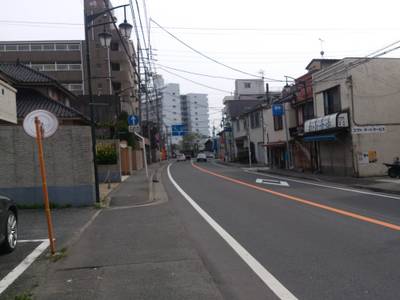
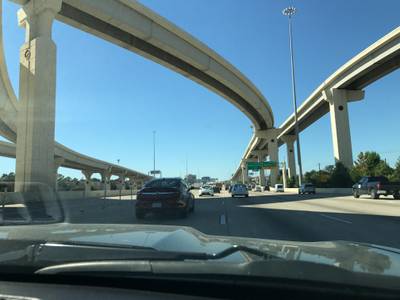
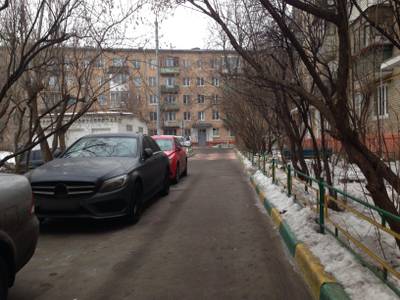
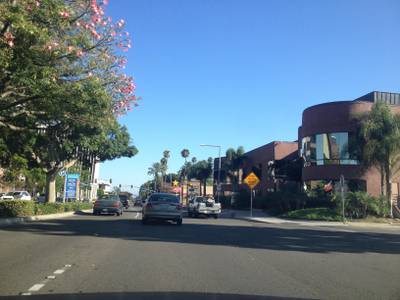
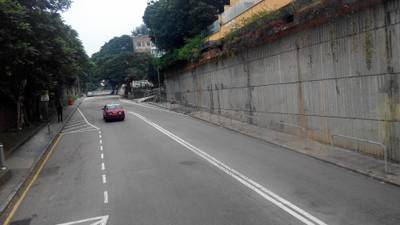
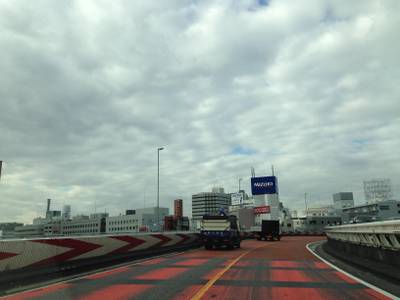
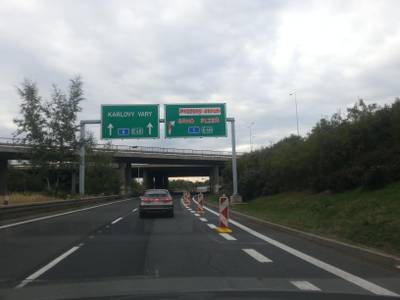
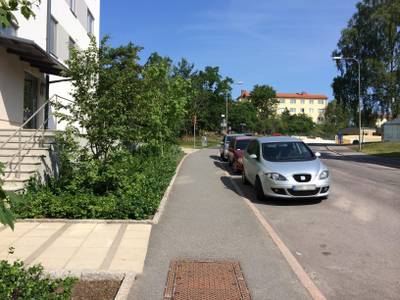
Here is a visualized example for randomly selected sample classes:
Explore #
Mapillary Vistas dataset has 25000 images. Click on one of the examples below or open "Explore" tool anytime you need to view dataset images with annotations. This tool has extended visualization capabilities like zoom, translation, objects table, custom filters and more. Hover the mouse over the images to hide or show annotations.


Class balance #
There are 124 annotation classes in the dataset. Find the general statistics and balances for every class in the table below. Click any row to preview images that have labels of the selected class. Sort by column to find the most rare or prevalent classes.

Class ㅤ | Images ㅤ | Objects ㅤ | Count on image average | Area on image average |
|---|---|---|---|---|
sky➔ polygon | 19787 | 20093 | 1.02 | 50.88% |
road➔ polygon | 19753 | 20414 | 1.03 | 35.43% |
pole➔ polygon | 19706 | 320098 | 16.24 | 0.98% |
vegetation➔ polygon | 19425 | 73057 | 3.76 | 17.85% |
car➔ polygon | 18709 | 148818 | 7.95 | 3.88% |
building➔ polygon | 18299 | 32312 | 1.77 | 22.53% |
static➔ polygon | 17898 | 102336 | 5.72 | 0.71% |
street light➔ polygon | 17625 | 139230 | 7.9 | 0.07% |
traffic sign (front)➔ polygon | 17178 | 93287 | 5.43 | 0.28% |
curb➔ polygon | 16886 | 66454 | 3.94 | 1.16% |
Images #
Explore every single image in the dataset with respect to the number of annotations of each class it has. Click a row to preview selected image. Sort by any column to find anomalies and edge cases. Use horizontal scroll if the table has many columns for a large number of classes in the dataset.
Class sizes #
The table below gives various size properties of objects for every class. Click a row to see the image with annotations of the selected class. Sort columns to find classes with the smallest or largest objects or understand the size differences between classes.
Class | Object count | Avg area | Max area | Min area | Min height | Min height | Max height | Max height | Avg height | Avg height | Min width | Min width | Max width | Max width |
|---|---|---|---|---|---|---|---|---|---|---|---|---|---|---|
pole polygon | 320098 | 0.06% | 12.8% | 0% | 2px | 0.06% | 3936px | 100% | 226px | 9.21% | 1px | 0.02% | 4160px | 100% |
car polygon | 148818 | 0.51% | 47.25% | 0% | 3px | 0.1% | 2980px | 100% | 139px | 5.69% | 3px | 0.09% | 4128px | 100% |
street light polygon | 139230 | 0.01% | 1.15% | 0% | 2px | 0.06% | 1443px | 58.95% | 21px | 0.86% | 2px | 0.06% | 3121px | 100% |
static polygon | 102336 | 0.12% | 54.78% | 0% | 3px | 0.1% | 3456px | 100% | 93px | 3.78% | 1px | 0.02% | 4160px | 100% |
traffic sign (front) polygon | 93287 | 0.05% | 15.33% | 0% | 3px | 0.12% | 1209px | 44.49% | 56px | 2.27% | 3px | 0.07% | 3241px | 99.3% |
vegetation polygon | 73057 | 4.77% | 99.94% | 0% | 1px | 0.04% | 3984px | 100% | 479px | 19.47% | 2px | 0.06% | 5664px | 100% |
curb polygon | 66454 | 0.29% | 26.78% | 0% | 2px | 0.07% | 2454px | 90.16% | 167px | 6.82% | 3px | 0.09% | 6528px | 100% |
utility pole polygon | 65228 | 0.14% | 16.62% | 0% | 3px | 0.1% | 3936px | 100% | 352px | 14.27% | 1px | 0.02% | 3264px | 100% |
person polygon | 58897 | 0.12% | 19.46% | 0% | 4px | 0.13% | 3167px | 100% | 147px | 5.89% | 3px | 0.09% | 1317px | 40.35% |
traffic light - general (upright) polygon | 49431 | 0.06% | 3.22% | 0% | 4px | 0.17% | 1070px | 35.91% | 88px | 3.61% | 2px | 0.06% | 696px | 17.47% |
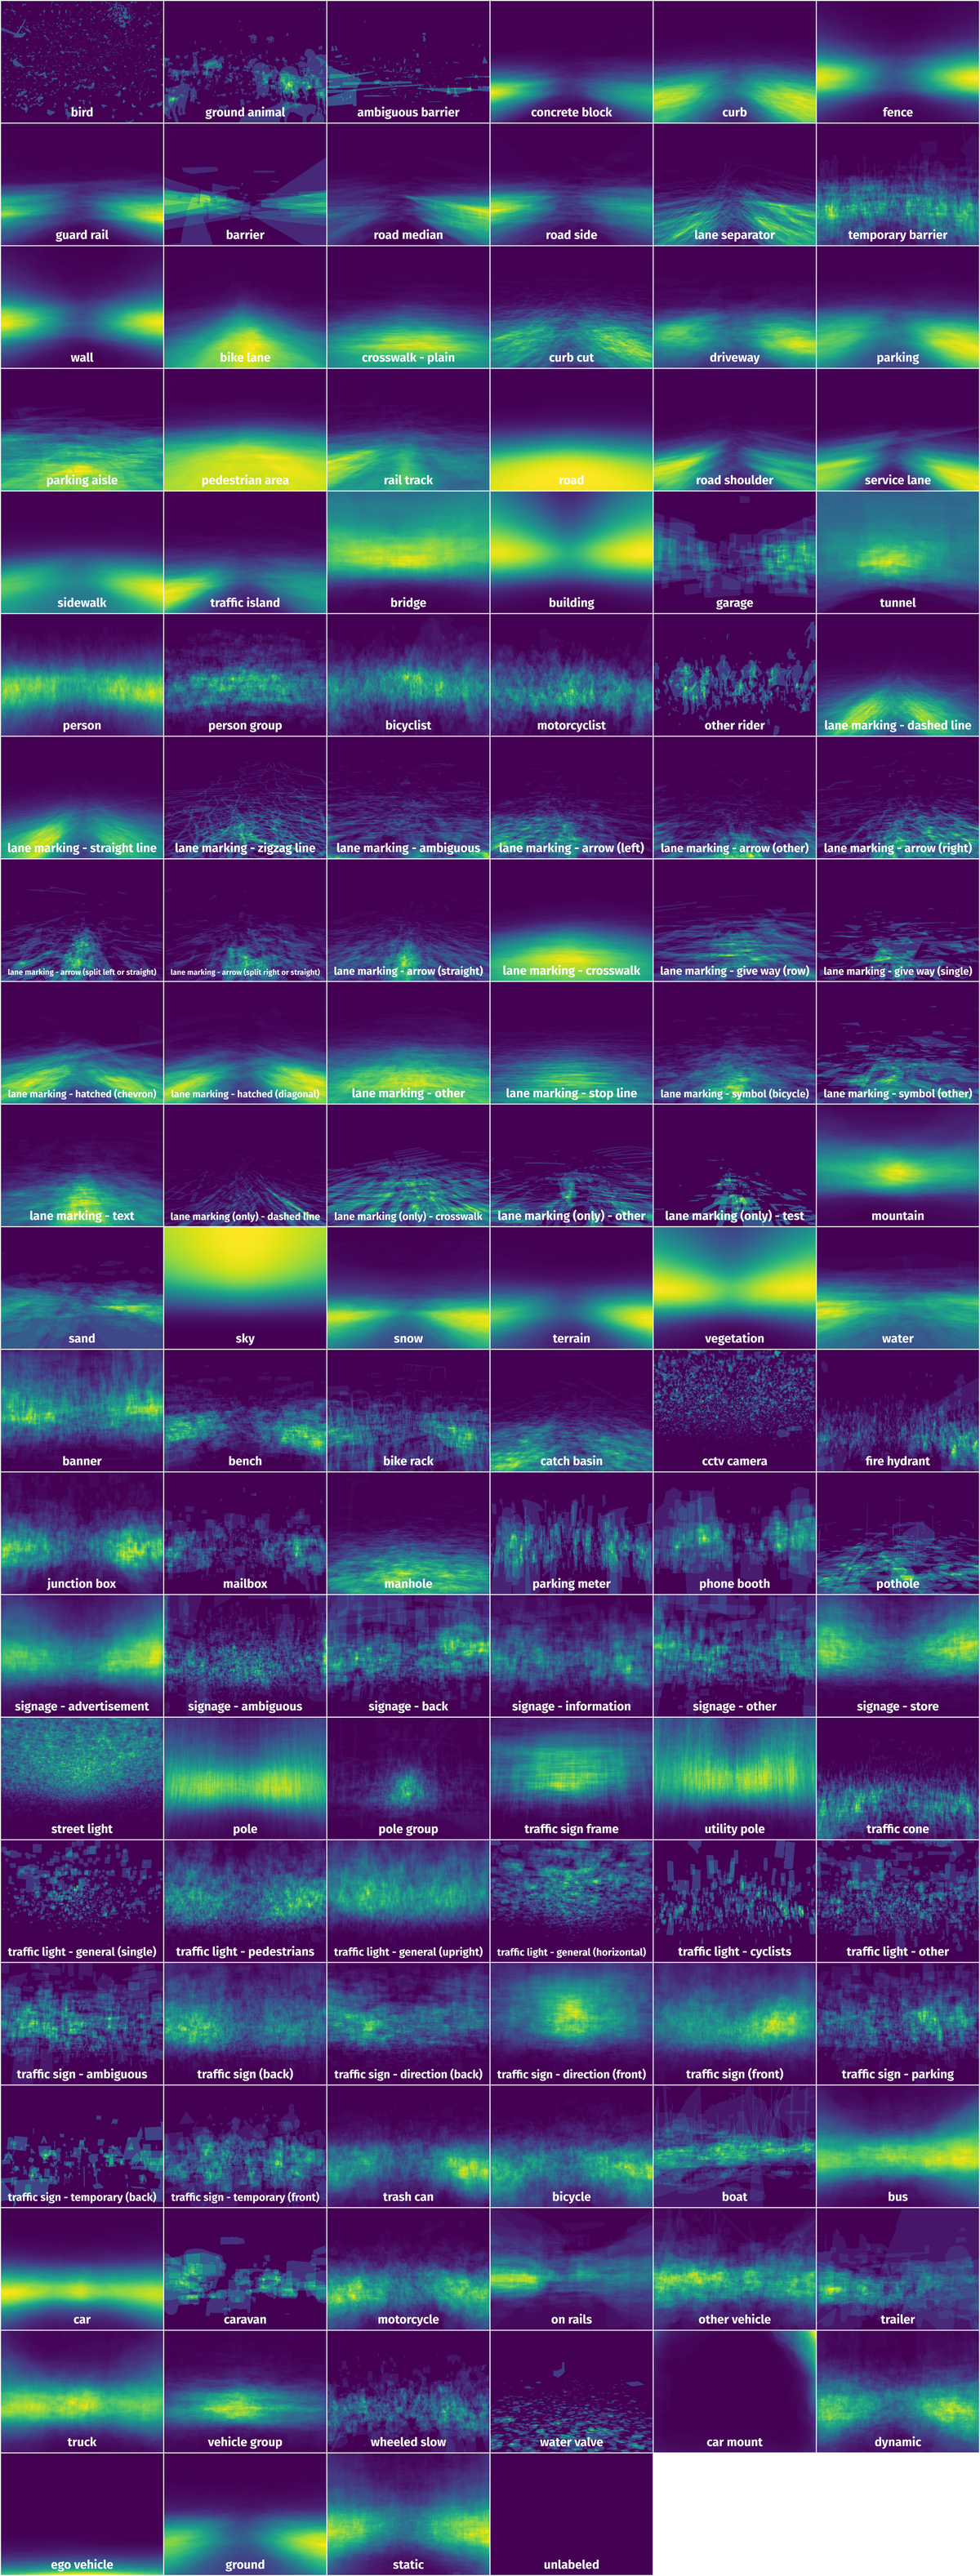
Spatial Heatmap #
The heatmaps below give the spatial distributions of all objects for every class. These visualizations provide insights into the most probable and rare object locations on the image. It helps analyze objects' placements in a dataset.
Objects #
Table contains all 98109 objects. Click a row to preview an image with annotations, and use search or pagination to navigate. Sort columns to find outliers in the dataset.
Object ID ㅤ | Class ㅤ | Image name click row to open | Image size height x width | Height ㅤ | Height ㅤ | Width ㅤ | Width ㅤ | Area ㅤ |
|---|---|---|---|---|---|---|---|---|
1➔ | sky polygon | 5Wnh21pNvbBlUxJuCZIhTQ.jpg | 2160 x 3840 | 1046px | 48.43% | 3840px | 100% | 33.53% |
2➔ | road polygon | 5Wnh21pNvbBlUxJuCZIhTQ.jpg | 2160 x 3840 | 1017px | 47.08% | 3547px | 92.37% | 30.31% |
3➔ | building polygon | 5Wnh21pNvbBlUxJuCZIhTQ.jpg | 2160 x 3840 | 1299px | 60.14% | 2516px | 65.52% | 25.68% |
4➔ | car polygon | 5Wnh21pNvbBlUxJuCZIhTQ.jpg | 2160 x 3840 | 99px | 4.58% | 590px | 15.36% | 0.44% |
5➔ | garage polygon | 5Wnh21pNvbBlUxJuCZIhTQ.jpg | 2160 x 3840 | 373px | 17.27% | 1333px | 34.71% | 1.74% |
6➔ | utility pole polygon | 5Wnh21pNvbBlUxJuCZIhTQ.jpg | 2160 x 3840 | 63px | 2.92% | 23px | 0.6% | 0.01% |
7➔ | wall polygon | 5Wnh21pNvbBlUxJuCZIhTQ.jpg | 2160 x 3840 | 388px | 17.96% | 1198px | 31.2% | 5.17% |
8➔ | ground polygon | 5Wnh21pNvbBlUxJuCZIhTQ.jpg | 2160 x 3840 | 822px | 38.06% | 1365px | 35.55% | 9.13% |
9➔ | curb polygon | 5Wnh21pNvbBlUxJuCZIhTQ.jpg | 2160 x 3840 | 796px | 36.85% | 1011px | 26.33% | 1.77% |
10➔ | traffic sign (back) polygon | 5Wnh21pNvbBlUxJuCZIhTQ.jpg | 2160 x 3840 | 327px | 15.14% | 290px | 7.55% | 0.91% |
License #
The Mapillary Vistas Dataset for Semantic Understanding of Street Scenes v2.0 is under CC BY-NC-SA 4.0 license.
Citation #
If you make use of the Mapillary Vistas data, please cite the following reference:
@InProceedings{Neuhold_2017_ICCV,
  author = {Neuhold, Gerhard and Ollmann, Tobias and Rota Bulo, Samuel and Kontschieder, Peter},
  title = {The Mapillary Vistas Dataset for Semantic Understanding of Street Scenes},
  booktitle = {Proceedings of the IEEE International Conference on Computer Vision (ICCV)},
  month = {Oct},
  year = {2017}
}
If you are happy with Dataset Ninja and use provided visualizations and tools in your work, please cite us:
@misc{ visualization-tools-for-mapillary-vistas-dataset-dataset,
  title = { Visualization Tools for Mapillary Vistas Dataset },
  type = { Computer Vision Tools },
  author = { Dataset Ninja },
  howpublished = { \url{ https://datasetninja.com/mapillary-vistas-dataset } },
  url = { https://datasetninja.com/mapillary-vistas-dataset },
  journal = { Dataset Ninja },
  publisher = { Dataset Ninja },
  year = { 2026 },
  month = { jul },
  note = { visited on 2026-07-21 },
}
Download #
Dataset Mapillary Vistas can be downloaded in Supervisely format:
As an alternative, it can be downloaded with dataset-tools package:
pip install --upgrade dataset-tools
… using following python code:
import dataset_tools as dtools

dtools.download(dataset='Mapillary Vistas', dst_dir='~/dataset-ninja/')
Make sure not to overlook the python code example available on the Supervisely Developer Portal. It will give you a clear idea of how to effortlessly work with the downloaded dataset.
The data in original format can be downloaded here.
Disclaimer #
Our gal from the legal dep told us we need to post this:
Dataset Ninja provides visualizations and statistics for some datasets that can be found online and can be downloaded by general audience. Dataset Ninja is not a dataset hosting platform and can only be used for informational purposes. The platform does not claim any rights for the original content, including images, videos, annotations and descriptions. Joint publishing is prohibited.
You take full responsibility when you use datasets presented at Dataset Ninja, as well as other information, including visualizations and statistics we provide. You are in charge of compliance with any dataset license and all other permissions. You are required to navigate datasets homepage and make sure that you can use it. In case of any questions, get in touch with us at hello@datasetninja.com.