

Introduction #
The authors of the Microscopy Malaria Dataset explore the application of point-of-care diagnostics in microscopy and computer vision for practical issues, especially in low-income, high disease burden areas. The experts annotated thick blood smears, plasmodium instances were annotated. For sputum samples, the experts annotated tuberculosis bacilli (tb bacillus). Additionally, in images of stool samples, annotations encompassed the eggs of hookworm, taenia, and hymenolepsis nana.
Motivation
Conventional light microscopy remains the standard for diagnosing conditions like malaria, particularly in low-resource settings. While newer technologies exist, the simplicity and versatility of microscopy make it suitable for resource-constrained areas. However, the shortage of skilled technicians hinders its effectiveness, leading to diagnoses based solely on clinical signs and symptoms.
To address the challenges, the authors emphasize the development of point-of-care diagnostics using common resources like microscopes and smartphones. Leveraging the widespread ownership of smartphones in developing regions, the authors propose a setup with significant potential for remote and automated diagnosis. Computer vision methods play a crucial role in automating microscopical assessments within the limitations of camera optics and image analysis accuracy.
Disease-Specific Considerations
Malaria. The gold standard for malaria diagnosis is the microscopical examination of stained blood smear samples. Thick blood smears, being more sensitive, are recommended for screening plasmodium parasites. The study explores the use of deep learning for accurate malaria detection, addressing challenges like low parasitemia.
Tuberculosis diagnosis relies on the demonstration of mycobacteria in clinical specimens. The Ziehl-Neelsen stain is commonly used, and the study evaluates the application of deep learning for TB detection in sputum samples. Challenges in rural, developing-world settings are considered due to the expense and time-consuming nature of current diagnostic methods.
Intestinal Parasites. Identifying helminth eggs involves microscopy of fecal samples. The study explores the potential of deep learning in distinguishing helminth eggs from fecal impurities, addressing challenges in accurate diagnosis.
Data Acquisition
The authors present the experimental setup utilized for data collection and system prototype testing. To deploy computer vision methods for decision support and automated diagnostics, they recognized the need for a suitable deployment platform. Existing digital microscopes and imaging solutions were either costly or limited to specific microscope models, rendering them unsuitable for the task. Additionally, the authors observed challenges with existing low-cost smartphone adapters, particularly their sensitivity to movement, which could lead to alignment issues.
Microscope smartphone adapter: design of components (left), 3D-printed adapter mounted on microscope (center), smartphone inserted into adapter (right).
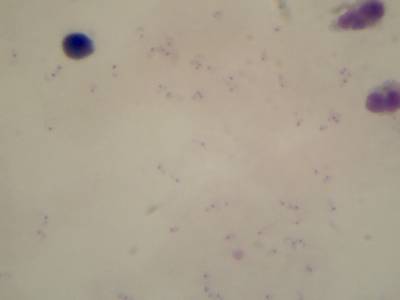
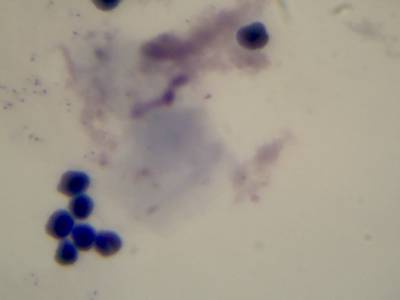
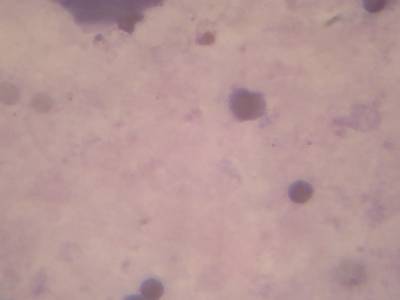
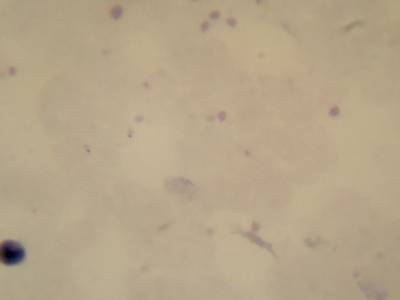
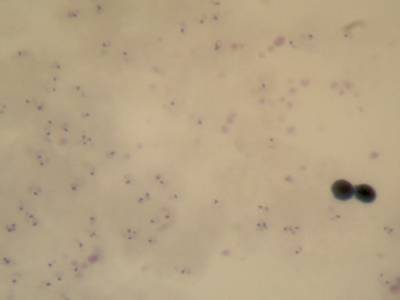
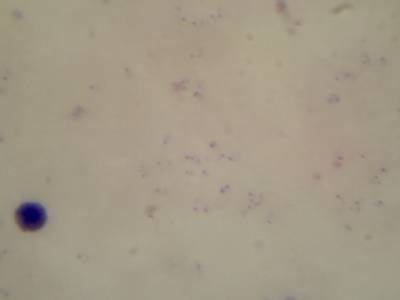
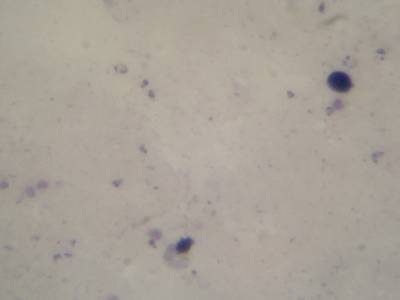
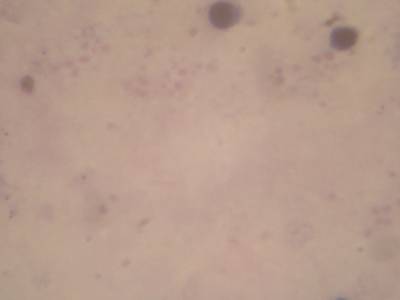
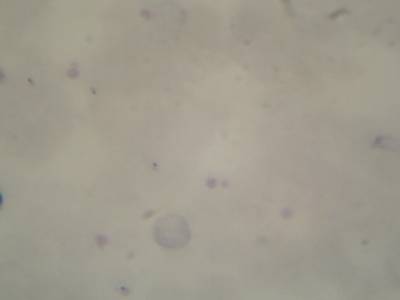
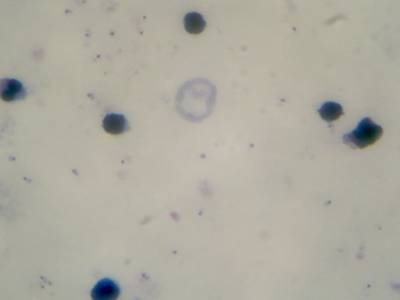
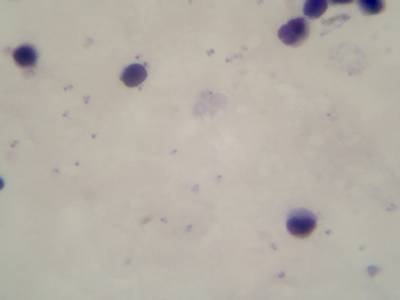
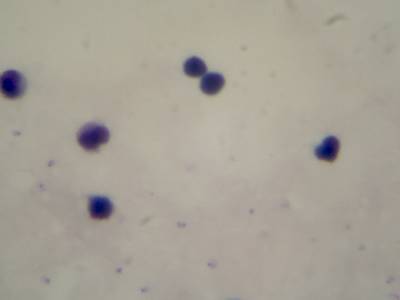
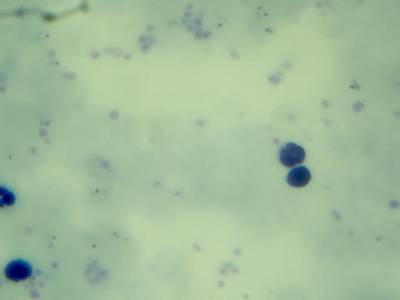
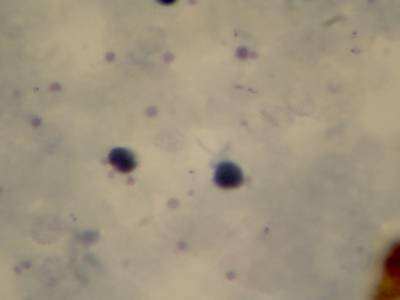
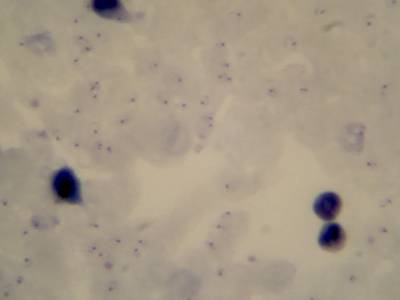
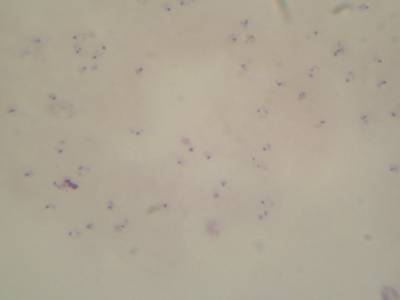
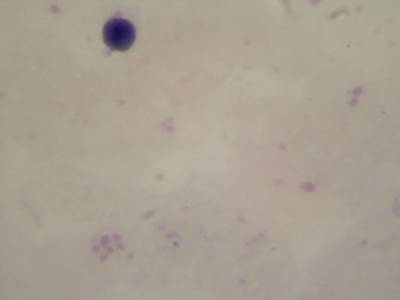
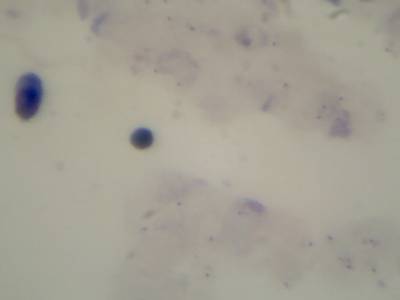
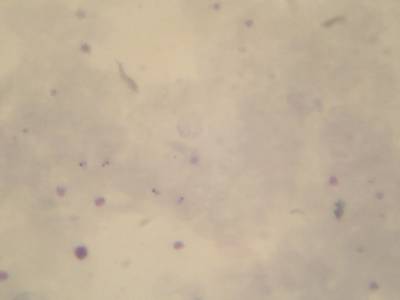
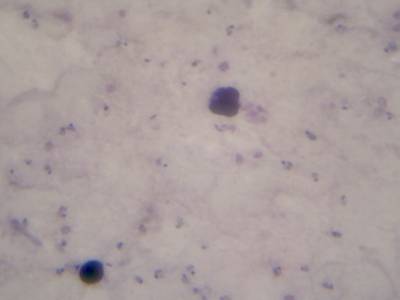
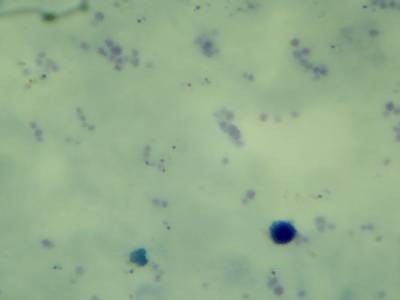
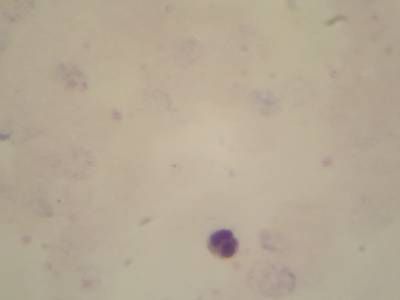
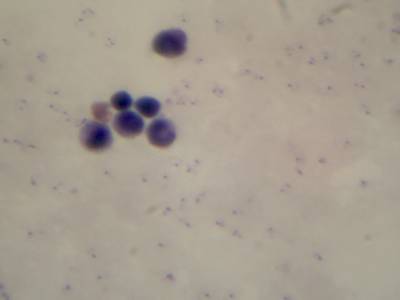
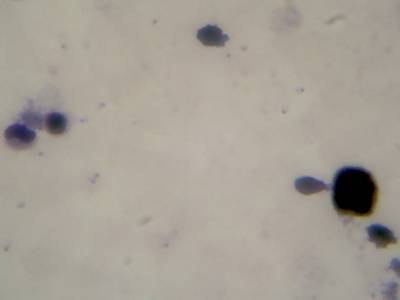
Image of thick blood smear with Giemsa stain, taken with the apparatus shown above. Detail on right shows several P. falciparum clearly visible.
The attachment mechanism seamlessly couples with the microscope eyepiece (ocular). The adjustment mechanism is strategically designed to allow users to correctly align a smartphone of almost any model with the focal point of the eyepiece. Achieved through sliders and side-holders, this mechanism facilitates precise positioning of the phone. The locking mechanism ensures the smartphone remains in position once the correct alignment is achieved. Users can easily slide the smartphone in and out of the adapter without compromising the pre-set alignment, enhancing usability.
Imaging and Annotation
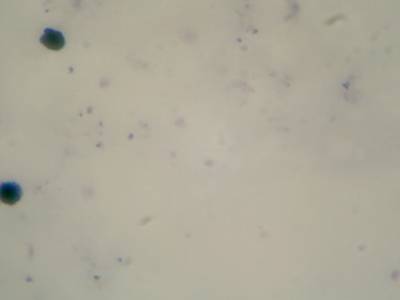
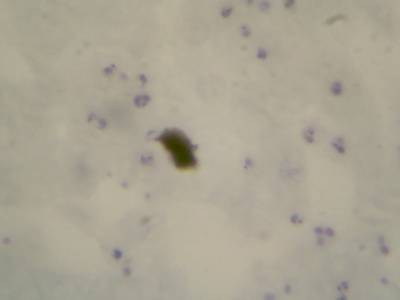
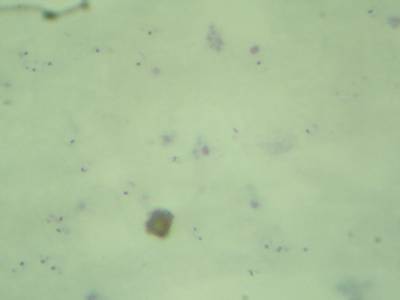
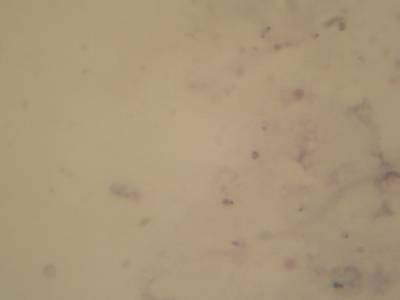
Using the described setup, the authors captured malaria images from thick blood smears stained with Field stain at x1000 magnification. Tuberculosis (TB) images were obtained from fresh sputum, stained with ZN (Ziehl Neelsen) stain, and examined under x1000 magnification. For intestinal parasites, images were captured from slides of a wet preparation, involving a portion of stool sample mixed in a drop of normal saline, and examined under x400 magnification.
In the annotation phase, laboratory experts provided input on the object locations within the images. This information was systematically recorded using annotation software tailored for the task. The experts meticulously identified bounding boxes around each object of interest in every image. For thick blood smear images, plasmodium were annotated, resulting in 7245 objects across 1182 images. In sputum samples, tuberculosis bacilli were annotated, totaling 9969 objects in 1218 images. In stool samples, the eggs of hookworm, Taenia, and Hymenolepsis nana were annotated, comprising 162 objects in 1217 images. This annotated dataset serves as a valuable resource for further research in the domain of microscopy and automated diagnostics.
 Homepage
 Research Paper
Summary #
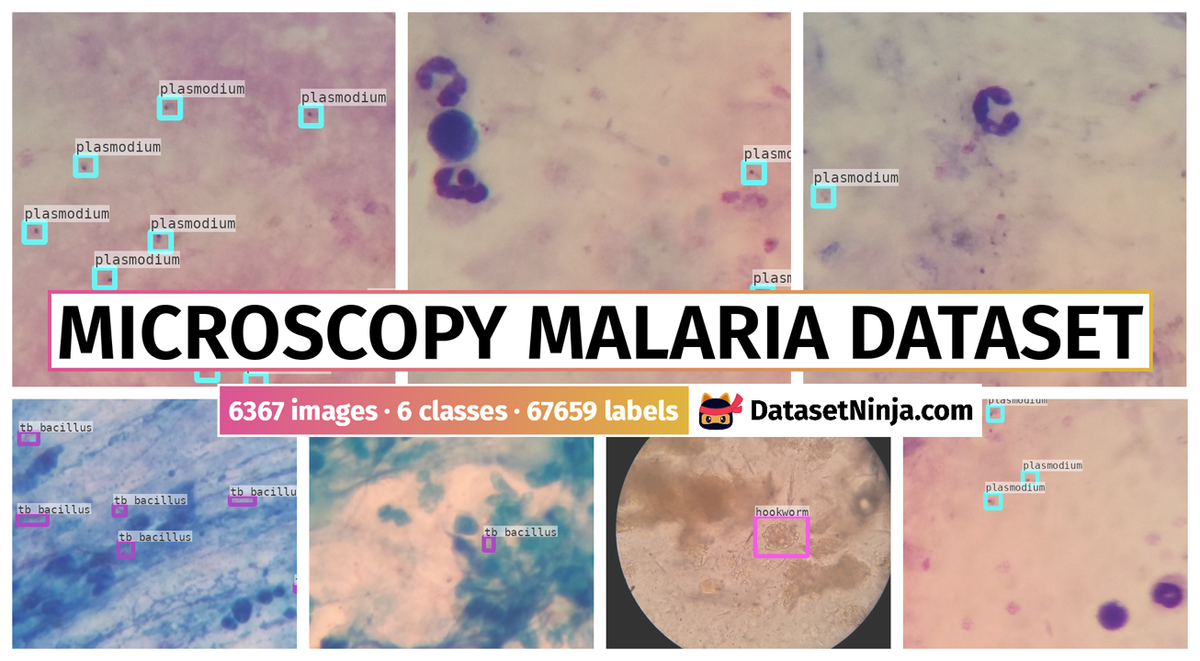
Microscopy Malaria Dataset is a dataset for an object detection task. It is used in the medical industry.
The dataset consists of 6367 images with 67659 labeled objects belonging to 6 different classes including trophozoite, tb bacillus, plasmodium, and other: hookworm, taenia, and hymenolepsis nana.
Images in the Microscopy Malaria Dataset dataset have bounding box annotations. There are 1636 (26% of the total) unlabeled images (i.e. without annotations). There are 4 splits in the dataset: plasmodium-images (2703 images), tuberculosis-phonecamera (1265 images), intestinalparasites-phonecamera (1217 images), and plasmodium-phonecamera (1182 images). The dataset was released in 2016 by the Makerere University AI Lab, Uganda.
Explore #
Microscopy Malaria Dataset dataset has 6367 images. Click on one of the examples below or open "Explore" tool anytime you need to view dataset images with annotations. This tool has extended visualization capabilities like zoom, translation, objects table, custom filters and more. Hover the mouse over the images to hide or show annotations.


Class balance #
There are 6 annotation classes in the dataset. Find the general statistics and balances for every class in the table below. Click any row to preview images that have labels of the selected class. Sort by column to find the most rare or prevalent classes.

Class ㅤ | Images ㅤ | Objects ㅤ | Count on image average | Area on image average |
|---|---|---|---|---|
trophozoite➔ rectangle | 2418 | 49900 | 20.64 | 6.53% |
tb bacillus➔ rectangle | 1218 | 9969 | 8.18 | 1.8% |
plasmodium➔ rectangle | 948 | 7628 | 8.05 | 2.36% |
hookworm➔ rectangle | 116 | 129 | 1.11 | 3.28% |
taenia➔ rectangle | 25 | 25 | 1 | 1.19% |
hymenolepsis nana➔ rectangle | 8 | 8 | 1 | 2.13% |
Co-occurrence matrix #
Co-occurrence matrix is an extremely valuable tool that shows you the images for every pair of classes: how many images have objects of both classes at the same time. If you click any cell, you will see those images. We added the tooltip with an explanation for every cell for your convenience, just hover the mouse over a cell to preview the description.
Images #
Explore every single image in the dataset with respect to the number of annotations of each class it has. Click a row to preview selected image. Sort by any column to find anomalies and edge cases. Use horizontal scroll if the table has many columns for a large number of classes in the dataset.
Class sizes #
The table below gives various size properties of objects for every class. Click a row to see the image with annotations of the selected class. Sort columns to find classes with the smallest or largest objects or understand the size differences between classes.
Class | Object count | Avg area | Max area | Min area | Min height | Min height | Max height | Max height | Avg height | Avg height | Min width | Min width | Max width | Max width |
|---|---|---|---|---|---|---|---|---|---|---|---|---|---|---|
trophozoite rectangle | 49900 | 0.33% | 2.34% | 0% | 2px | 0.26% | 141px | 18.36% | 50px | 6.54% | 2px | 0.2% | 509px | 49.71% |
tb bacillus rectangle | 9969 | 0.22% | 1.39% | 0.01% | 11px | 0.9% | 202px | 16.5% | 68px | 5.59% | 10px | 0.61% | 198px | 12.13% |
plasmodium rectangle | 7628 | 0.3% | 0.7% | 0% | 2px | 0.27% | 64px | 8.53% | 41px | 5.43% | 2px | 0.27% | 73px | 9.73% |
hookworm rectangle | 129 | 2.95% | 3.92% | 1.64% | 167px | 13.64% | 318px | 25.98% | 242px | 19.77% | 178px | 10.91% | 330px | 20.22% |
taenia rectangle | 25 | 1.19% | 1.49% | 0.99% | 135px | 11.03% | 183px | 14.95% | 156px | 12.73% | 135px | 8.27% | 187px | 11.46% |
hymenolepsis nana rectangle | 8 | 2.13% | 2.75% | 1.92% | 177px | 14.46% | 223px | 18.22% | 202px | 16.53% | 181px | 11.09% | 257px | 15.75% |
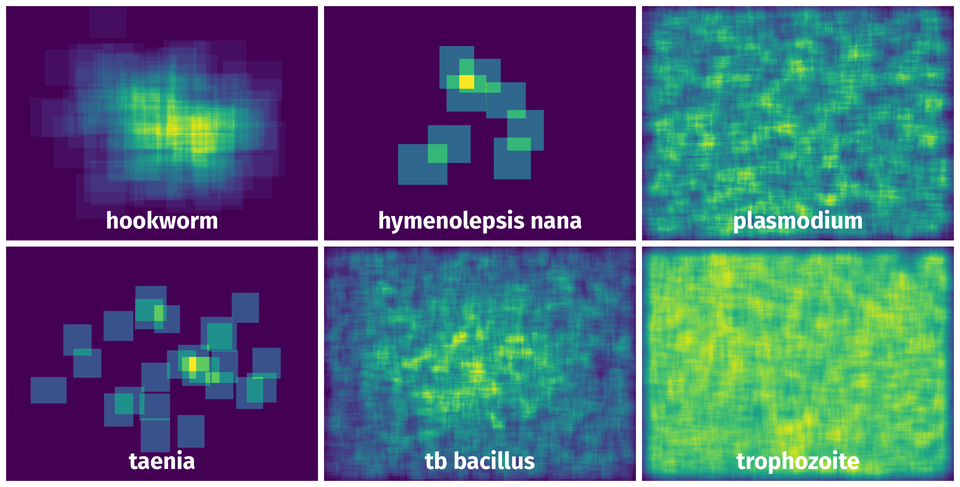
Spatial Heatmap #
The heatmaps below give the spatial distributions of all objects for every class. These visualizations provide insights into the most probable and rare object locations on the image. It helps analyze objects' placements in a dataset.
Objects #
Table contains all 67659 objects. Click a row to preview an image with annotations, and use search or pagination to navigate. Sort columns to find outliers in the dataset.
Object ID ㅤ | Class ㅤ | Image name click row to open | Image size height x width | Height ㅤ | Height ㅤ | Width ㅤ | Width ㅤ | Area ㅤ |
|---|---|---|---|---|---|---|---|---|
1➔ | trophozoite rectangle | plasmodium-0949.jpg | 768 x 1024 | 51px | 6.64% | 51px | 4.98% | 0.33% |
2➔ | trophozoite rectangle | plasmodium-0949.jpg | 768 x 1024 | 51px | 6.64% | 51px | 4.98% | 0.33% |
3➔ | trophozoite rectangle | plasmodium-0263.jpg | 768 x 1024 | 51px | 6.64% | 51px | 4.98% | 0.33% |
4➔ | trophozoite rectangle | plasmodium-0263.jpg | 768 x 1024 | 51px | 6.64% | 51px | 4.98% | 0.33% |
5➔ | trophozoite rectangle | plasmodium-0263.jpg | 768 x 1024 | 51px | 6.64% | 51px | 4.98% | 0.33% |
6➔ | trophozoite rectangle | plasmodium-0263.jpg | 768 x 1024 | 51px | 6.64% | 51px | 4.98% | 0.33% |
7➔ | trophozoite rectangle | plasmodium-0263.jpg | 768 x 1024 | 51px | 6.64% | 51px | 4.98% | 0.33% |
8➔ | trophozoite rectangle | plasmodium-0263.jpg | 768 x 1024 | 51px | 6.64% | 51px | 4.98% | 0.33% |
9➔ | trophozoite rectangle | plasmodium-0263.jpg | 768 x 1024 | 51px | 6.64% | 51px | 4.98% | 0.33% |
10➔ | trophozoite rectangle | plasmodium-0263.jpg | 768 x 1024 | 51px | 6.64% | 51px | 4.98% | 0.33% |
License #
Citation #
If you make use of the Microscopy Malaria Dataset data, please cite the following reference:
@dataset{Microscopy Malaria Dataset,
  author={John Quinn and Rose Nakasi and Pius K.B. Mugagga and Patrick Byanyima and William Lubega and Alfred Andama},
  title={Microscopy Malaria Dataset},
  year={2016},
  url={https://air.ug/microscopy_dataset/#}
}
If you are happy with Dataset Ninja and use provided visualizations and tools in your work, please cite us:
@misc{ visualization-tools-for-microscopy-malaria-dataset-dataset,
  title = { Visualization Tools for Microscopy Malaria Dataset Dataset },
  type = { Computer Vision Tools },
  author = { Dataset Ninja },
  howpublished = { \url{ https://datasetninja.com/microscopy-malaria-dataset } },
  url = { https://datasetninja.com/microscopy-malaria-dataset },
  journal = { Dataset Ninja },
  publisher = { Dataset Ninja },
  year = { 2026 },
  month = { jul },
  note = { visited on 2026-07-15 },
}
Download #
Dataset Microscopy Malaria Dataset can be downloaded in Supervisely format:
As an alternative, it can be downloaded with dataset-tools package:
pip install --upgrade dataset-tools
… using following python code:
import dataset_tools as dtools

dtools.download(dataset='Microscopy Malaria Dataset', dst_dir='~/dataset-ninja/')
Make sure not to overlook the python code example available on the Supervisely Developer Portal. It will give you a clear idea of how to effortlessly work with the downloaded dataset.
The data in original format can be downloaded here:
Disclaimer #
Our gal from the legal dep told us we need to post this:
Dataset Ninja provides visualizations and statistics for some datasets that can be found online and can be downloaded by general audience. Dataset Ninja is not a dataset hosting platform and can only be used for informational purposes. The platform does not claim any rights for the original content, including images, videos, annotations and descriptions. Joint publishing is prohibited.
You take full responsibility when you use datasets presented at Dataset Ninja, as well as other information, including visualizations and statistics we provide. You are in charge of compliance with any dataset license and all other permissions. You are required to navigate datasets homepage and make sure that you can use it. In case of any questions, get in touch with us at hello@datasetninja.com.