

Introduction #
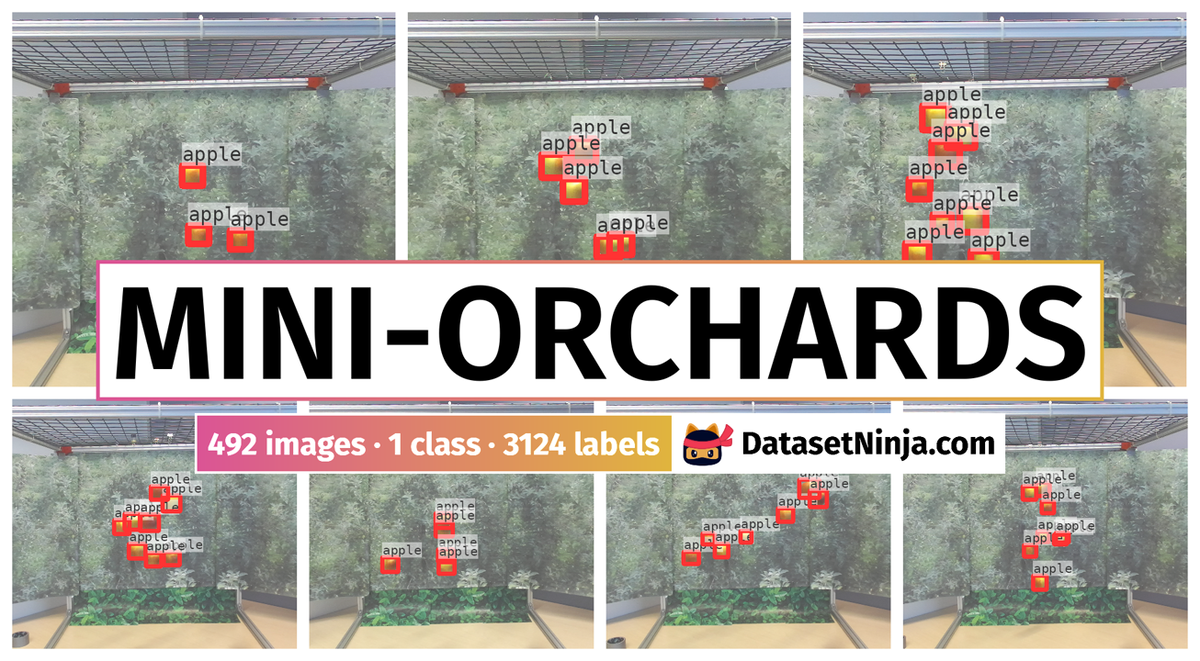
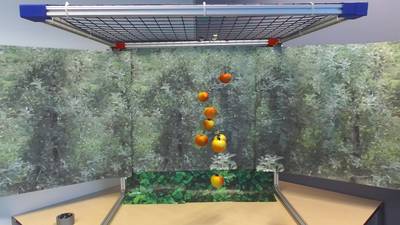
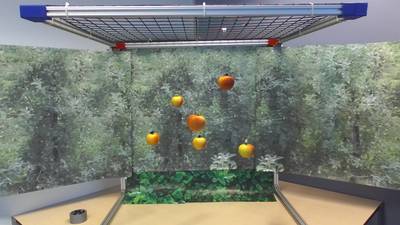
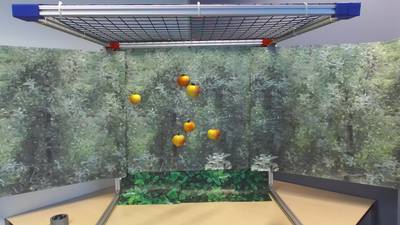
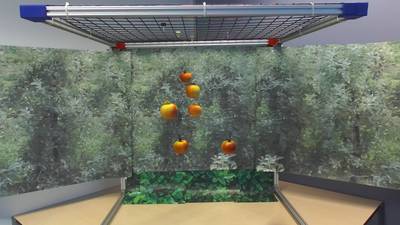
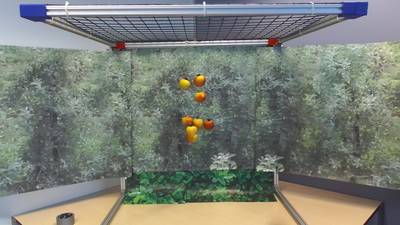
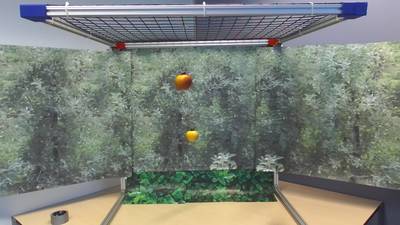
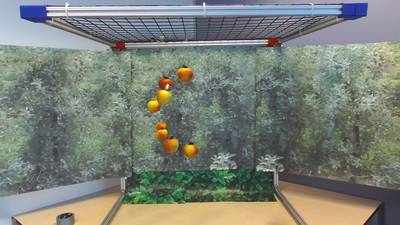
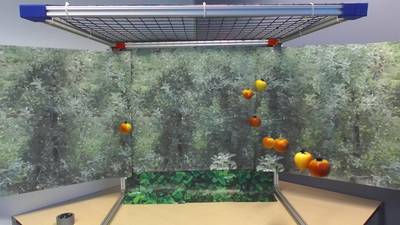
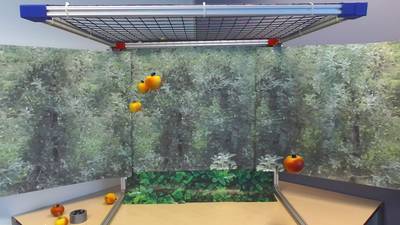
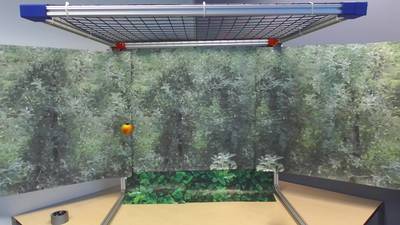
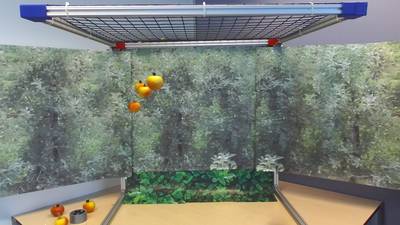
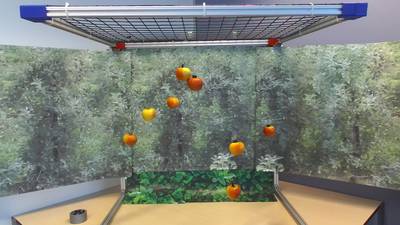
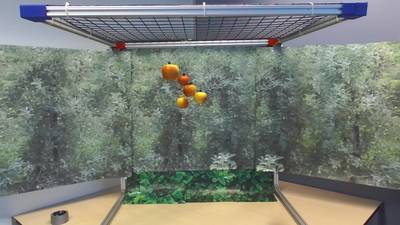
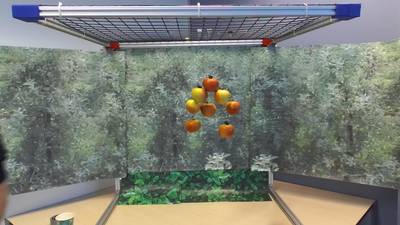
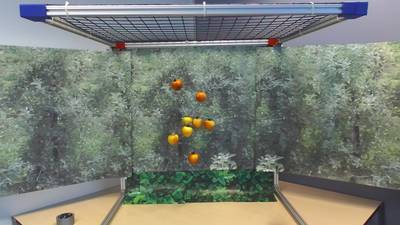
Mini-Orchards is an object detection dataset comprising 492 images and 3124 labeled objects, all pertaining to a single class — apple. Created within a specific laboratory, these images portray apples suspended by string against a background resembling a genuine orchard. Most images offer a clear view of apples without obstruction, though some instances exhibit apples obstructed by others, adding a touch of complexity. This dataset serves as a valuable resource for object detection in computer vision and agricultural research.
Mini-Orchards Dataset is a logical continuation of Simulated-Orchards Dataset (available on DatasetNinja). You can check the specifics of simulating apples on the Unity 3D engine in this dataset.
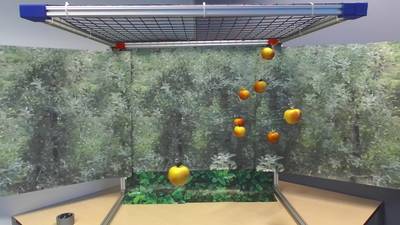
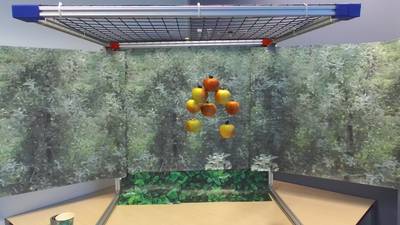
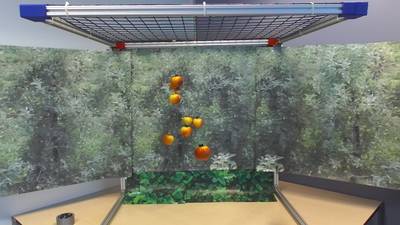
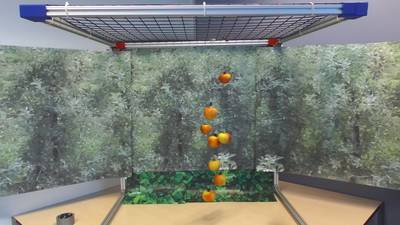
Mini-Orchards is a dataset created within authors’ lab and consists of images of apples suspended by string from a frame. The apples hanging in front of a background emulate a real orchard. The nature of the images makes it a rather simple dataset, since apples are visible mostly without obstruction from branches and leaves. There are however cases where apples are obstructed by other apples. The camera was placed at a fixed distance from the frame holding the apples. RGBD images were taken using a ZED Stereolabs stereo camera. However, since this research focuses on RGB data, the depth channel was discarded. The resulting images have a 1920x1080 resolution.
Mini-Orchards has 500 images that are divided into a train, val, and test set. The train set contains 300 images, while the validation and test sets each have 100 images. The complete dataset has roughly 3000 apples that are annotated with bounding boxes.
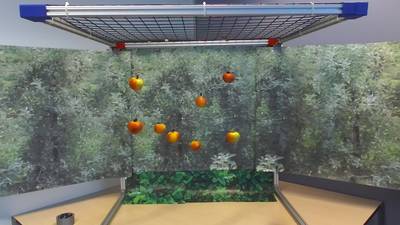
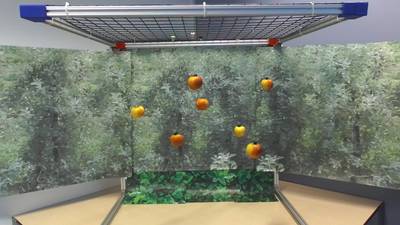
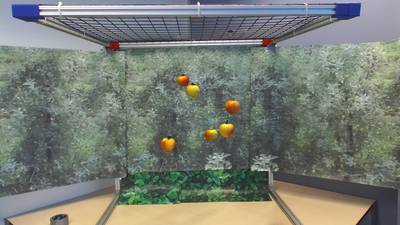
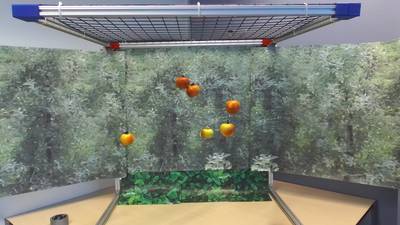
In the original images, too much of the surrounding environment is visible in the frame of the camera. Objects like the grid structure holding the apples can be seen in the images. Authors cropped the images to discard the irrelevant background section of the images and used these cropped images for authors’ experiments. Figure below shows an example of a cropped and uncropped image from the dataset. The cropped images have a resolution of 1920x576.
 Homepage
 Research Paper
 Blog Post
Summary #
Mini-Orchards is a dataset for an object detection task. It is used in the agricultural industry.
The dataset consists of 492 images with 3124 labeled objects belonging to 1 single class (apple).
Images in the Mini-Orchards dataset have bounding box annotations. All images are labeled (i.e. with annotations). There are 3 splits in the dataset: train (295 images), val (99 images), and test (98 images). The dataset was released in 2023 by the NHL Stenden University of Applied Sciences, Netherlands.
Explore #
Mini-Orchards dataset has 492 images. Click on one of the examples below or open "Explore" tool anytime you need to view dataset images with annotations. This tool has extended visualization capabilities like zoom, translation, objects table, custom filters and more. Hover the mouse over the images to hide or show annotations.


Class balance #
There are 1 annotation classes in the dataset. Find the general statistics and balances for every class in the table below. Click any row to preview images that have labels of the selected class. Sort by column to find the most rare or prevalent classes.

Class ㅤ | Images ㅤ | Objects ㅤ | Count on image average | Area on image average |
|---|---|---|---|---|
apple➔ rectangle | 492 | 3124 | 6.35 | 1.28% |
Images #
Explore every single image in the dataset with respect to the number of annotations of each class it has. Click a row to preview selected image. Sort by any column to find anomalies and edge cases. Use horizontal scroll if the table has many columns for a large number of classes in the dataset.
Object distribution #
Interactive heatmap chart for every class with object distribution shows how many images are in the dataset with a certain number of objects of a specific class. Users can click cell and see the list of all corresponding images.
Class sizes #
The table below gives various size properties of objects for every class. Click a row to see the image with annotations of the selected class. Sort columns to find classes with the smallest or largest objects or understand the size differences between classes.
Class | Object count | Avg area | Max area | Min area | Min height | Min height | Max height | Max height | Avg height | Avg height | Min width | Min width | Max width | Max width |
|---|---|---|---|---|---|---|---|---|---|---|---|---|---|---|
apple rectangle | 3124 | 0.21% | 0.52% | 0.09% | 38px | 3.52% | 98px | 9.07% | 62px | 5.7% | 46px | 2.4% | 113px | 5.89% |
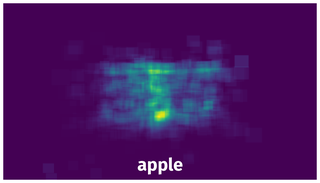
Spatial Heatmap #
The heatmaps below give the spatial distributions of all objects for every class. These visualizations provide insights into the most probable and rare object locations on the image. It helps analyze objects' placements in a dataset.
Objects #
Table contains all 3124 objects. Click a row to preview an image with annotations, and use search or pagination to navigate. Sort columns to find outliers in the dataset.
Object ID ㅤ | Class ㅤ | Image name click row to open | Image size height x width | Height ㅤ | Height ㅤ | Width ㅤ | Width ㅤ | Area ㅤ |
|---|---|---|---|---|---|---|---|---|
1➔ | apple rectangle | RGBD223.png | 1080 x 1920 | 77px | 7.13% | 85px | 4.43% | 0.32% |
2➔ | apple rectangle | RGBD223.png | 1080 x 1920 | 62px | 5.74% | 74px | 3.85% | 0.22% |
3➔ | apple rectangle | RGBD223.png | 1080 x 1920 | 72px | 6.67% | 92px | 4.79% | 0.32% |
4➔ | apple rectangle | RGBD223.png | 1080 x 1920 | 70px | 6.48% | 82px | 4.27% | 0.28% |
5➔ | apple rectangle | RGBD223.png | 1080 x 1920 | 63px | 5.83% | 70px | 3.65% | 0.21% |
6➔ | apple rectangle | RGBD223.png | 1080 x 1920 | 67px | 6.2% | 73px | 3.8% | 0.24% |
7➔ | apple rectangle | RGBD223.png | 1080 x 1920 | 61px | 5.65% | 69px | 3.59% | 0.2% |
8➔ | apple rectangle | RGBD223.png | 1080 x 1920 | 66px | 6.11% | 67px | 3.49% | 0.21% |
9➔ | apple rectangle | RGBD229.png | 1080 x 1920 | 60px | 5.56% | 57px | 2.97% | 0.16% |
10➔ | apple rectangle | RGBD229.png | 1080 x 1920 | 57px | 5.28% | 71px | 3.7% | 0.2% |
License #
Citation #
If you make use of the Mini-Orchards data, please cite the following reference:
@dataset{Mini-Orchards,
  author={Dylan Hasperhoven and Maya Aghaei and Klaas Dijkstra},
  title={Mini-Orchards},
  year={2023},
  url={https://www.kaggle.com/datasets/dylanhasperhoven/mini-orchards}
}
If you are happy with Dataset Ninja and use provided visualizations and tools in your work, please cite us:
@misc{ visualization-tools-for-mini-orchards-dataset,
  title = { Visualization Tools for Mini-Orchards Dataset },
  type = { Computer Vision Tools },
  author = { Dataset Ninja },
  howpublished = { \url{ https://datasetninja.com/mini-orchards } },
  url = { https://datasetninja.com/mini-orchards },
  journal = { Dataset Ninja },
  publisher = { Dataset Ninja },
  year = { 2026 },
  month = { jul },
  note = { visited on 2026-07-16 },
}
Download #
Dataset Mini-Orchards can be downloaded in Supervisely format:
As an alternative, it can be downloaded with dataset-tools package:
pip install --upgrade dataset-tools
… using following python code:
import dataset_tools as dtools

dtools.download(dataset='Mini-Orchards', dst_dir='~/dataset-ninja/')
Make sure not to overlook the python code example available on the Supervisely Developer Portal. It will give you a clear idea of how to effortlessly work with the downloaded dataset.
The data in original format can be downloaded here.
Disclaimer #
Our gal from the legal dep told us we need to post this:
Dataset Ninja provides visualizations and statistics for some datasets that can be found online and can be downloaded by general audience. Dataset Ninja is not a dataset hosting platform and can only be used for informational purposes. The platform does not claim any rights for the original content, including images, videos, annotations and descriptions. Joint publishing is prohibited.
You take full responsibility when you use datasets presented at Dataset Ninja, as well as other information, including visualizations and statistics we provide. You are in charge of compliance with any dataset license and all other permissions. You are required to navigate datasets homepage and make sure that you can use it. In case of any questions, get in touch with us at hello@datasetninja.com.