Introduction #
The authors create dense pixel-level annotations for MOTSChallenge Dataset using a semi-automatic annotation procedure. They further annotated 4 of 7 sequences of the MOTChallenge 2017 training dataset. MOTSChallenge focuses on pedestrian in crowded scenes and is very challenging due to many occlusion cases, for which a pixel-wise description is especially beneficial.
Note, similar MOTSChallenge Dataset dataset is also available on the DatasetNinja.com:
Motivation
In recent years, significant strides have been made in the computer vision field, particularly with the advent of deep learning techniques. These advancements have led to remarkable performance improvements in tasks such as object detection and image segmentation. However, tracking multiple objects remains a challenging endeavor, especially as bounding box-level tracking performance appears to have reached a plateau in recent evaluations. To achieve further enhancements, transitioning to pixel-level tracking is deemed necessary. To address this challenge, the authors advocate for a holistic approach that considers detection, segmentation, and tracking as interconnected problems. Currently, datasets suitable for training and evaluating instance segmentation models typically lack annotations on video data or object identities across different frames. Conversely, common datasets for multiobject tracking primarily offer bounding box annotations, which may prove inadequate in scenarios involving partial occlusion, where bounding boxes may contain more information from surrounding objects than the target itself.
Segmentations vs. Bounding Boxes. When objects pass each other, large parts of an object’s bounding box may belong to another instance, while per-pixel segmentation masks locate objects precisely. The shown annotations are crops from the KITTI MOTS dataset.
In such scenarios, employing pixel-wise segmentation for object delineation offers a more faithful depiction of the scene, potentially enhancing subsequent processing stages. Unlike bounding boxes, segmentation masks provide a clearly defined ground truth, whereas bounding boxes may vary widely in their fit to an object. Moreover, tracks with overlapping bounding boxes introduce ambiguities during evaluation, often necessitating heuristic matching methods for resolution. In contrast, tracking results derived from segmentation-based approaches are inherently non-overlapping, facilitating a direct comparison with ground truth annotations. The authors have put forth a proposition to expand the conventional multi-object tracking task to include instance segmentation tracking. As far as current knowledge goes, there are no existing datasets tailored specifically for this task. While numerous methods for bounding box tracking are documented in the literature, achieving success in MOTS necessitates the integration of temporal and mask cues.
Dataset description
Creating pixel masks for every object in a video frame is an immensely time-consuming task, leading to limited availability of such data. Currently, there are no existing datasets tailored specifically for the MOTS (Multi-Object Tracking and Segmentation) task. However, some datasets do provide annotations at the bounding box level for MOT, lacking segmentation masks necessary for MOTS. To address this gap, the authors enhanced two MOT datasets by adding segmentation masks to the bounding boxes. In total, they annotated 65,213 segmentation masks, rendering the datasets suitable for training and evaluating modern learning-based techniques. To manage the annotation workload effectively, the authors devised a semi-automatic method to extend bounding box annotations with segmentation masks. This method involves an iterative process of generating and refining masks until achieving pixel-level accuracy for all annotation masks.
To convert bounding boxes into segmentation masks, the authors employed a fully convolutional refinement network utilizing DeepLabv3+. This network operates by taking a crop of the input image specified by the bounding box, alongside a small context region, and an additional input channel encoding the bounding box as a mask. Leveraging these inputs, the refinement network generates a segmentation mask corresponding to the provided box. Initially, the refinement network undergoes pre-training on COCO and Mapillary datasets, followed by further training on manually crafted segmentation masks specific to the target dataset. Initially, the authors annotate two segmentation masks per object in the dataset, delineated as polygons. The refinement network undergoes initial training using all manually created masks, followed by individual fine-tuning for each object. These fine-tuned iterations of the network are then applied to generate segmentation masks for all bounding boxes associated with the corresponding object in the dataset. This approach allows the network to adapt to the specific appearance and context of each object. Although the use of two manually annotated segmentation masks per object for fine-tuning generally yields satisfactory masks for the object’s appearances in other frames, minor errors may persist. Therefore, the authors manually correct some of the imperfectly generated masks and iterate the training procedure accordingly. Additionally, their annotators rectify imprecise or erroneous bounding box annotations present in the original MOT datasets.
Sample Images of the authors Annotations. KITTI MOTS (top) and MOTSChallenge (bottom).
The authors further annotated 4 of 7 sequences of the MOTChallenge 2017 training dataset and obtained the MOTSChallenge dataset. MOTSChallenge focuses on pedestrians in crowded scenes and is very challenging due to many occlusion cases, for which a pixel-wise
description is especially beneficial.
| KITTI and MOTS | MOTSChallenge | ||
|---|---|---|---|
| train | val | train | |
| Sequences | 12 | 9 | 4 |
| Frames | 5,027 | 2,981 | 2,862 |
| Tracks Pedestrian | 99 | 68 | 228 |
| Masks Pedestrian Total | 8,073 | 3,347 | 26,894 |
| Manually annotated | 1,312 | 647 | 3,930 |
| Tracks Car | 431 | 151 | - |
| Masks Car Total | 18,831 | 18,06851 | - |
| Manually annotated | 1,509 | 593 | - |
Statistics of the Introduced KITTI MOTS and MOTSChallenge Datasets.
Summary #
MOTSChallenge Dataset is a dataset for instance segmentation, semantic segmentation, object detection, and identification tasks. It is used in the automotive industry.
The dataset consists of 2862 images with 111232 labeled objects belonging to 2 different classes including pedestrian and ignore region.
Images in the MOTSChallenge dataset have pixel-level instance segmentation annotations. Due to the nature of the instance segmentation task, it can be automatically transformed into a semantic segmentation (only one mask for every class) or object detection (bounding boxes for every object) tasks. All images are labeled (i.e. with annotations). There is 1 split in the dataset: train (2862 images). Additionally, every image marked with its sequence tag. Every label contains information about its instance id and object id. Explore it in Supervisely labelling tool. The dataset was released in 2019 by the RWTH Aachen University, Germany, Max Plank Institute for Intelligent Systems, Germany, and University of Tubingen, Germany.

Explore #
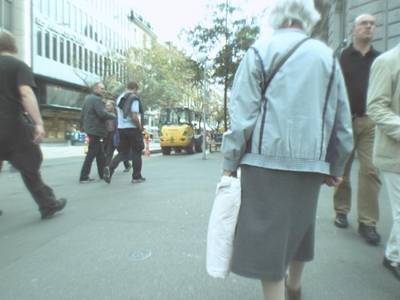
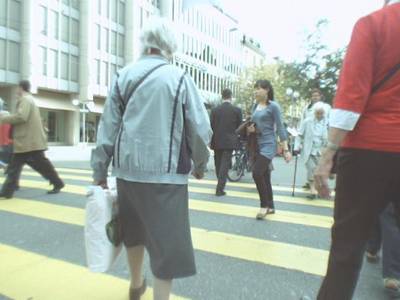
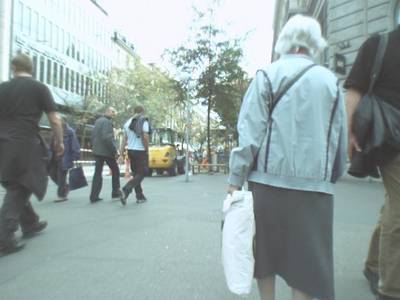
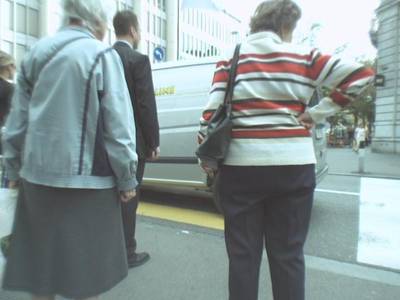
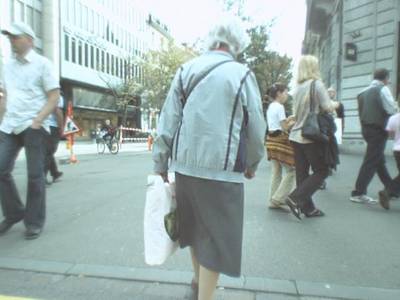
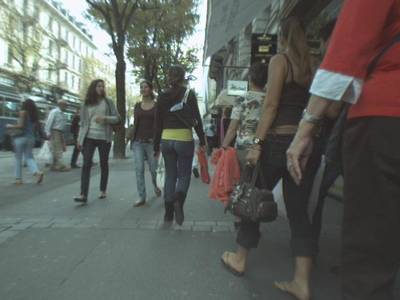
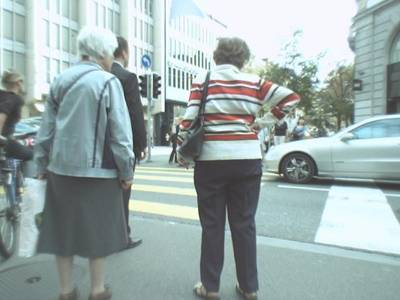
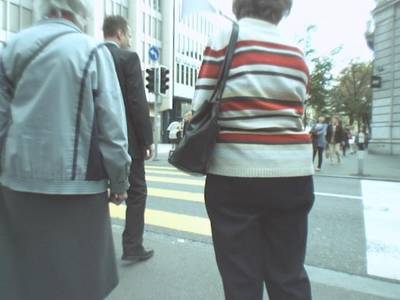
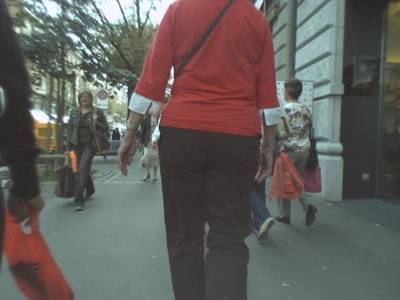
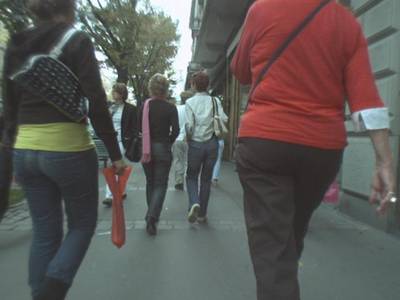
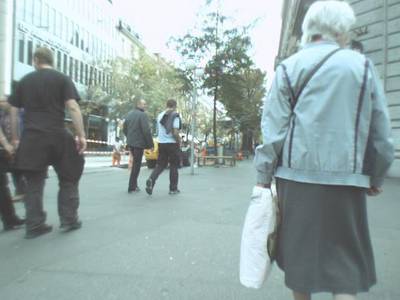
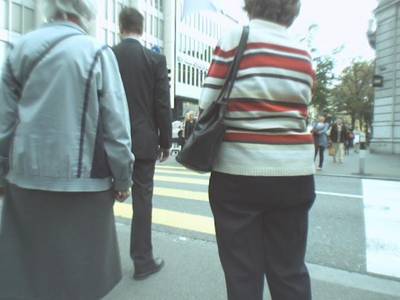
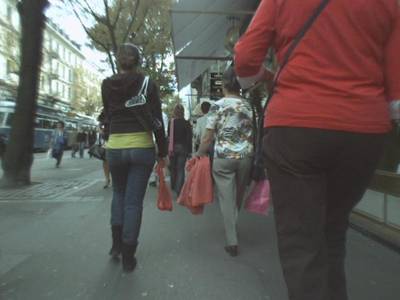
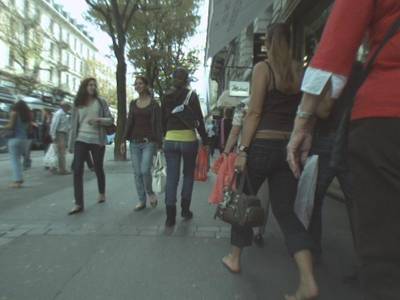
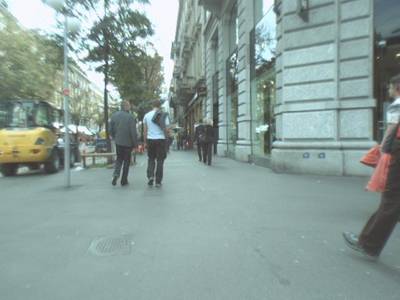
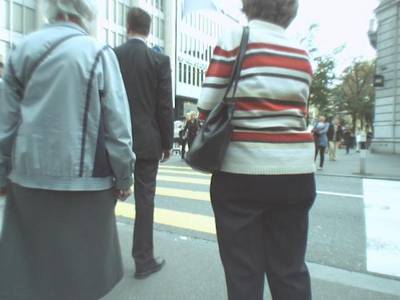
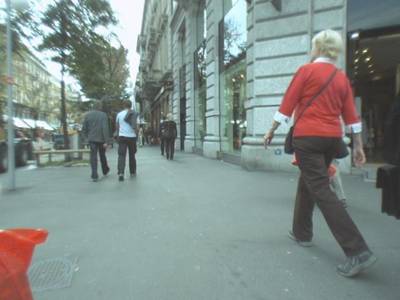
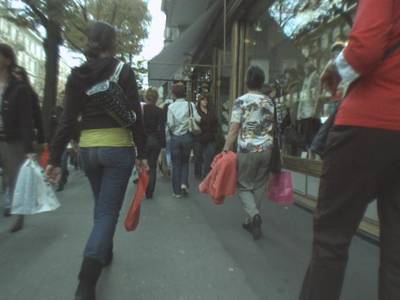
MOTSChallenge dataset has 2862 images. Click on one of the examples below or open "Explore" tool anytime you need to view dataset images with annotations. This tool has extended visualization capabilities like zoom, translation, objects table, custom filters and more. Hover the mouse over the images to hide or show annotations.









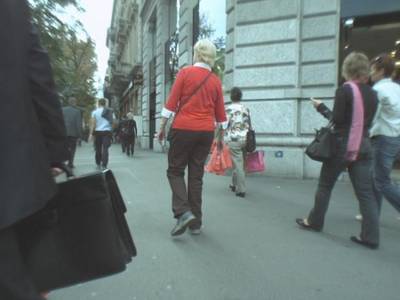

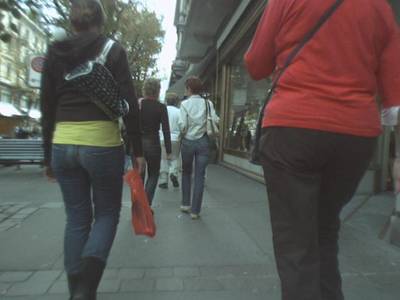

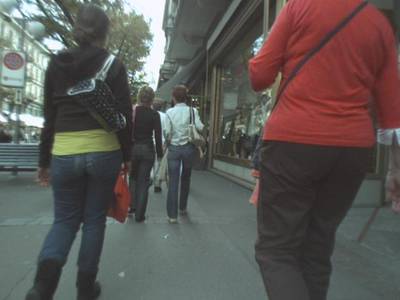

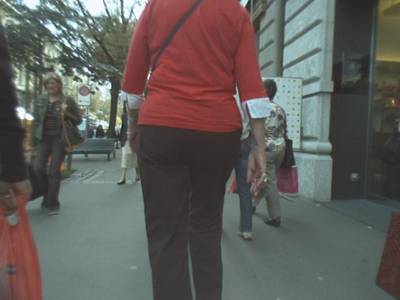





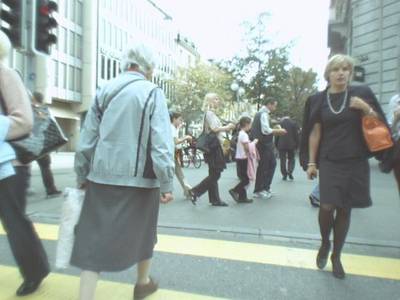

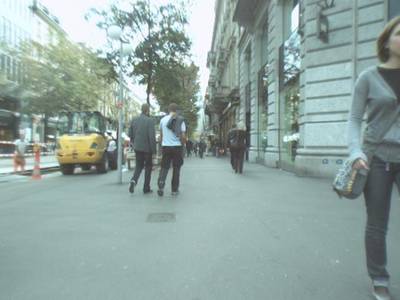

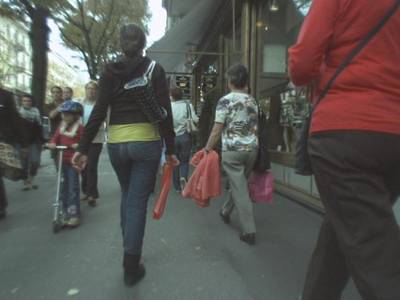

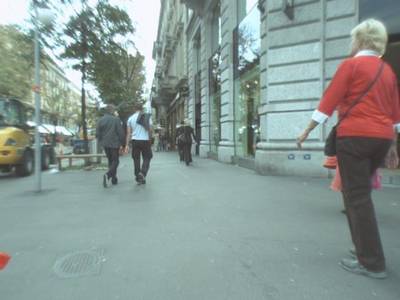

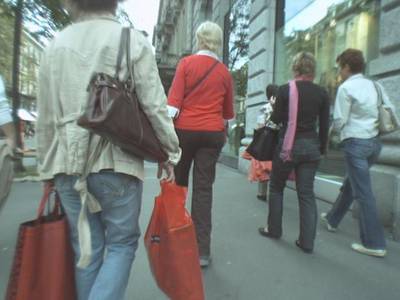

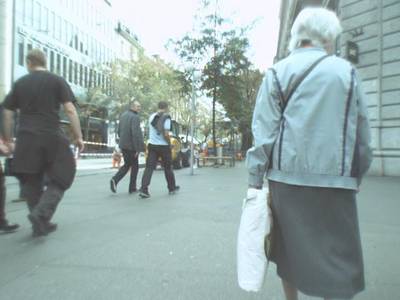

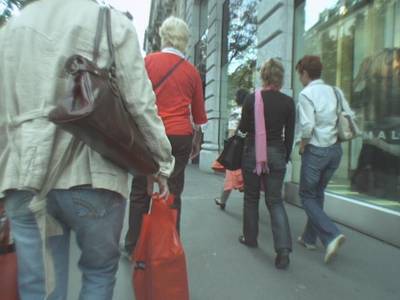

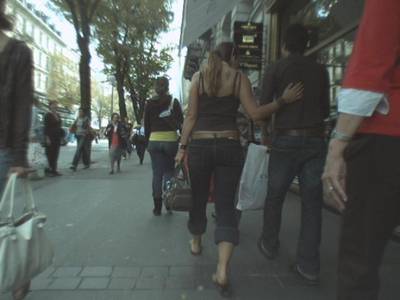






Class balance #
There are 2 annotation classes in the dataset. Find the general statistics and balances for every class in the table below. Click any row to preview images that have labels of the selected class. Sort by column to find the most rare or prevalent classes.
Class ㅤ | Images ㅤ | Objects ㅤ | Count on image average | Area on image average |
|---|---|---|---|---|
pedestrian➔ any | 2862 | 70742 | 24.72 | 35.13% |
ignore region➔ any | 2826 | 40490 | 14.33 | 3.68% |
Co-occurrence matrix #
Co-occurrence matrix is an extremely valuable tool that shows you the images for every pair of classes: how many images have objects of both classes at the same time. If you click any cell, you will see those images. We added the tooltip with an explanation for every cell for your convenience, just hover the mouse over a cell to preview the description.
Images #
Explore every single image in the dataset with respect to the number of annotations of each class it has. Click a row to preview selected image. Sort by any column to find anomalies and edge cases. Use horizontal scroll if the table has many columns for a large number of classes in the dataset.
Object distribution #
Interactive heatmap chart for every class with object distribution shows how many images are in the dataset with a certain number of objects of a specific class. Users can click cell and see the list of all corresponding images.
Class sizes #
The table below gives various size properties of objects for every class. Click a row to see the image with annotations of the selected class. Sort columns to find classes with the smallest or largest objects or understand the size differences between classes.
Class | Object count | Avg area | Max area | Min area | Min height | Min height | Max height | Max height | Avg height | Avg height | Min width | Min width | Max width | Max width |
|---|---|---|---|---|---|---|---|---|---|---|---|---|---|---|
pedestrian any | 70742 | 2.43% | 52.03% | 0% | 5px | 0.46% | 1080px | 100% | 236px | 26.86% | 3px | 0.16% | 792px | 52.03% |
ignore region any | 40490 | 0.45% | 28.22% | 0% | 4px | 0.37% | 1080px | 100% | 106px | 10.88% | 3px | 0.16% | 842px | 43.85% |
Spatial Heatmap #
The heatmaps below give the spatial distributions of all objects for every class. These visualizations provide insights into the most probable and rare object locations on the image. It helps analyze objects' placements in a dataset.

Objects #
Table contains all 100492 objects. Click a row to preview an image with annotations, and use search or pagination to navigate. Sort columns to find outliers in the dataset.
Object ID ㅤ | Class ㅤ | Image name click row to open | Image size height x width | Height ㅤ | Height ㅤ | Width ㅤ | Width ㅤ | Area ㅤ |
|---|---|---|---|---|---|---|---|---|
1➔ | pedestrian any | 0011_000899.jpg | 1080 x 1920 | 477px | 44.17% | 159px | 8.28% | 2.24% |
2➔ | pedestrian any | 0011_000899.jpg | 1080 x 1920 | 477px | 44.17% | 159px | 8.28% | 3.66% |
3➔ | pedestrian any | 0011_000899.jpg | 1080 x 1920 | 518px | 47.96% | 163px | 8.49% | 2.02% |
4➔ | pedestrian any | 0011_000899.jpg | 1080 x 1920 | 518px | 47.96% | 163px | 8.49% | 4.07% |
5➔ | pedestrian any | 0011_000899.jpg | 1080 x 1920 | 339px | 31.39% | 115px | 5.99% | 1.09% |
6➔ | pedestrian any | 0011_000899.jpg | 1080 x 1920 | 339px | 31.39% | 115px | 5.99% | 1.88% |
7➔ | pedestrian any | 0011_000899.jpg | 1080 x 1920 | 345px | 31.94% | 299px | 15.57% | 2.34% |
8➔ | pedestrian any | 0011_000899.jpg | 1080 x 1920 | 345px | 31.94% | 299px | 15.57% | 4.97% |
9➔ | pedestrian any | 0011_000899.jpg | 1080 x 1920 | 500px | 46.3% | 147px | 7.66% | 1.64% |
10➔ | pedestrian any | 0011_000899.jpg | 1080 x 1920 | 500px | 46.3% | 147px | 7.66% | 3.54% |
License #
MOTSChallenge Dataset is under CC BY-NC-SA 3.0 US license.
Citation #
If you make use of the MOTSChallenge data, please cite the following reference:
@inproceedings{Voigtlaender19CVPR_MOTS,
  author = {Paul Voigtlaender and Michael Krause and Aljo\u{s}a O\u{s}ep and Jonathon Luiten
           and Berin Balachandar Gnana Sekar and Andreas Geiger and Bastian Leibe},
  title = {{MOTS}: Multi-Object Tracking and Segmentation},
  booktitle = {CVPR},
  year = {2019},
}
If you are happy with Dataset Ninja and use provided visualizations and tools in your work, please cite us:
@misc{ visualization-tools-for-mots-challenge-dataset,
  title = { Visualization Tools for MOTSChallenge Dataset },
  type = { Computer Vision Tools },
  author = { Dataset Ninja },
  howpublished = { \url{ https://datasetninja.com/mots-challenge } },
  url = { https://datasetninja.com/mots-challenge },
  journal = { Dataset Ninja },
  publisher = { Dataset Ninja },
  year = { 2026 },
  month = { feb },
  note = { visited on 2026-02-05 },
}
Download #
Dataset MOTSChallenge can be downloaded in Supervisely format:
As an alternative, it can be downloaded with dataset-tools package:
pip install --upgrade dataset-tools
… using following python code:
import dataset_tools as dtools

dtools.download(dataset='MOTSChallenge', dst_dir='~/dataset-ninja/')
Make sure not to overlook the python code example available on the Supervisely Developer Portal. It will give you a clear idea of how to effortlessly work with the downloaded dataset.
The data in original format can be downloaded here.
Disclaimer #
Our gal from the legal dep told us we need to post this:
Dataset Ninja provides visualizations and statistics for some datasets that can be found online and can be downloaded by general audience. Dataset Ninja is not a dataset hosting platform and can only be used for informational purposes. The platform does not claim any rights for the original content, including images, videos, annotations and descriptions. Joint publishing is prohibited.
You take full responsibility when you use datasets presented at Dataset Ninja, as well as other information, including visualizations and statistics we provide. You are in charge of compliance with any dataset license and all other permissions. You are required to navigate datasets homepage and make sure that you can use it. In case of any questions, get in touch with us at hello@datasetninja.com.


