

Introduction #
The authors introduced the public MP-IDB: Malaria Parasite Image Dataset comprising blood samples infected with malaria. The dataset is meticulously crafted to facilitate the assessment and comparison of algorithms tailored for segmenting and classifying malaria parasite species. Each image is accompanied by its corresponding ground truth and classification detailing the type and stage of the parasite’s life cycle. The authors primary objective is to furnish a novel benchmarking resource to the image processing and pattern recognition communities, with the ultimate goal of fostering advancements in computer-assisted analysis of malaria parasites.
Motivation
Visual inspection of peripheral blood samples is a critical procedure conducted by skilled hematologists to diagnose pathologies and assess patients’ health conditions. However, manual analysis of blood smears is arduous, time-consuming, repetitive, and subject to variable precision due to operator proficiency. Leveraging image processing techniques can streamline cell analysis in human blood samples while offering accurate insights into cell morphology. Peripheral blood smear analysis serves as a widely used and cost-effective diagnostic method, providing valuable health insights to expert pathologists. Furthermore, blood cell images captured through microscopy may exhibit variations in illumination and coloration conditions, further emphasizing the need for automated analysis methods.
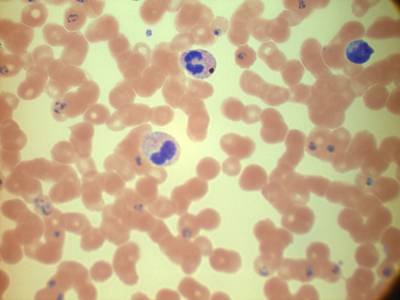
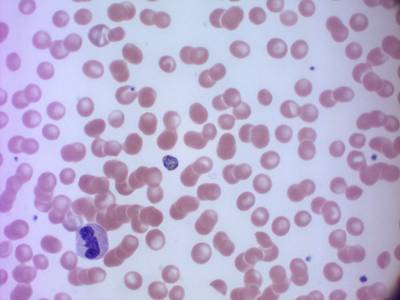
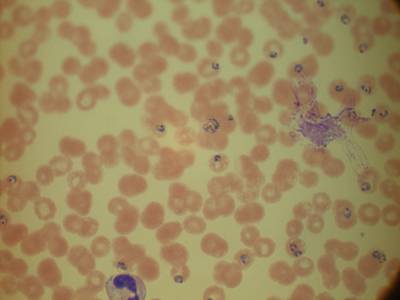
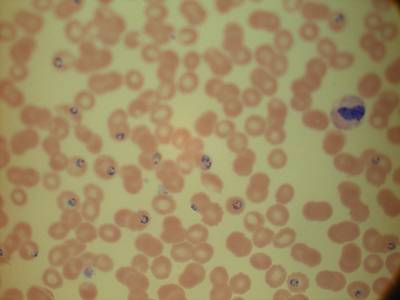
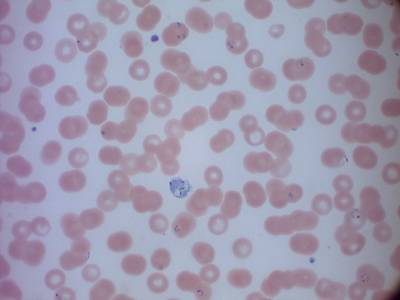
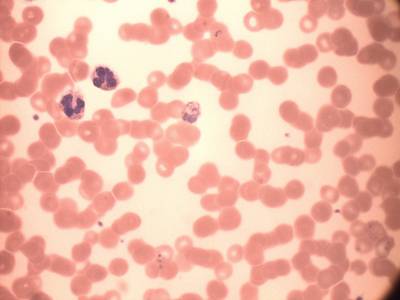
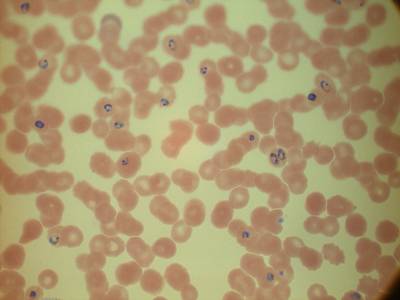
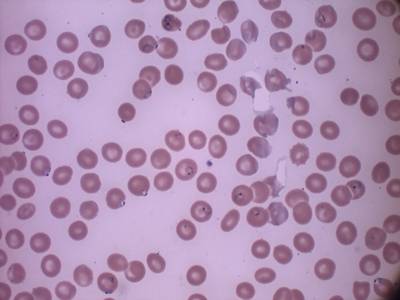
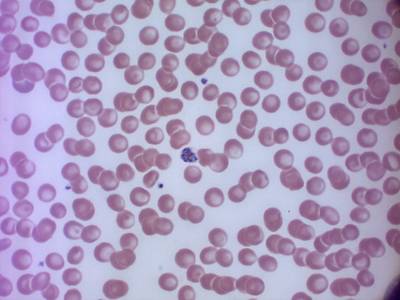
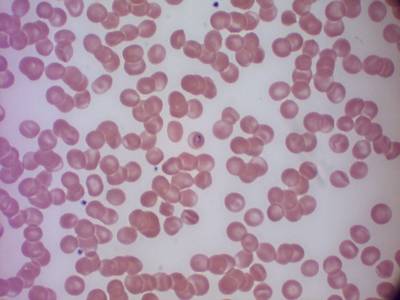
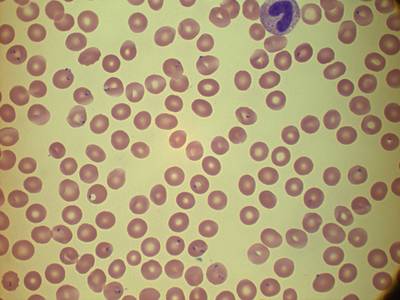
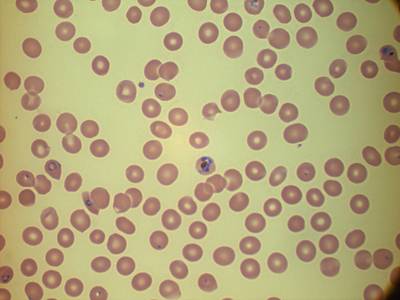
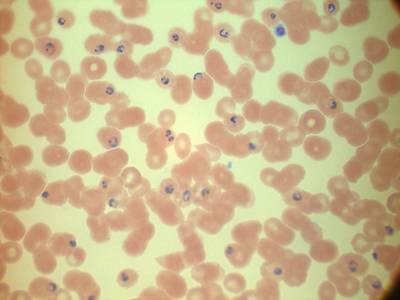
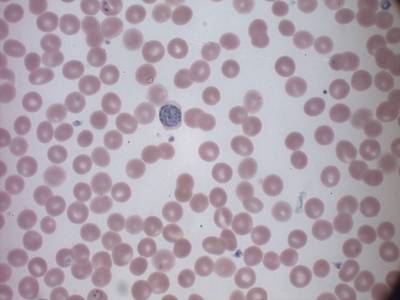
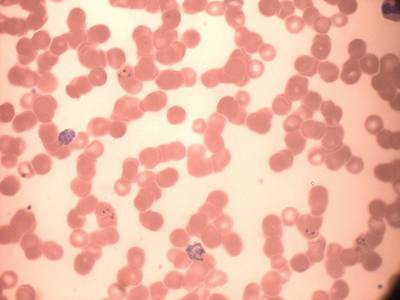
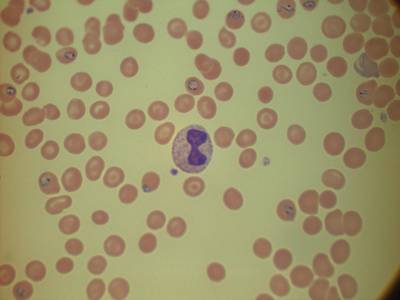
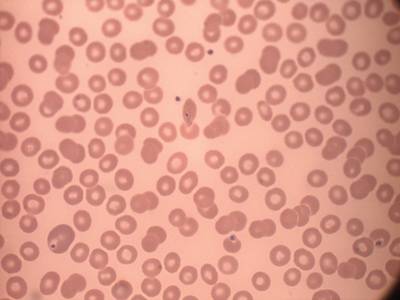
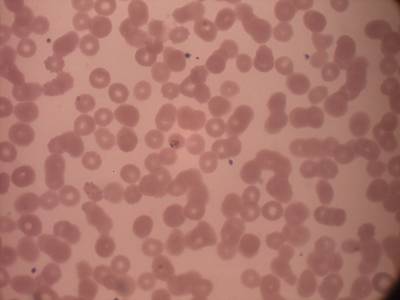
Different illumination conditions could generate unconventional colour schemes in images. This is due to the absence of a standardized acquisition procedure. From left to right: same smear acquired with four microscope brightness levels.
Blood cell images typically comprise three primary components: platelets (or thrombocytes), red blood cells (RBCs or erythrocytes), and white blood cells (WBCs or leukocytes). It’s important to note that these cells exhibit diverse shapes, characteristics, and colorations based on their types. Various tests, such as Complete Blood Count (CBC), are designed to ascertain the quantity of erythrocytes and leukocytes in the blood, along with parameters like volume, sedimentation rate, and hemoglobin concentration of red blood cells (blood count). Additionally, specific tests are employed to categorize blood based on particular red blood cell antigens or blood groups. CBC includes different calculations such as red blood cell count (RBCC) or white blood cell count (WBCC) per cubic millimeter of blood, a differential white blood cell count, hemoglobin assay, hematocrit, red cell volume calculations, and platelet count. Human malaria infection, caused by parasitic protozoans of the Plasmodium genus, necessitates distinct tests for identification. Transmission occurs through the bites of infected female Anopheles mosquitoes, known as malaria vectors. Among the five parasite species causing malaria in humans, Plasmodium falciparum and Plasmodium vivax pose the greatest threat, while Plasmodium ovale, Plasmodium malariae, and Plasmodium knowlesi are less perilous.
Morphological scheme of human malaria parasites types and stages of life.
Computer vision techniques have emerged as a promising frontier for early malaria detection and medical imaging, offering solutions to the challenges associated with manual analysis conducted through visual examination of blood smears. This approach entails distinguishing between non-parasitic stained components (such as red blood cells, white blood cells, platelets, and artifacts) and malarial parasites using visual cues. In cases where a blood sample is diagnosed as positive (indicating the presence of parasites), further capabilities are required to differentiate between species and life stages, thereby specifying the infection. Various automated methods for malaria diagnosis have been proposed to address these challenges, utilizing images extracted from blood smear pictures captured through microscopy following a staining process. Staining techniques, notably Giemsa and Leishman, play a crucial role, along with considerations regarding the thickness of the blood slide, which may be thin or thick. Thin smears typically enable the identification of specific parasitic stages and quantification of malaria parasites, whereas thick smears are preferable for the initial identification of malaria infection through blood pathology.
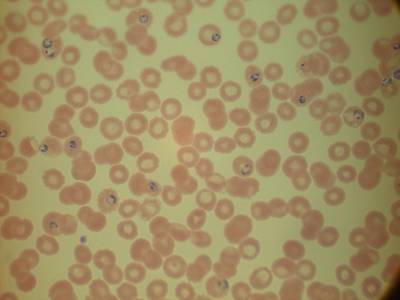
Malaria infected blood smears types. This image shows a comparison between staining colouration procedures and smears thickness. From left to right: thick smear with Giemsa stain, thin smear with Giemsa stain, thick smear with Leishman stain, thin smear with Leishman stain.
Dataset description
Automated analysis of malaria parasites in blood smears typically involves four distinct tasks:
- Image preprocessing: This step involves normalizing the coloration of the images, which can vary significantly from one image to another, and enhancing the contrast of different regions of interest.
- Segmentation: Algorithms are employed to separate red blood cells and/or parasites from the background and white blood cells. These algorithms utilize various cell characteristics such as shape, color, and texture.
- Feature extraction: Relevant characteristics, including shape, color, and texture, are extracted from different regions of interest to train an automatic parasite analyzer.
- Classification: Multiple classification schemes are utilized in a hierarchical manner. Initially, cells are categorized into red blood cells and white blood cells. Subsequently, red blood cells are classified based on whether they are affected by parasite(s) or not. Finally, parasites are classified according to their type and life stage. It’s important to note that parasites may also be present outside the cells, requiring a more specialized and dedicated analysis approach.
The dataset images were captured using a Leica DM2000 optical laboratory microscope at the Centre Hospitalier Universitaire Vaudois (CHUV), equipped with an integrated camera and software. This process was conducted under the supervision of seasoned radiologists, led by Dr. Guy Prod’Hom. Each image is stored in PNG format, with a resolution of 2592 × 1944 pixels and a color depth of 24 bits. All images were captured at a consistent magnification of 100×. The dataset comprises a total of 229 images, featuring four distinct types of malaria parasites: Plasmodium falciparum (122 images), Plasmodium malariae (37 images), Plasmodium ovale (29 images), and Plasmodium vivax (46 images). Each image contains at least one identifiable parasite. This dataset, curated by the authors, serves as a valuable resource for evaluating the segmentation capabilities of algorithms or classification systems. It encompasses approximately 48,000 blood cells, with malaria parasites meticulously labeled by expert radiologists. The Malaria Parasites Image Database (MP-IDB) contains a total of 840 annotated candidate parasites. Every image contain information about parasite life stages: ring stage, schizont stage, trophozoite stage and gametocyte stage.
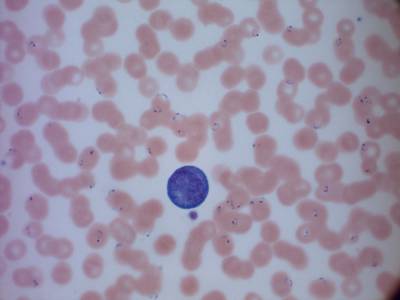
These dataset images were all captured using the same microscope. However, many of them exhibit various issues such as non-uniform background illumination and overexposed borders, resulting from the microscope lamp’s illumination. Additionally, differences in the coloration of regions of interest may arise due to the age of the analyzed smears. Consequently, it necessitates a rigorous pre-processing step to standardize the image conditions as closely as possible, facilitating automated procedures. While the images remain comprehensible, conventional segmentation methods, such as thresholding, may be impacted by these issues.
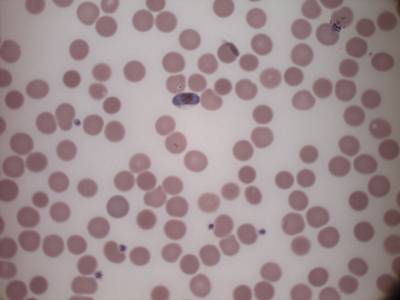
Types of malaria parasites: from top left, clockwise, P. Falciparum in its schizont stage, P. Vivax in a gametocytes specimen, P. Malariae in its schizont stage, P. Ovale in its ring stage. All parasites have been surrounded with a yellow box. Underneath, from left to right: crops of P. Falciparum schizont, P. Vivax gametocyte, P. Ovale ring and P. Malariae schizont, taken from the boxes.
 Homepage
 Research Paper
Summary #
MP-IDB: Malaria Parasite Image Dataset is a dataset for instance segmentation, semantic segmentation, object detection, and classification tasks. It is used in the medical industry.
The dataset consists of 210 images with 1407 labeled objects belonging to 4 different classes including falciparum, vivax, malariae, and other: ovale.
Images in the MP IDB dataset have pixel-level instance segmentation annotations. Due to the nature of the instance segmentation task, it can be automatically transformed into a semantic segmentation (only one mask for every class) or object detection (bounding boxes for every object) tasks. There is 1 unlabeled image (i.e. without annotations). There are no pre-defined train/val/test splits in the dataset. Alternatively, the dataset could be split into 4 parasites stages: ring stage (125 images), trophozoite stage (54 images), schizont stage (38 images), and gametocyte stage (26 images). The dataset was released in 2019 by the University of Cagliari, Italy, École Polytechnique Fédérale de Lausanne (EPFL), Switzerland, and University of Lausanne and University Hospital Center, Switzerland.
Explore #
MP IDB dataset has 210 images. Click on one of the examples below or open "Explore" tool anytime you need to view dataset images with annotations. This tool has extended visualization capabilities like zoom, translation, objects table, custom filters and more. Hover the mouse over the images to hide or show annotations.


Class balance #
There are 4 annotation classes in the dataset. Find the general statistics and balances for every class in the table below. Click any row to preview images that have labels of the selected class. Sort by column to find the most rare or prevalent classes.

Class ㅤ | Images ㅤ | Objects ㅤ | Count on image average | Area on image average |
|---|---|---|---|---|
falciparum➔ any | 103 | 1267 | 12.3 | 0.79% |
vivax➔ mask | 40 | 64 | 1.6 | 0.35% |
malariae➔ mask | 37 | 43 | 1.16 | 0.14% |
ovale➔ mask | 29 | 33 | 1.14 | 0.22% |
Co-occurrence matrix #
Co-occurrence matrix is an extremely valuable tool that shows you the images for every pair of classes: how many images have objects of both classes at the same time. If you click any cell, you will see those images. We added the tooltip with an explanation for every cell for your convenience, just hover the mouse over a cell to preview the description.
Images #
Explore every single image in the dataset with respect to the number of annotations of each class it has. Click a row to preview selected image. Sort by any column to find anomalies and edge cases. Use horizontal scroll if the table has many columns for a large number of classes in the dataset.
Object distribution #
Interactive heatmap chart for every class with object distribution shows how many images are in the dataset with a certain number of objects of a specific class. Users can click cell and see the list of all corresponding images.
Class sizes #
The table below gives various size properties of objects for every class. Click a row to see the image with annotations of the selected class. Sort columns to find classes with the smallest or largest objects or understand the size differences between classes.
Class | Object count | Avg area | Max area | Min area | Min height | Min height | Max height | Max height | Avg height | Avg height | Min width | Min width | Max width | Max width |
|---|---|---|---|---|---|---|---|---|---|---|---|---|---|---|
falciparum any | 1267 | 0.06% | 0.46% | 0% | 12px | 0.62% | 194px | 9.98% | 62px | 3.18% | 13px | 0.5% | 224px | 8.64% |
vivax mask | 64 | 0.22% | 0.59% | 0% | 8px | 0.41% | 223px | 11.47% | 114px | 5.85% | 9px | 0.35% | 202px | 7.79% |
malariae mask | 43 | 0.12% | 0.23% | 0.02% | 36px | 1.85% | 135px | 6.94% | 93px | 4.8% | 45px | 1.74% | 132px | 5.09% |
ovale mask | 33 | 0.19% | 0.41% | 0.05% | 63px | 3.24% | 173px | 8.9% | 111px | 5.7% | 57px | 2.2% | 193px | 7.45% |
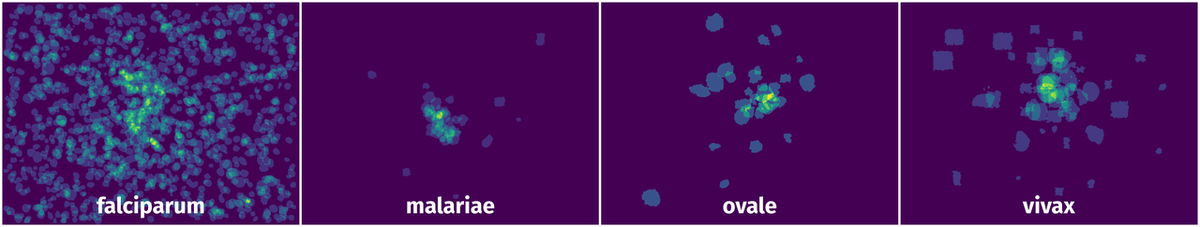
Spatial Heatmap #
The heatmaps below give the spatial distributions of all objects for every class. These visualizations provide insights into the most probable and rare object locations on the image. It helps analyze objects' placements in a dataset.
Objects #
Table contains all 1407 objects. Click a row to preview an image with annotations, and use search or pagination to navigate. Sort columns to find outliers in the dataset.
Object ID ㅤ | Class ㅤ | Image name click row to open | Image size height x width | Height ㅤ | Height ㅤ | Width ㅤ | Width ㅤ | Area ㅤ |
|---|---|---|---|---|---|---|---|---|
1➔ | vivax mask | 1703121298-0012-G_R.jpg | 1944 x 2592 | 159px | 8.18% | 180px | 6.94% | 0.48% |
2➔ | vivax mask | 1703121298-0012-G_R.jpg | 1944 x 2592 | 80px | 4.12% | 108px | 4.17% | 0.12% |
3➔ | vivax mask | 1709041080-0021-R_T.jpg | 1944 x 2592 | 87px | 4.48% | 70px | 2.7% | 0.08% |
4➔ | vivax mask | 1709041080-0021-R_T.jpg | 1944 x 2592 | 82px | 4.22% | 112px | 4.32% | 0.1% |
5➔ | falciparum any | 1704282807-0012-R_T.jpg | 1944 x 2592 | 48px | 2.47% | 57px | 2.2% | 0.04% |
6➔ | falciparum any | 1704282807-0012-R_T.jpg | 1944 x 2592 | 54px | 2.78% | 69px | 2.66% | 0.05% |
7➔ | falciparum any | 1704282807-0012-R_T.jpg | 1944 x 2592 | 63px | 3.24% | 88px | 3.4% | 0.06% |
8➔ | falciparum any | 1704282807-0012-R_T.jpg | 1944 x 2592 | 70px | 3.6% | 74px | 2.85% | 0.07% |
9➔ | falciparum any | 1704282807-0012-R_T.jpg | 1944 x 2592 | 60px | 3.09% | 56px | 2.16% | 0.05% |
10➔ | falciparum any | 1704282807-0012-R_T.jpg | 1944 x 2592 | 55px | 2.83% | 58px | 2.24% | 0.05% |
License #
Citation #
If you make use of the MP IDB data, please cite the following reference:
@InProceedings{10.1007/978-3-030-13835-6_7,
  author="Loddo, Andrea and Di Ruberto, Cecilia and Kocher, Michel and Prod'Hom, Guy",
  editor="Lepore, Natasha and Brieva, Jorge and Romero, Eduardo and Racoceanu, Daniel and Joskowicz, Leo",
  title="MP-IDB: The Malaria Parasite Image Database for Image Processing and Analysis",
  booktitle="Processing and Analysis of Biomedical Information",
  year="2019", publisher="Springer International Publishing",
  address="Cham",
  pages="57--65",
  isbn="978-3-030-13835-6"
  }
If you are happy with Dataset Ninja and use provided visualizations and tools in your work, please cite us:
@misc{ visualization-tools-for-mp-idb-dataset,
  title = { Visualization Tools for MP IDB Dataset },
  type = { Computer Vision Tools },
  author = { Dataset Ninja },
  howpublished = { \url{ https://datasetninja.com/mp-idb } },
  url = { https://datasetninja.com/mp-idb },
  journal = { Dataset Ninja },
  publisher = { Dataset Ninja },
  year = { 2026 },
  month = { jul },
  note = { visited on 2026-07-22 },
}
Download #
Dataset MP IDB can be downloaded in Supervisely format:
As an alternative, it can be downloaded with dataset-tools package:
pip install --upgrade dataset-tools
… using following python code:
import dataset_tools as dtools

dtools.download(dataset='MP IDB', dst_dir='~/dataset-ninja/')
Make sure not to overlook the python code example available on the Supervisely Developer Portal. It will give you a clear idea of how to effortlessly work with the downloaded dataset.
The data in original format can be downloaded here.
Disclaimer #
Our gal from the legal dep told us we need to post this:
Dataset Ninja provides visualizations and statistics for some datasets that can be found online and can be downloaded by general audience. Dataset Ninja is not a dataset hosting platform and can only be used for informational purposes. The platform does not claim any rights for the original content, including images, videos, annotations and descriptions. Joint publishing is prohibited.
You take full responsibility when you use datasets presented at Dataset Ninja, as well as other information, including visualizations and statistics we provide. You are in charge of compliance with any dataset license and all other permissions. You are required to navigate datasets homepage and make sure that you can use it. In case of any questions, get in touch with us at hello@datasetninja.com.