

Introduction #
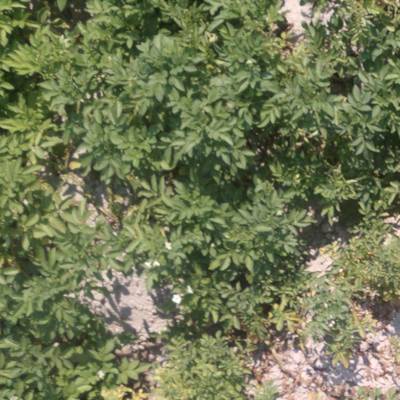
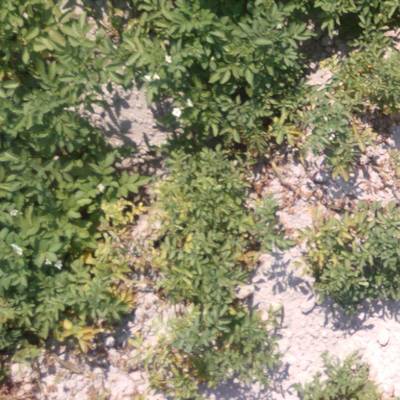
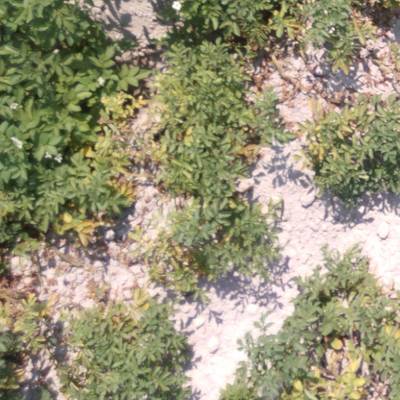
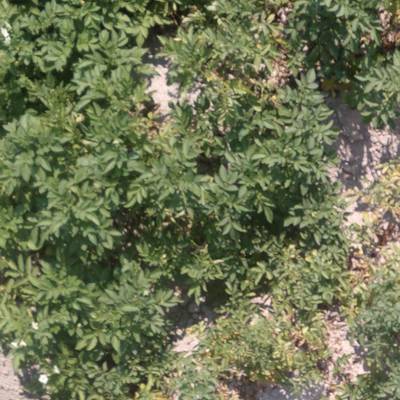
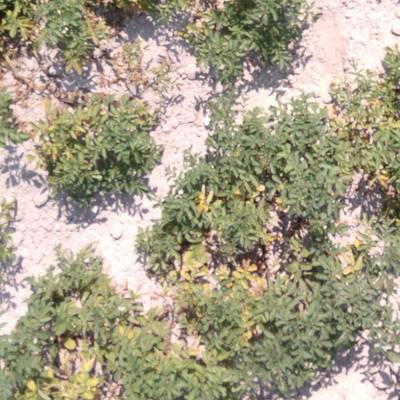
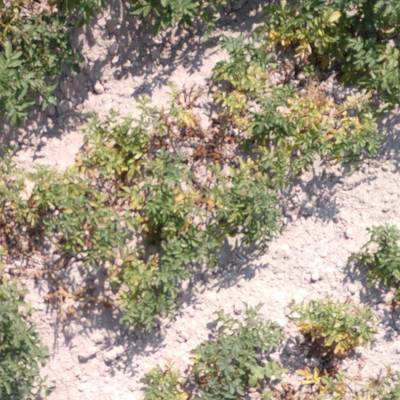
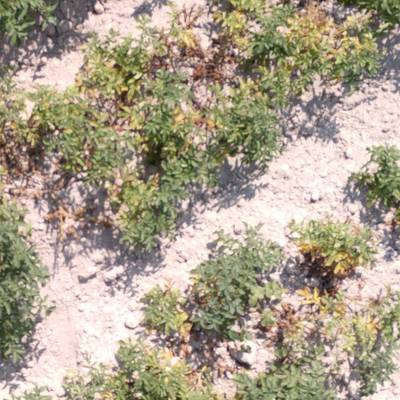
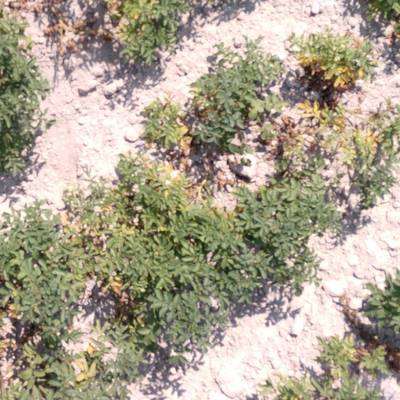
The Multispectral Potato Plants Images dataset contains aerial images of potato crops and can be utilized for training machine learning models for crop health assessment in precision agriculture applications. It comprises 360 RGB image patches of size 750×750 pixels in JPG format, divided into a train subset of 300 images and a test subset of 60 images. These image patches were extracted from the aerial high-resolution images through cropping, rotating, and resizing operations.
The images were gathered from a field located at the Aberdeen Research and Extension Center - University of Idaho. A Parrot Sequoia multispectral camera mounted on a 3DR Solo drone was employed for image acquisition. Sequoia features several sensors: an RGB sensor with 4,608×3,456 pixels (16 Megapixels) resolution, and four monochrome sensors with 1,280×960 pixels (1.2 Megapixels) resolution capturing narrow bands of light wavelengths: green (550 nm), red (660 nm), red-edge (735 nm), and near-infrared (790 nm). These images were collected as the drone flew over the potato field at a low altitude of 3 meters (≈10 feet). The primary aim was to capture drought stress in Russet Burbank potato plants due to premature plant senescence.
Each image is accompanied by ground-truth annotations (provided as both XML and CSV files) pertaining to regions with healthy and stressed plants, delineated in the images with rectangular bounding boxes. The crop regions were manually labeled into two classes, healthy and stressed, using the graphical annotation software LabelImg. It’s important to note that the testing subset of images is independent of the training subset, meaning that the image patches used for model testing were extracted from different aerial images. The dataset also incorporates corresponding image patches of the spectral sensors with red, green, red-edge, and near-infrared bands, each with a size of 416×416 pixels.
This dataset is well-suited for training machine learning algorithms to assess crop health in a field by detecting healthy vs. stressed plants. The dataset was carefully designed to provide images containing a balanced representation of both healthy and stressed crop classes. However, it’s worth acknowledging that a limitation of the dataset is its relatively small size. Consequently, it is strongly recommended to apply data augmentation and/or transfer learning techniques. For instance, the second dataset mentioned below employs image augmentation techniques, including rescaling pixel intensity, adjusting gamma values for brightness, modifying sigmoid values for contrast, and introducing random noise to the images. By using data augmentation, the initial training set was expanded to 1,500 images, while data augmentation was not applied to the testing set.
 Homepage
 Research Paper
Summary #
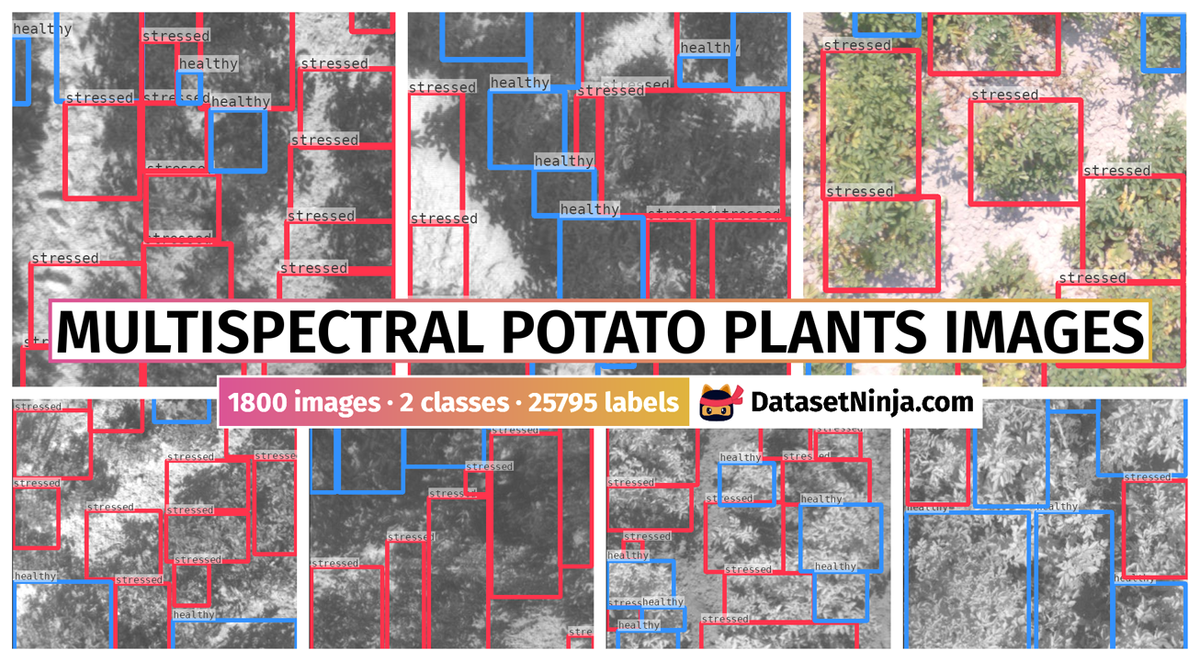
A Dataset of Multispectral Potato Plants Images is a dataset for object detection and identification tasks. It is used in the agricultural industry.
The dataset consists of 1800 images with 25795 labeled objects belonging to 2 different classes including healthy and stressed.
Images in the Multispectral Potato Plants Images dataset have bounding box annotations. All images are labeled (i.e. with annotations). There are 2 splits in the dataset: train (1500 images) and test (300 images). Additionally, all images are grouped by their image_id. Explore them in supervisely advanced labeling tool. The dataset was released in 2021 by the University of Idaho, USA.
Explore #
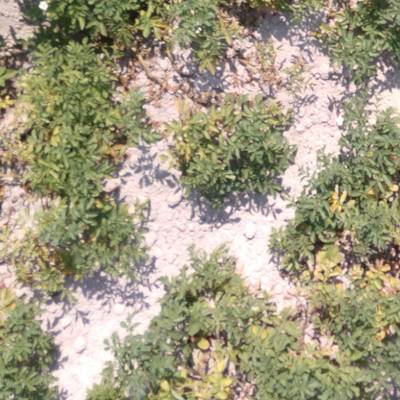
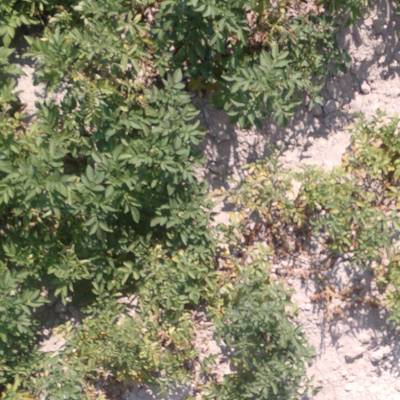
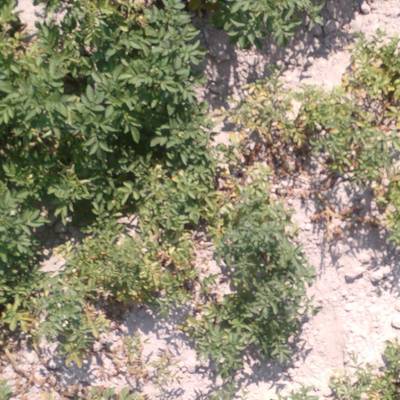
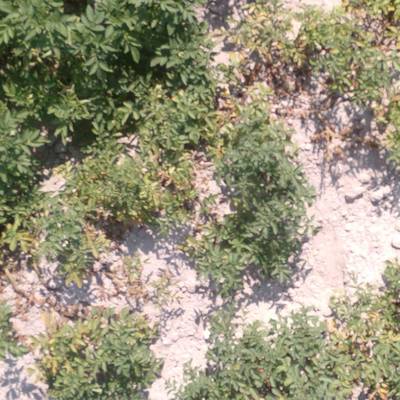
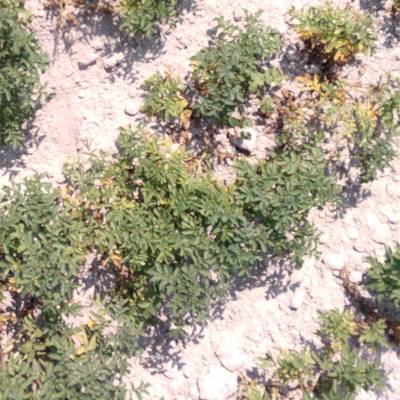
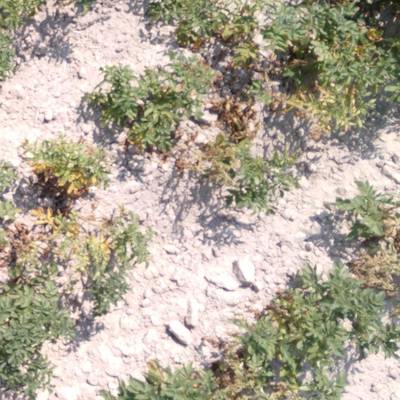
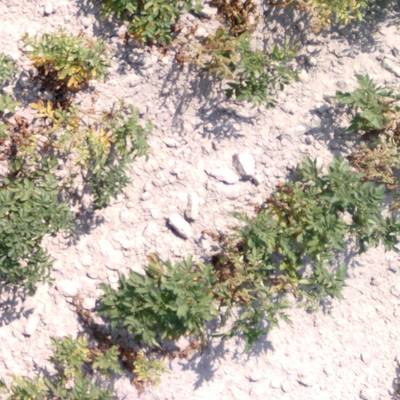
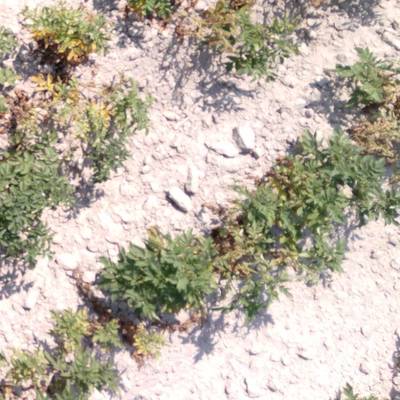
Multispectral Potato Plants Images dataset has 1800 images. Click on one of the examples below or open "Explore" tool anytime you need to view dataset images with annotations. This tool has extended visualization capabilities like zoom, translation, objects table, custom filters and more. Hover the mouse over the images to hide or show annotations.


Class balance #
There are 2 annotation classes in the dataset. Find the general statistics and balances for every class in the table below. Click any row to preview images that have labels of the selected class. Sort by column to find the most rare or prevalent classes.

Class ㅤ | Images ㅤ | Objects ㅤ | Count on image average | Area on image average |
|---|---|---|---|---|
healthy➔ rectangle | 1795 | 10205 | 5.69 | 31.8% |
stressed➔ rectangle | 1775 | 15590 | 8.78 | 41.69% |
Co-occurrence matrix #
Co-occurrence matrix is an extremely valuable tool that shows you the images for every pair of classes: how many images have objects of both classes at the same time. If you click any cell, you will see those images. We added the tooltip with an explanation for every cell for your convenience, just hover the mouse over a cell to preview the description.
Images #
Explore every single image in the dataset with respect to the number of annotations of each class it has. Click a row to preview selected image. Sort by any column to find anomalies and edge cases. Use horizontal scroll if the table has many columns for a large number of classes in the dataset.
Object distribution #
Interactive heatmap chart for every class with object distribution shows how many images are in the dataset with a certain number of objects of a specific class. Users can click cell and see the list of all corresponding images.
Class sizes #
The table below gives various size properties of objects for every class. Click a row to see the image with annotations of the selected class. Sort columns to find classes with the smallest or largest objects or understand the size differences between classes.
Class | Object count | Avg area | Max area | Min area | Min height | Min height | Max height | Max height | Avg height | Avg height | Min width | Min width | Max width | Max width |
|---|---|---|---|---|---|---|---|---|---|---|---|---|---|---|
stressed rectangle | 15590 | 4.77% | 24.94% | 0.24% | 14px | 3.33% | 546px | 73.08% | 102px | 21.1% | 16px | 3.73% | 609px | 81.25% |
healthy rectangle | 10205 | 5.6% | 63.94% | 0.21% | 9px | 2% | 742px | 99.04% | 110px | 22.71% | 14px | 3.33% | 749px | 100% |
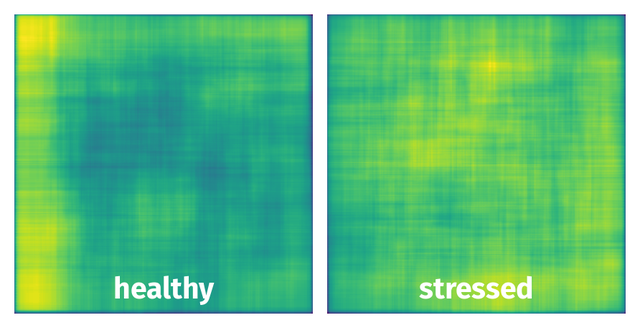
Spatial Heatmap #
The heatmaps below give the spatial distributions of all objects for every class. These visualizations provide insights into the most probable and rare object locations on the image. It helps analyze objects' placements in a dataset.
Objects #
Table contains all 25795 objects. Click a row to preview an image with annotations, and use search or pagination to navigate. Sort columns to find outliers in the dataset.
Object ID ㅤ | Class ㅤ | Image name click row to open | Image size height x width | Height ㅤ | Height ㅤ | Width ㅤ | Width ㅤ | Area ㅤ |
|---|---|---|---|---|---|---|---|---|
1➔ | healthy rectangle | Red_Channel_Image_049.jpg | 416 x 416 | 92px | 22.12% | 57px | 13.7% | 3.03% |
2➔ | healthy rectangle | Red_Channel_Image_049.jpg | 416 x 416 | 75px | 18.03% | 102px | 24.52% | 4.42% |
3➔ | healthy rectangle | Red_Channel_Image_049.jpg | 416 x 416 | 45px | 10.82% | 95px | 22.84% | 2.47% |
4➔ | stressed rectangle | Red_Channel_Image_049.jpg | 416 x 416 | 122px | 29.33% | 69px | 16.59% | 4.86% |
5➔ | stressed rectangle | Red_Channel_Image_049.jpg | 416 x 416 | 117px | 28.12% | 68px | 16.35% | 4.6% |
6➔ | stressed rectangle | Red_Channel_Image_049.jpg | 416 x 416 | 27px | 6.49% | 68px | 16.35% | 1.06% |
7➔ | stressed rectangle | Red_Channel_Image_049.jpg | 416 x 416 | 62px | 14.9% | 113px | 27.16% | 4.05% |
8➔ | stressed rectangle | Red_Channel_Image_049.jpg | 416 x 416 | 76px | 18.27% | 110px | 26.44% | 4.83% |
9➔ | stressed rectangle | Red_Channel_Image_049.jpg | 416 x 416 | 105px | 25.24% | 55px | 13.22% | 3.34% |
10➔ | stressed rectangle | Red_Channel_Image_049.jpg | 416 x 416 | 73px | 17.55% | 114px | 27.4% | 4.81% |
License #
The dataset is posted for open public access, and can be accessed from the following website
Citation #
If you make use of the Multispectral Potato Plants Images data, please cite the following reference:
@dataset{Multispectral Potato Plants Images,
  author={Sujata Butte and Aleksandar Vakanski and Kasia Duellman and Haotian Wang and Amin Mirkouei},
  title={A Dataset of Multispectral Potato Plants Images},
  year={2021},
  url={https://www.webpages.uidaho.edu/vakanski/Multispectral_Images_Dataset.html}
}
If you are happy with Dataset Ninja and use provided visualizations and tools in your work, please cite us:
@misc{ visualization-tools-for-multispectral-potato-plants-images-dataset,
  title = { Visualization Tools for Multispectral Potato Plants Images Dataset },
  type = { Computer Vision Tools },
  author = { Dataset Ninja },
  howpublished = { \url{ https://datasetninja.com/multispectral-potato-plants-images } },
  url = { https://datasetninja.com/multispectral-potato-plants-images },
  journal = { Dataset Ninja },
  publisher = { Dataset Ninja },
  year = { 2026 },
  month = { jul },
  note = { visited on 2026-07-30 },
}
Download #
Dataset Multispectral Potato Plants Images can be downloaded in Supervisely format:
As an alternative, it can be downloaded with dataset-tools package:
pip install --upgrade dataset-tools
… using following python code:
import dataset_tools as dtools

dtools.download(dataset='Multispectral Potato Plants Images', dst_dir='~/dataset-ninja/')
Make sure not to overlook the python code example available on the Supervisely Developer Portal. It will give you a clear idea of how to effortlessly work with the downloaded dataset.
The data in original format can be downloaded here:
Disclaimer #
Our gal from the legal dep told us we need to post this:
Dataset Ninja provides visualizations and statistics for some datasets that can be found online and can be downloaded by general audience. Dataset Ninja is not a dataset hosting platform and can only be used for informational purposes. The platform does not claim any rights for the original content, including images, videos, annotations and descriptions. Joint publishing is prohibited.
You take full responsibility when you use datasets presented at Dataset Ninja, as well as other information, including visualizations and statistics we provide. You are in charge of compliance with any dataset license and all other permissions. You are required to navigate datasets homepage and make sure that you can use it. In case of any questions, get in touch with us at hello@datasetninja.com.