

Introduction #
The authors of the MVTec AD: the MVTec Anomaly Detection dataset addressed the critical task of detecting anomalous structures within natural image data, a crucial aspect of computer vision applications. To facilitate the development of methods for unsupervised anomaly detection, they introduced the MVTec AD dataset, comprising 5354 high-resolution color images encompassing various object and texture categories. The dataset comprises both normal images, intended for training, and images with anomalies, designed for testing. These anomalies manifest in over 70 distinct types of defects, including scratches, dents, contaminations, and structural alterations. The authors also provided pixel-precise ground truth annotations for all anomalies.
The ability to recognize novel or anomalous images is a strength of human perception. However, machine learning systems often struggle with such tasks. There is a significant need for unsupervised algorithms capable of detecting anomalous regions, particularly in fields like manufacturing where supervised training samples are limited or the nature of defects is uncertain.
In this context, the authors identified the importance of datasets for anomaly detection and introduced the MVTec Anomaly Detection dataset to bridge this gap. They chose industrial inspection tasks as a suitable use case for the dataset, where defect-free images are employed for model training, and the model must detect anomalies during testing. The scarcity of defective samples in industrial processes makes unsupervised methods essential for accurate anomaly detection.
The MVTec Anomaly Detection dataset comprises 15 categories containing 3629 training images and 1725 testing images. Training images lack defects, while the testing set contains both defect-free images and images with various anomalies. Five categories cover different types of regular (carpet, grid) or random (leather, tile, wood) textures, while the remaining ten categories represent various types of objects. Some of these objects are rigid with a fixed appearance (bottle, metal_nut), while others are deformable (cable) or include natural variations (hazelnut). A subset of objects was acquired in a roughly aligned pose (e.g., toothbrush, capsule, and pill) while others were placed in front of the camera with a random rotation (e.g., metal_nut, screw, and hazelnut). The test images of anomalous samples contain a variety of defects, such as defects on the objects’ surface (e.g., scratches, dents), structural anomalies like distorted object parts, or defects that manifest themselves in the absence of certain object parts. In total, 73 different defect types are present, on average five per category.
All images were acquired using a 2048×2048 pixel high-resolution industrial RGB sensor in combination with two bilateral telecentric lenses with magnification factors of 1:5 and 1:1, respectively. Afterward, the images were cropped to a suitable output size. All image resolutions are in the range between 700×700 and 1024×1024 pixels. Each dataset image shows a unique physical sample. The authors did not augment images by taking multiple pictures of the same object in different poses. Since gray-scale images are also common in industrial inspection, three object categories (grid, screw, and zipper) are made available solely as single-channel images. The images were acquired under highly controlled illumination conditions. For some object classes, however, the illumination was altered intentionally to increase variability.
The pixel-precise ground truth labels were provided for each defective image region. In total, the dataset contains 1888 anomalous regions. All regions were carefully annotated and reviewed by the authors. During the acquisition of the dataset, the authors generated defects that were confined to local regions, which facilitated precise labeling of each anomaly. Additionally, pixels on the border of anomalies or lying in ambiguous regions were preferably labeled as anomalous. For locally deformed objects, annotations were created on the deformed area as well as in the region where the deformed object part is expected to be located. Some defects manifest themselves as missing parts. In these cases, the expected location of the part as anomalous was annotated.
 Homepage
 Research Paper 1 (main)Research Paper 2
Summary #
MVTec AD: the MVTec Anomaly Detection is a dataset for instance segmentation, semantic segmentation, object detection, classification, and unsupervised learning tasks. It is used in the anomaly detection research. Possible applications of the dataset could be in the industrial domain.
The dataset consists of 5354 images with 1888 labeled objects belonging to 48 different classes including color, scratch, crack, and other: combined, cut, hole, contamination, faulty_imprint, poke, bent, rough, thread, glue, defective, metal_contamination, scratch_neck, manipulated_front, scratch_head, thread_top, thread_side, flip, broken_small, squeeze, broken_large, broken_teeth, split_teeth, oil, glue_strip, print, fabric_border, fold, squeezed_teeth, fabric_interior, gray_stroke, cut_inner_insulation, bent_wire, missing_cable, cable_swap, broken, bent_lead, damaged_case, misplaced, cut_lead, poke_insulation, cut_outer_insulation, missing_wire, liquid, and pill_type.
Images in the MVTec AD dataset have pixel-level instance segmentation annotations. Due to the nature of the instance segmentation task, it can be automatically transformed into a semantic segmentation (only one mask for every class) or object detection (bounding boxes for every object) tasks. There are 4096 (77% of the total) unlabeled images (i.e. without annotations). There are 2 splits in the dataset: train (3629 images) and test (1725 images). Alternatively, the dataset could be split into 15 categories: hazelnut (501 images), screw (480 images), pill (434 images), carpet (397 images), zipper (391 images), cable (374 images), leather (369 images), capsule (351 images), tile (347 images), grid (342 images), metal_nut (335 images), wood (326 images), transistor (313 images), bottle (292 images), and toothbrush (102 images). Additionally, there are 4096 good images with no defects provided for classification purposes. The dataset was released in 2019 by the MVTec Software GmbH, Germany.
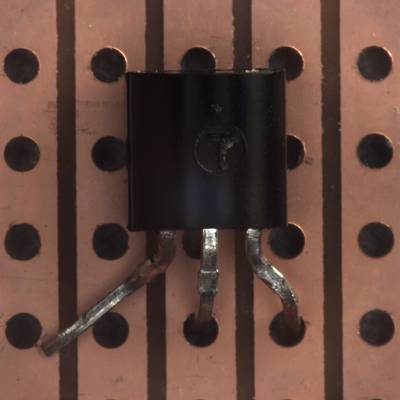
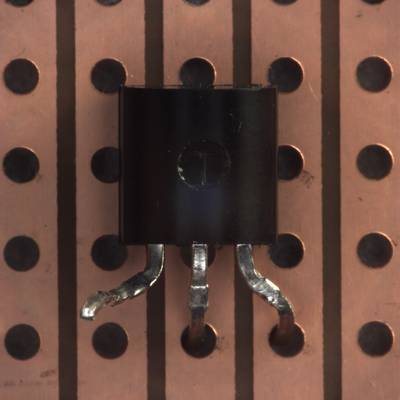
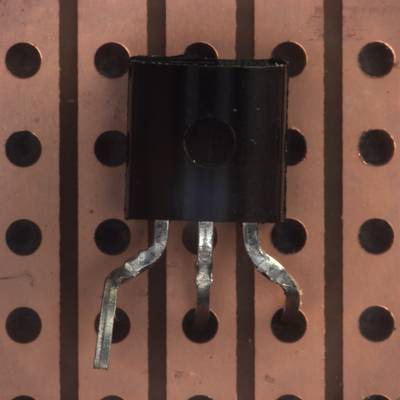
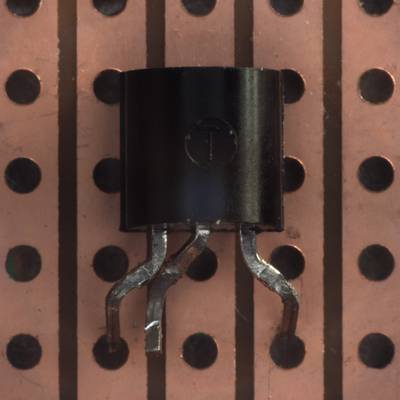
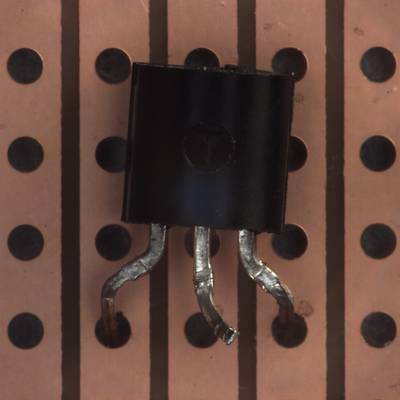
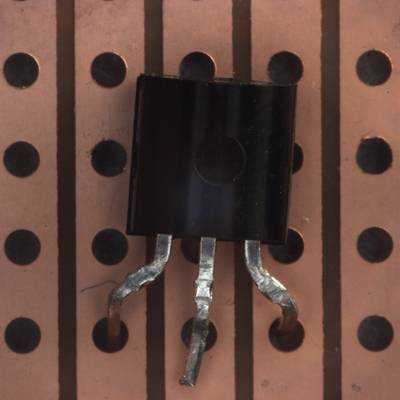
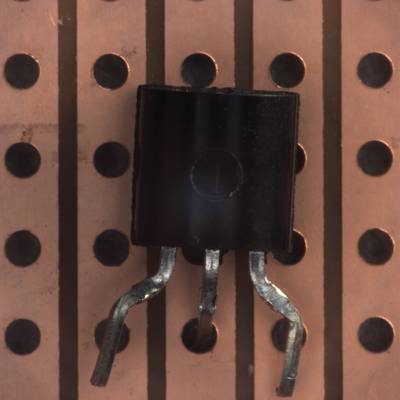
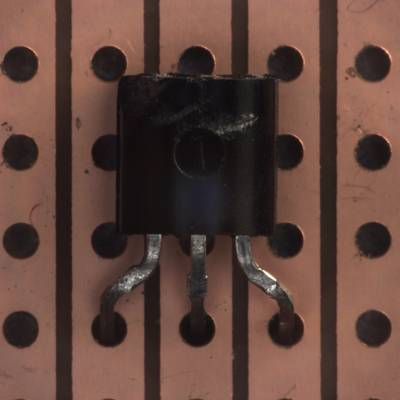
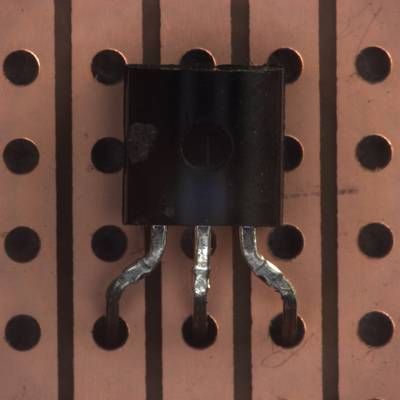
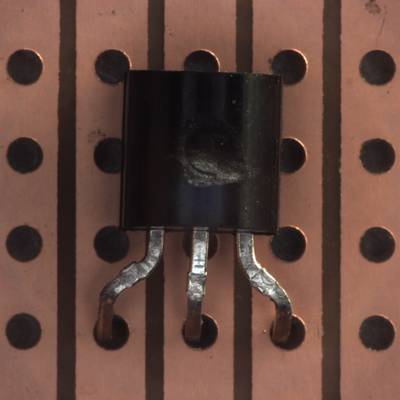
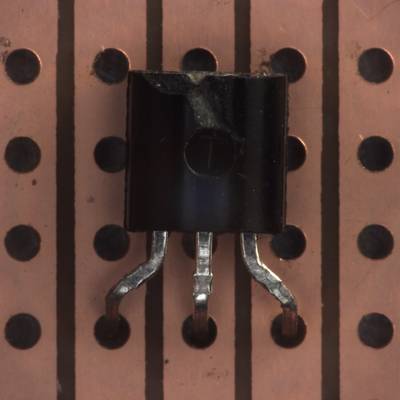
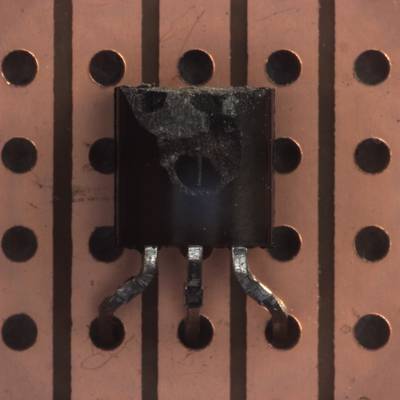
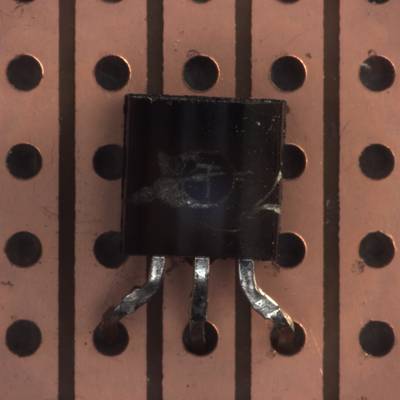
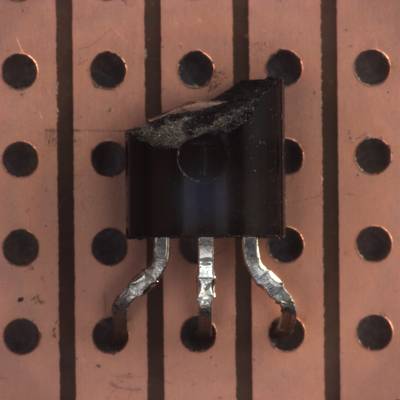
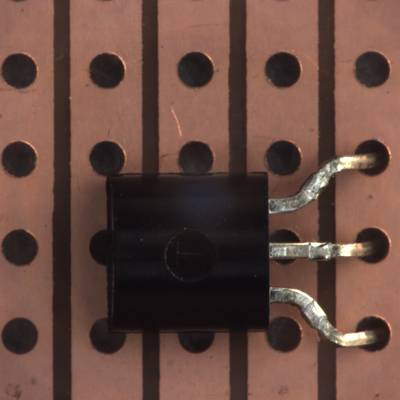
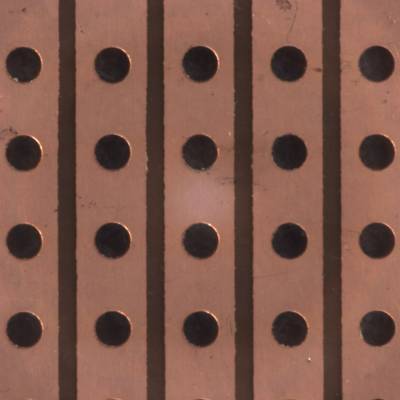
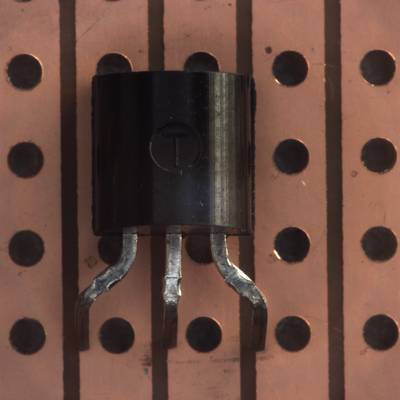
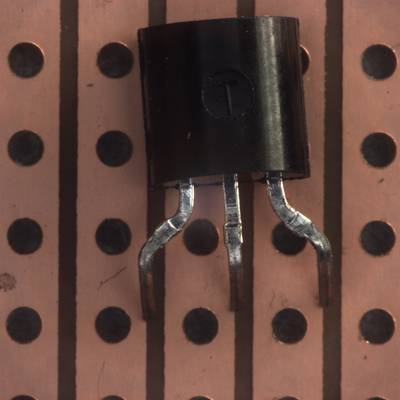
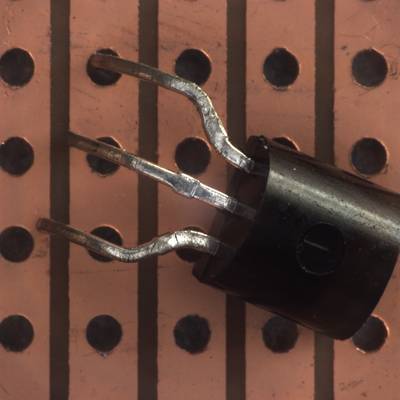
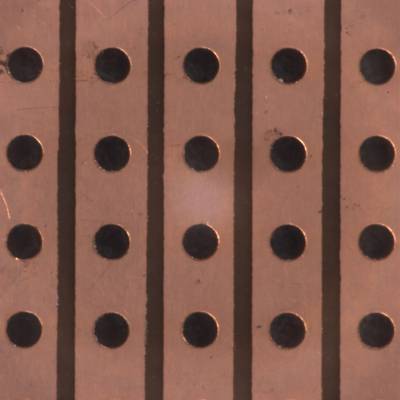
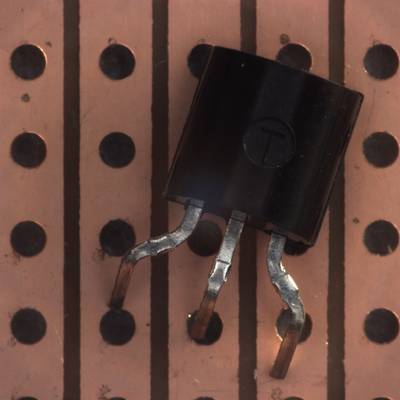
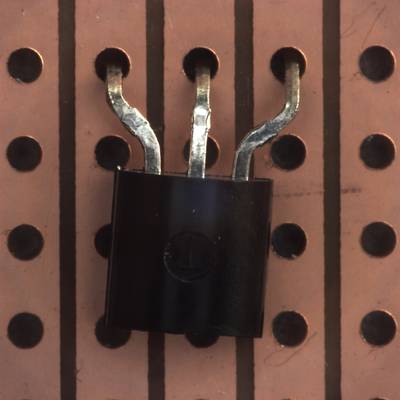
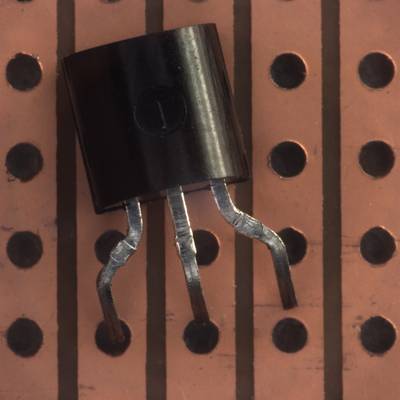
Here is a visualized example for randomly selected sample classes:
Explore #
MVTec AD dataset has 5354 images. Click on one of the examples below or open "Explore" tool anytime you need to view dataset images with annotations. This tool has extended visualization capabilities like zoom, translation, objects table, custom filters and more. Hover the mouse over the images to hide or show annotations.


Class balance #
There are 48 annotation classes in the dataset. Find the general statistics and balances for every class in the table below. Click any row to preview images that have labels of the selected class. Sort by column to find the most rare or prevalent classes.

Class ㅤ | Images ㅤ | Objects ㅤ | Count on image average | Area on image average |
|---|---|---|---|---|
color➔ mask | 93 | 164 | 1.76 | 1.37% |
scratch➔ mask | 91 | 151 | 1.66 | 4.03% |
crack➔ mask | 84 | 92 | 1.1 | 2.62% |
combined➔ mask | 55 | 190 | 3.45 | 4.18% |
cut➔ mask | 53 | 61 | 1.15 | 2.03% |
hole➔ mask | 45 | 68 | 1.51 | 1.64% |
contamination➔ mask | 42 | 45 | 1.07 | 4.83% |
faulty_imprint➔ mask | 41 | 42 | 1.02 | 1.56% |
poke➔ mask | 39 | 40 | 1.03 | 0.27% |
bent➔ mask | 37 | 71 | 1.92 | 1.73% |
Images #
Explore every single image in the dataset with respect to the number of annotations of each class it has. Click a row to preview selected image. Sort by any column to find anomalies and edge cases. Use horizontal scroll if the table has many columns for a large number of classes in the dataset.
Object distribution #
Interactive heatmap chart for every class with object distribution shows how many images are in the dataset with a certain number of objects of a specific class. Users can click cell and see the list of all corresponding images.
Class sizes #
The table below gives various size properties of objects for every class. Click a row to see the image with annotations of the selected class. Sort columns to find classes with the smallest or largest objects or understand the size differences between classes.
Class | Object count | Avg area | Max area | Min area | Min height | Min height | Max height | Max height | Avg height | Avg height | Min width | Min width | Max width | Max width |
|---|---|---|---|---|---|---|---|---|---|---|---|---|---|---|
combined mask | 190 | 1.21% | 14.17% | 0.01% | 9px | 0.88% | 710px | 69.34% | 114px | 11.67% | 8px | 0.78% | 527px | 51.46% |
color mask | 164 | 0.78% | 6.57% | 0.01% | 9px | 1.12% | 344px | 41.43% | 82px | 9.31% | 10px | 1.25% | 448px | 64% |
scratch mask | 151 | 2.43% | 28.62% | 0.04% | 30px | 2.93% | 1024px | 100% | 204px | 22.84% | 30px | 2.93% | 828px | 80.86% |
crack mask | 92 | 2.39% | 27.66% | 0.02% | 15px | 1.5% | 840px | 100% | 278px | 30.87% | 15px | 1.46% | 840px | 100% |
thread mask | 81 | 0.55% | 4.03% | 0.01% | 13px | 1.27% | 1024px | 100% | 182px | 17.81% | 8px | 0.78% | 1024px | 100% |
bent mask | 71 | 0.9% | 3.29% | 0.03% | 12px | 1.17% | 233px | 33.29% | 104px | 12.68% | 11px | 1.57% | 262px | 37.43% |
hole mask | 68 | 1.08% | 5.64% | 0.01% | 16px | 1.56% | 1024px | 100% | 158px | 15.39% | 7px | 0.68% | 565px | 55.18% |
defective mask | 66 | 0.97% | 12.98% | 0.03% | 12px | 1.17% | 500px | 48.83% | 115px | 11.25% | 10px | 0.98% | 465px | 45.41% |
print mask | 65 | 0.69% | 4.83% | 0% | 6px | 0.59% | 391px | 38.18% | 94px | 9.22% | 4px | 0.39% | 393px | 38.38% |
cut mask | 61 | 1.76% | 8.02% | 0.04% | 29px | 2.83% | 638px | 62.3% | 194px | 18.97% | 29px | 2.83% | 334px | 32.62% |
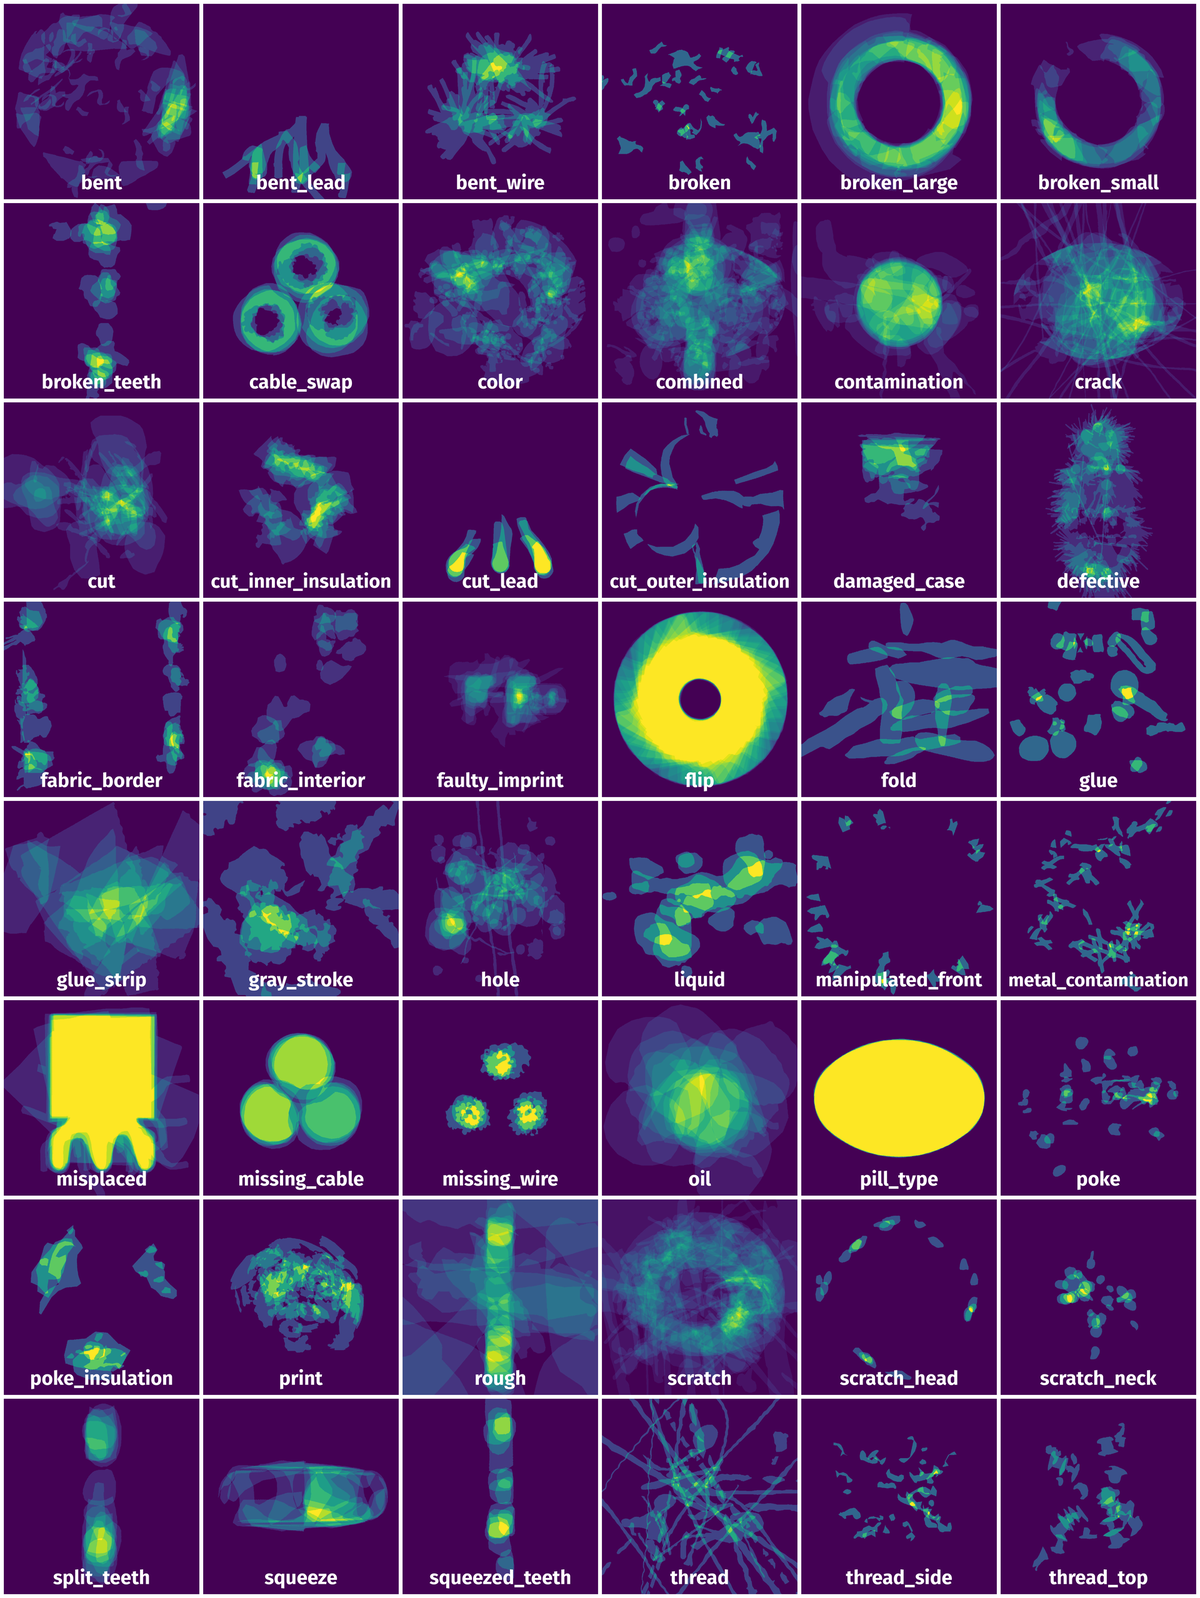
Spatial Heatmap #
The heatmaps below give the spatial distributions of all objects for every class. These visualizations provide insights into the most probable and rare object locations on the image. It helps analyze objects' placements in a dataset.
Objects #
Table contains all 1888 objects. Click a row to preview an image with annotations, and use search or pagination to navigate. Sort columns to find outliers in the dataset.
Object ID ㅤ | Class ㅤ | Image name click row to open | Image size height x width | Height ㅤ | Height ㅤ | Width ㅤ | Width ㅤ | Area ㅤ |
|---|---|---|---|---|---|---|---|---|
1➔ | faulty_imprint mask | capsule_faulty_imprint_013.png | 1000 x 1000 | 107px | 10.7% | 99px | 9.9% | 0.31% |
2➔ | defective mask | toothbrush_defective_002.png | 1024 x 1024 | 63px | 6.15% | 52px | 5.08% | 0.21% |
3➔ | defective mask | toothbrush_defective_002.png | 1024 x 1024 | 143px | 13.96% | 130px | 12.7% | 0.62% |
4➔ | defective mask | toothbrush_defective_002.png | 1024 x 1024 | 83px | 8.11% | 35px | 3.42% | 0.1% |
5➔ | defective mask | toothbrush_defective_002.png | 1024 x 1024 | 57px | 5.57% | 47px | 4.59% | 0.05% |
6➔ | contamination mask | pill_contamination_013.png | 800 x 800 | 80px | 10% | 94px | 11.75% | 0.76% |
7➔ | broken_teeth mask | zipper_broken_teeth_014.png | 1024 x 1024 | 153px | 14.94% | 131px | 12.79% | 1.23% |
8➔ | poke mask | leather_poke_016.png | 1024 x 1024 | 75px | 7.32% | 64px | 6.25% | 0.27% |
9➔ | metal_contamination mask | grid_metal_contamination_006.png | 1024 x 1024 | 106px | 10.35% | 59px | 5.76% | 0.27% |
10➔ | metal_contamination mask | grid_metal_contamination_006.png | 1024 x 1024 | 40px | 3.91% | 15px | 1.46% | 0.03% |
License #
MVTec AD: the MVTec Anomaly Detection is under CC BY-NC-SA 4.0 license.
Citation #
If you make use of the MVTec AD data, please cite the following reference:
Bergmann, P., Batzner, K., Fauser, M. et al.
The MVTec Anomaly Detection Dataset: A Comprehensive Real-World Dataset for Unsupervised Anomaly Detection.
Int J Comput Vis 129, 1038–1059 (2021).
https://doi.org/10.1007/s11263-020-01400-4
If you are happy with Dataset Ninja and use provided visualizations and tools in your work, please cite us:
@misc{ visualization-tools-for-mvtec-ad-dataset,
  title = { Visualization Tools for MVTec AD Dataset },
  type = { Computer Vision Tools },
  author = { Dataset Ninja },
  howpublished = { \url{ https://datasetninja.com/mvtec-ad } },
  url = { https://datasetninja.com/mvtec-ad },
  journal = { Dataset Ninja },
  publisher = { Dataset Ninja },
  year = { 2026 },
  month = { jul },
  note = { visited on 2026-07-26 },
}
Download #
Dataset MVTec AD can be downloaded in Supervisely format:
As an alternative, it can be downloaded with dataset-tools package:
pip install --upgrade dataset-tools
… using following python code:
import dataset_tools as dtools

dtools.download(dataset='MVTec AD', dst_dir='~/dataset-ninja/')
Make sure not to overlook the python code example available on the Supervisely Developer Portal. It will give you a clear idea of how to effortlessly work with the downloaded dataset.
The data in original format can be downloaded here.
Disclaimer #
Our gal from the legal dep told us we need to post this:
Dataset Ninja provides visualizations and statistics for some datasets that can be found online and can be downloaded by general audience. Dataset Ninja is not a dataset hosting platform and can only be used for informational purposes. The platform does not claim any rights for the original content, including images, videos, annotations and descriptions. Joint publishing is prohibited.
You take full responsibility when you use datasets presented at Dataset Ninja, as well as other information, including visualizations and statistics we provide. You are in charge of compliance with any dataset license and all other permissions. You are required to navigate datasets homepage and make sure that you can use it. In case of any questions, get in touch with us at hello@datasetninja.com.