Introduction #
The authors introduce the NAO: Natural Adversarial Object Dataset to evaluate the robustness of object detection models. NAO contains 7,934 images and
13,604 objects that are unmodified and representative of real-world scenarios, but cause state-of-the-art detection models to misclassify with high confidence. The mean average precision (mAP) of EfficientDet-D7 drops 74.5% when evaluated on NAO compared to the standard MSCOCO validation set.
Note: the version of NAO from 20.04.2022 contains 13,604 objects.
Motivation
It’s becoming increasingly common for machine learning vision models to excel on large-scale training sets and generalize well on canonical test sets from the same distribution. However, they still struggle with generalizing towards challenging, out-of-distribution samples. Relying solely on model performance on canonical test sets can be misleading, as it often overestimates their effectiveness on new data. Recent research on adversarial attacks has revealed deep neural networks’ surprising vulnerability to artificially manipulated images, raising concerns about their efficacy and security.
While it’s well-known that neural networks are susceptible to adversarial attacks designed to deceive the system, such attacks typically assume control over the raw input or access to the model weights. However, it’s important to recognize that real-world, unaltered images can also be adversarially leveraged to cause models to fail. These “natural” adversarial attacks pose a less constrained threat model, enabling attackers to create black-box attacks using readily available, naturally occurring images. Such images, termed natural adversarial examples, are unmodified real-world images that prompt modern image classification models to make severe, high-confidence errors.
Dataset description
In the realm of natural adversarial examples, the focus has predominantly been on constructing challenges for image classification models. However, the authors of this study aim to develop an evaluation set tailored specifically for object detection tasks. They introduce a dataset named Natural Adversarial Objects (NAO) designed to assess the worst-case performance of cutting-edge object detection models. Notably, NAO emphasizes the inclusion of unmodified, real-world examples. The authors propose a methodology for identifying natural adversarial objects, leveraging both existing object detection models and human annotators. Initially, they assess predictions from various pre-existing detection models against a dataset already annotated with ground truth bounding boxes. Images featuring high-confidence false positives and misclassified objects are earmarked as potential candidates for NAO. Subsequently, a human annotation pipeline is employed to sift through mislabeled images and identify non-obvious objects, such as occluded or blurry items. Finally, the images are re-annotated using the object categories outlined in the MSCOCO dataset.
Sample images from NAO where EfficientDet-D7 produces high confidence false positives and egregious classification. Left: High confidence misclassified objects where the ground truth label is in distribution and among the MSCOCO object categories. Right: High confidence false positives where the ground truth object is out-of-distribution (i.e. not part of MSCOCO object categories). The misclassified objects and false positives are superficially similar to the predicted classes – for example, the fin of the shark is visually similar to the airplane tail and the yellow petals of the flower are similar to a bunch of bananas.
To create NAO, the authors first sourced images from the training set of OpenImages, a large, annotated image dataset containing approximately 1.9 million images and 15.8 million bounding boxes across 600 object classes. After obtaining a set of natural adversarial images, the authors exhaustively annotate the images with all 80 MSCOCO object classes to facilitate straightforward comparison between NAO and the MSCOCO val and test sets.
Annotation process
The authors annotation process has two annotation stages: classification and bounding box annotation.
- Classification stage. In the classification stage, annotators identify whether the object described by the bounding box shown indeed belongs to the ground truth class as defined by the annotation in OpenImages or as predicted by the EfficientDet-D7. The purpose of this stage is to remove the possibility that the model prediction is “incorrect” due to the ground truth label being incorrect. In addition, they ask the annotators to confirm whether the object can be “obviously classified” according to the following criteria:
- Is the bounding box around the object correctly sized and positioned such that it is not too big or too small?
- Does the object appear blurry?
- Is the object occluded (i.e. are there other objects in front of this one)?
- Is the object a depiction of the correct class (such as a drawing or an image on a billboard)?
The authors asked these additional questions to filter out ambiguous objects, such that a human can easily identify what class an object belongs to. After this filtering, 18.1% of the images (7,934) remain; each of the remaining images are confirmed to fulfill the 4 criteria, and represent true misclassifivations by the model. In this first annotation stage (classification), 5 different annotators are asked to annotate the same image and the authors use their consensus to produce an aggregated response by majority vote.
- Bounding box stage. Annotators exhaustively identify and put boxes around all objects that belong to the MSCOCO object categories. The authors are unable to directly use the annotations from OpenImages because there is not a one-to-one mapping between the OpenImages and MSCOCO object categories, and because the bounding box annotations from OpenImages are not exhaustively annotated. These bounding box annotation tasks are completed by 2 sets of annotators. The first set of annotators complete the bulk of the task by placing bounding boxes around objects that belong to the MSCOCO object categories. The second set of annotators review the work of the first set of annotators, sometimes adding missing bounding boxes or editing the existing ones. To ensure the quality of the annotation is high, in both of these stages, the annotators have to pass multiple quizzes before they can start working tasks to ensure they understand the instructions well. If the annotator fails to maintain a good score, they are no longer eligible to continue to annotate the images. When the annotators from the 2 different stages disagree, the authors tie break by choosing second annotator who is positioned as the reviewer.
Top: Annotation interface for the first annotation stage (classification) where the annotator confirms that the object belongs to the correct category, not occluded, not blurry and not a depiction. Bottom: Annotation interface for second annotation stage (bounding box) where the annotators locate and classify all objects in the images using the MSCOCO object categories.
| Statistics | Number of Images | Number of Objects | 1st Object | 2nd Object | 3rd Object |
|---|---|---|---|---|---|
| MSCOCO val | 5,000 | 36,781 | Person | Car | Chair |
| (11,004) | (1,932) | (1,791) | |||
| MSCOCO test-dev | 20,288 | - | - | - | - |
| NAO | 7,934 | 9,943 | Person | Cup | Car |
| (3,551) | (1,366) | (707) |
Dataset statistics of MSCOCO val, test-dev and NAO.
Summary #
NAO: Natural Adversarial Object Dataset is a dataset for an object detection task. It is applicable or relevant across various domains.
The dataset consists of 7935 images with 13604 labeled objects belonging to 80 different classes including person, cup, dining table, and other: car, bottle, chair, keyboard, airplane, mouse, bowl, truck, fork, dog, knife, cell phone, wine glass, spoon, book, potted plant, cake, kite, laptop, handbag, tv, bicycle, sandwich, backpack, boat, and 52 more.
Images in the NAO dataset have bounding box annotations. There are 4926 (62% of the total) unlabeled images (i.e. without annotations). There are 3 splits in the dataset: train (7660 images), val (141 images), and test (134 images). Additionally, labels contain information about supercategory. Explore it in supervisely labeling tool. The dataset was released in 2021 by the Scale AI, USA and Allen Institute for AI, South Africa.

Explore #
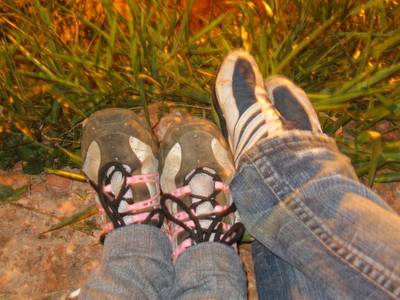
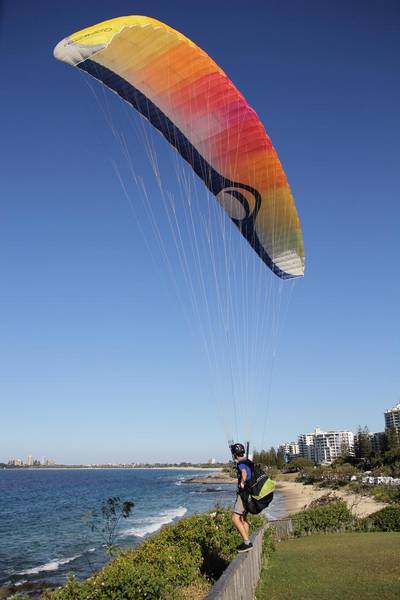
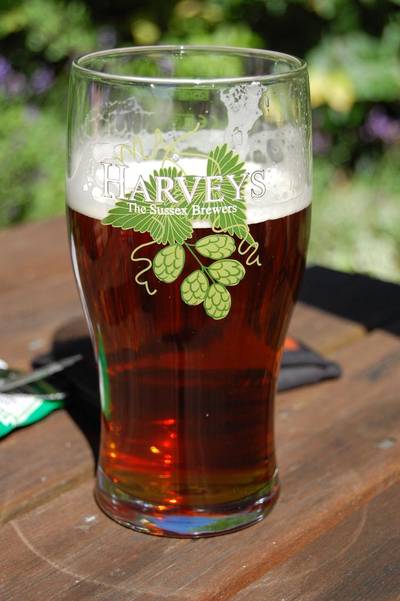
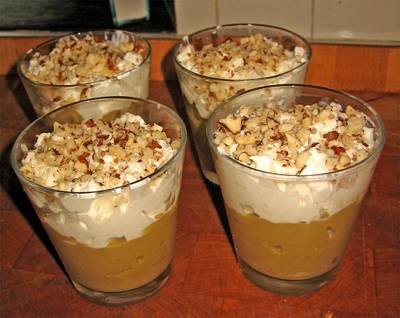
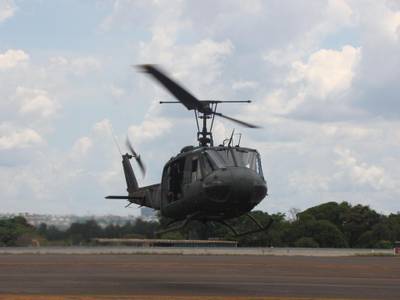
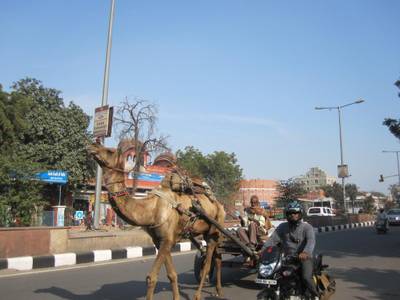
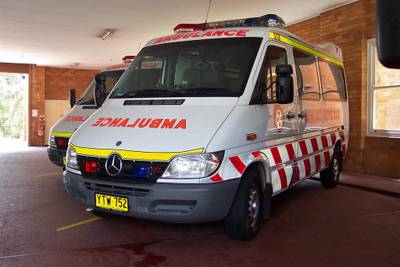
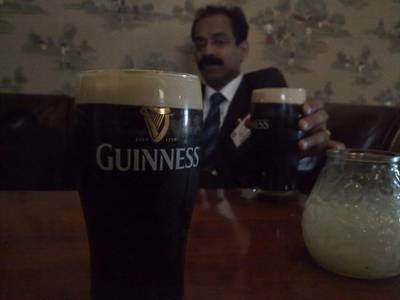
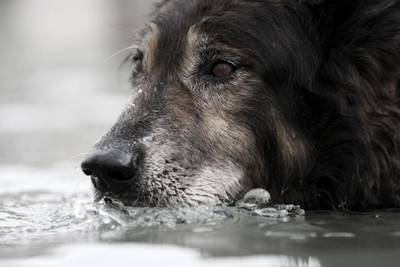
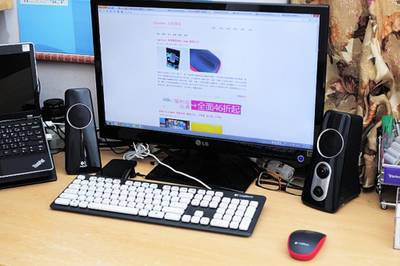
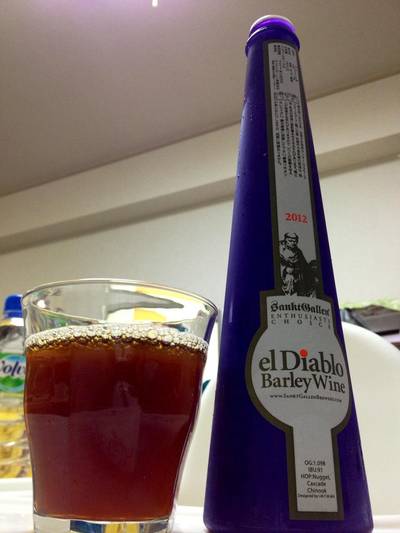
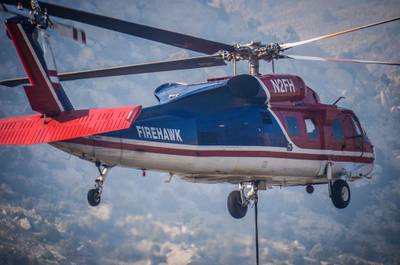
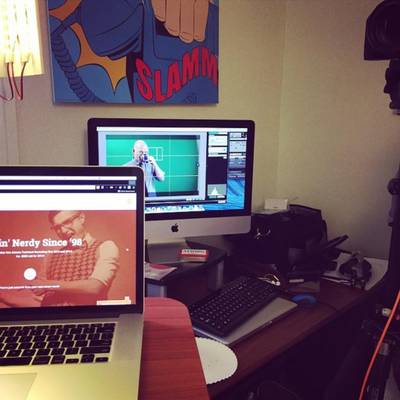
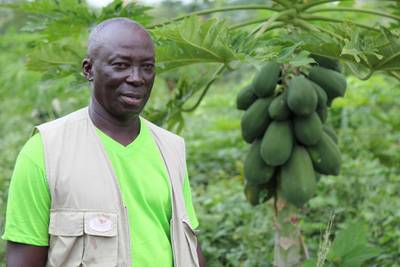
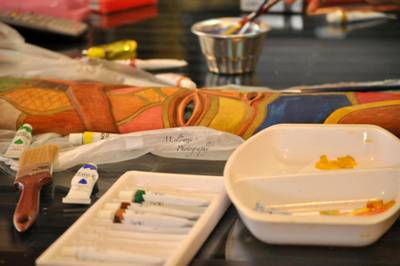
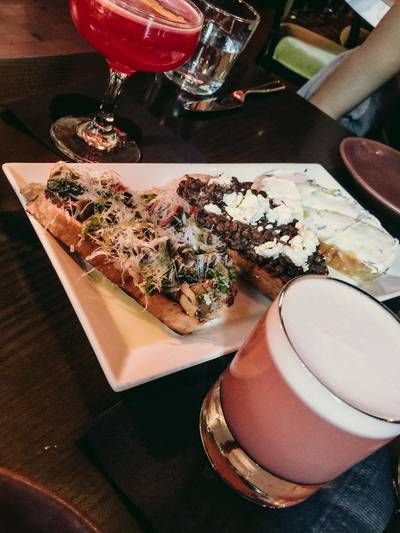
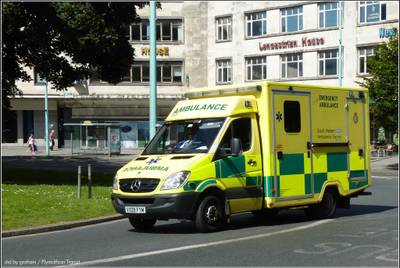
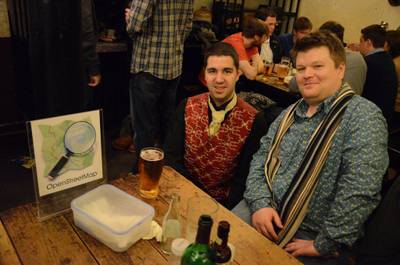
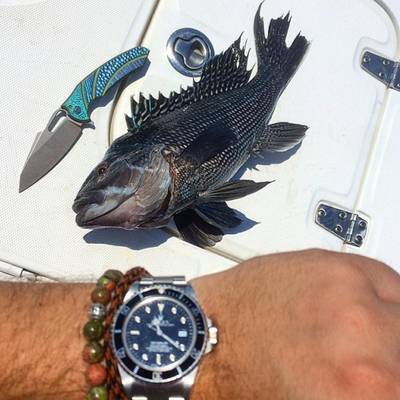
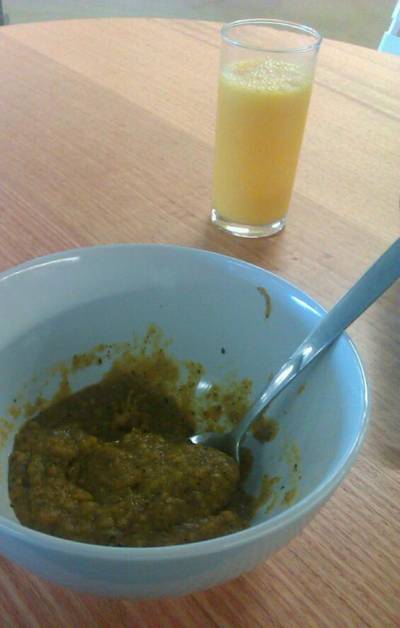
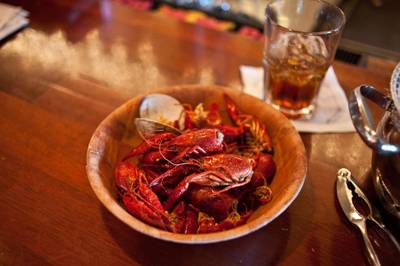
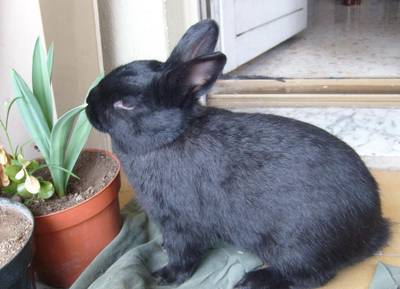
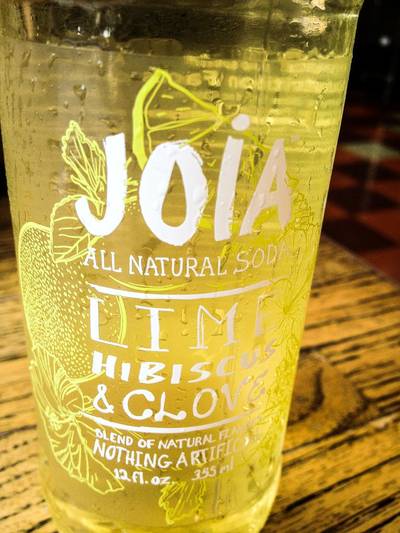
NAO dataset has 7935 images. Click on one of the examples below or open "Explore" tool anytime you need to view dataset images with annotations. This tool has extended visualization capabilities like zoom, translation, objects table, custom filters and more. Hover the mouse over the images to hide or show annotations.





























Class balance #
There are 80 annotation classes in the dataset. Find the general statistics and balances for every class in the table below. Click any row to preview images that have labels of the selected class. Sort by column to find the most rare or prevalent classes.
Class ㅤ | Images ㅤ | Objects ㅤ | Count on image average | Area on image average |
|---|---|---|---|---|
person➔ rectangle | 1448 | 4693 | 3.24 | 32.21% |
cup➔ rectangle | 902 | 2257 | 2.5 | 19.94% |
dining table➔ rectangle | 388 | 489 | 1.26 | 61.54% |
car➔ rectangle | 333 | 752 | 2.26 | 42.45% |
bottle➔ rectangle | 259 | 503 | 1.94 | 12.04% |
chair➔ rectangle | 254 | 701 | 2.76 | 9.9% |
keyboard➔ rectangle | 235 | 301 | 1.28 | 9.29% |
airplane➔ rectangle | 185 | 214 | 1.16 | 33% |
mouse➔ rectangle | 151 | 176 | 1.17 | 1.81% |
bowl➔ rectangle | 145 | 251 | 1.73 | 16.89% |
Images #
Explore every single image in the dataset with respect to the number of annotations of each class it has. Click a row to preview selected image. Sort by any column to find anomalies and edge cases. Use horizontal scroll if the table has many columns for a large number of classes in the dataset.
Object distribution #
Interactive heatmap chart for every class with object distribution shows how many images are in the dataset with a certain number of objects of a specific class. Users can click cell and see the list of all corresponding images.
Class sizes #
The table below gives various size properties of objects for every class. Click a row to see the image with annotations of the selected class. Sort columns to find classes with the smallest or largest objects or understand the size differences between classes.
Class | Object count | Avg area | Max area | Min area | Min height | Min height | Max height | Max height | Avg height | Avg height | Min width | Min width | Max width | Max width |
|---|---|---|---|---|---|---|---|---|---|---|---|---|---|---|
person rectangle | 4693 | 10.96% | 100% | 0% | 2px | 0.26% | 2392px | 100% | 253px | 32.95% | 3px | 0.29% | 1769px | 100% |
cup rectangle | 2257 | 8.29% | 94.43% | 0.02% | 12px | 1.76% | 1024px | 100% | 258px | 31.33% | 11px | 1.07% | 967px | 100% |
car rectangle | 752 | 19.57% | 100% | 0.01% | 7px | 0.68% | 1024px | 100% | 235px | 31.19% | 9px | 0.88% | 1024px | 100% |
chair rectangle | 701 | 3.82% | 48.77% | 0.01% | 8px | 1.04% | 707px | 92.06% | 150px | 19.12% | 6px | 0.59% | 946px | 92.38% |
bottle rectangle | 503 | 6.35% | 90.23% | 0.01% | 7px | 0.91% | 1024px | 100% | 241px | 28.58% | 4px | 0.39% | 940px | 92.06% |
dining table rectangle | 489 | 49.04% | 100% | 0.04% | 7px | 0.91% | 1042px | 100% | 442px | 53.44% | 16px | 2.08% | 1170px | 100% |
book rectangle | 315 | 4.9% | 91.07% | 0.01% | 4px | 0.59% | 996px | 100% | 122px | 15.65% | 4px | 0.39% | 1024px | 100% |
keyboard rectangle | 301 | 7.3% | 45.25% | 0.08% | 12px | 1.57% | 434px | 56.51% | 130px | 17.08% | 18px | 1.76% | 995px | 97.17% |
bowl rectangle | 251 | 9.92% | 100% | 0.04% | 14px | 2.05% | 768px | 100% | 189px | 23.89% | 22px | 2.15% | 1024px | 100% |
fork rectangle | 243 | 2.56% | 28.5% | 0.01% | 9px | 1.17% | 520px | 75.4% | 112px | 14.51% | 8px | 0.78% | 655px | 63.96% |
Spatial Heatmap #
The heatmaps below give the spatial distributions of all objects for every class. These visualizations provide insights into the most probable and rare object locations on the image. It helps analyze objects' placements in a dataset.

Objects #
Table contains all 13604 objects. Click a row to preview an image with annotations, and use search or pagination to navigate. Sort columns to find outliers in the dataset.
Object ID ㅤ | Class ㅤ | Image name click row to open | Image size height x width | Height ㅤ | Height ㅤ | Width ㅤ | Width ㅤ | Area ㅤ |
|---|---|---|---|---|---|---|---|---|
1➔ | orange rectangle | 43557ca27482a1bd.jpeg | 768 x 1024 | 54px | 7.03% | 62px | 6.05% | 0.43% |
2➔ | person rectangle | 8abc162894296aac.jpeg | 954 x 1024 | 867px | 90.88% | 499px | 48.73% | 44.29% |
3➔ | person rectangle | 36c5e80007178650.jpeg | 1024 x 768 | 976px | 95.31% | 685px | 89.19% | 85.01% |
4➔ | cake rectangle | 36c5e80007178650.jpeg | 1024 x 768 | 132px | 12.89% | 158px | 20.57% | 2.65% |
5➔ | cup rectangle | 36c5e80007178650.jpeg | 1024 x 768 | 169px | 16.5% | 112px | 14.58% | 2.41% |
6➔ | cup rectangle | 36c5e80007178650.jpeg | 1024 x 768 | 160px | 15.62% | 124px | 16.15% | 2.52% |
7➔ | dining table rectangle | 36c5e80007178650.jpeg | 1024 x 768 | 327px | 31.93% | 447px | 58.2% | 18.59% |
8➔ | chair rectangle | 36c5e80007178650.jpeg | 1024 x 768 | 437px | 42.68% | 101px | 13.15% | 5.61% |
9➔ | cup rectangle | 671f2006d1b64314.jpeg | 768 x 1024 | 481px | 62.63% | 293px | 28.61% | 17.92% |
10➔ | cup rectangle | 671f2006d1b64314.jpeg | 768 x 1024 | 382px | 49.74% | 229px | 22.36% | 11.12% |
License #
Citation #
If you make use of the NAO data, please cite the following reference:
@dataset{NAO,
  author={Felix Lau and Nishant Subramani and Sasha Harrison and Aerin Kim and Elliot Branson and Rosanne Liu},
  title={NAO: Natural Adversarial Object},
  year={2021},
  url={https://www.v7labs.com/open-datasets/natural-adversarial-object-nao}
}
If you are happy with Dataset Ninja and use provided visualizations and tools in your work, please cite us:
@misc{ visualization-tools-for-nao-dataset,
  title = { Visualization Tools for NAO Dataset },
  type = { Computer Vision Tools },
  author = { Dataset Ninja },
  howpublished = { \url{ https://datasetninja.com/nao } },
  url = { https://datasetninja.com/nao },
  journal = { Dataset Ninja },
  publisher = { Dataset Ninja },
  year = { 2026 },
  month = { feb },
  note = { visited on 2026-02-05 },
}
Download #
Dataset NAO can be downloaded in Supervisely format:
As an alternative, it can be downloaded with dataset-tools package:
pip install --upgrade dataset-tools
… using following python code:
import dataset_tools as dtools

dtools.download(dataset='NAO', dst_dir='~/dataset-ninja/')
Make sure not to overlook the python code example available on the Supervisely Developer Portal. It will give you a clear idea of how to effortlessly work with the downloaded dataset.
The data in original format can be downloaded here.
Disclaimer #
Our gal from the legal dep told us we need to post this:
Dataset Ninja provides visualizations and statistics for some datasets that can be found online and can be downloaded by general audience. Dataset Ninja is not a dataset hosting platform and can only be used for informational purposes. The platform does not claim any rights for the original content, including images, videos, annotations and descriptions. Joint publishing is prohibited.
You take full responsibility when you use datasets presented at Dataset Ninja, as well as other information, including visualizations and statistics we provide. You are in charge of compliance with any dataset license and all other permissions. You are required to navigate datasets homepage and make sure that you can use it. In case of any questions, get in touch with us at hello@datasetninja.com.


