

Introduction #
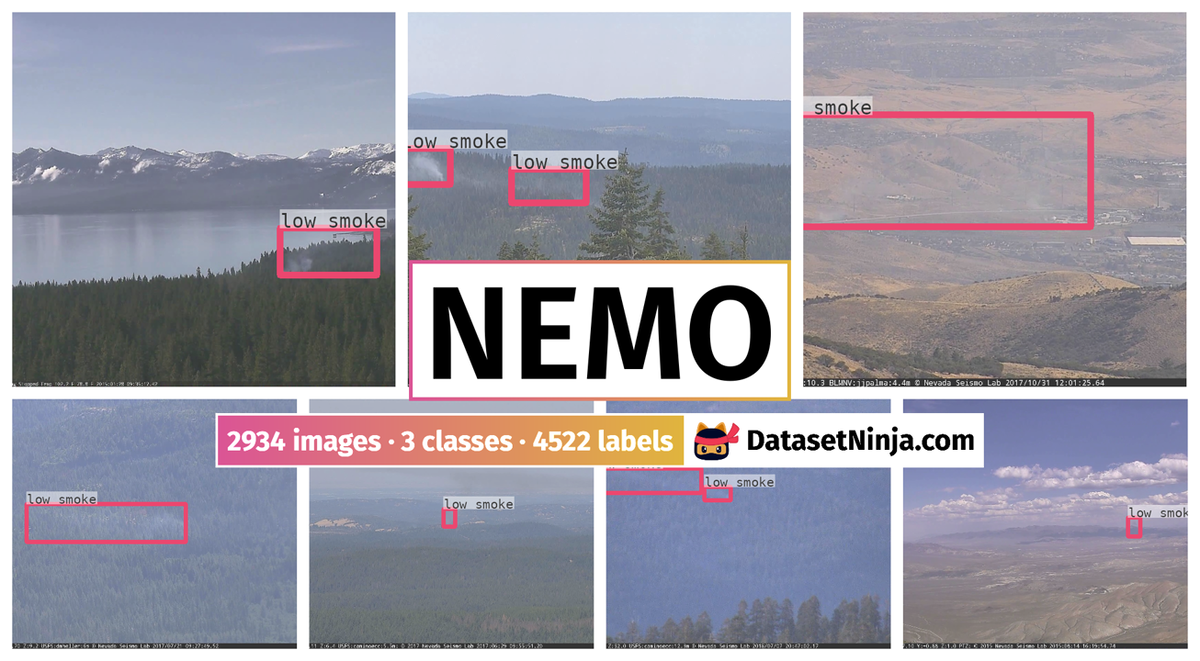
The authors created the NEMO: Nevada Smoke Detection Dataset for wildfire smoke detection and localization. They extracted frames containing smoke from 1073 videos from AlertWildfire and, then, labeled them with the class and bounding box of the smoke regions. Their preliminary results confirmed the inherent problem of false alarms in object detection. To overcome this, the authors created additional dataset configurations to explicitly add negative samples and reduce false alarms.
Motivation
In 2021, the United States grappled with over 58,000 wildfires, scorching more than seven million acres of land. Particularly hard-hit were the Western states, where severe drought has engulfed ninety percent of the region. In California, fire seasons now commence earlier and extend longer than before. The nation’s firefighting efforts have incurred an average annual cost of USD 2.35 billion over the past five years. Moreover, researchers have uncovered links between the fine particles present in wildfire smoke and respiratory ailments, underscoring the broader health implications. The extensive destruction and financial burdens imposed by wildfires have spurred intensive efforts among researchers to develop early detection systems.
The first detection systems were based on typical fire-sensing technologies such as gas, heat, and smoke detectors. Conventional sensors have a limited range and coverage, while suffering from a slow response time, as smoke particles need to reach the sensors to activate them. Later works were based on optical remote sensing at three different acquisition levels: satellite, aerial, and terrestrial. Satellites offer extensive views of the Earth’s surface; however, they suffer from a relatively coarse spatial and temporal resolution and, thus, are only effective in the detection and monitoring of large-scale forest fires. Moreover, satellites operating in Low Earth Orbit (LEO) offer finer resolutions, making them more suitable for detecting fire in the early phases, but take a long time to re-position and thus have limited coverage. Ideally, a constellation of low-orbit satellites with reliable and fast network capabilities can provide the required coverage. Aerial remote sensing approaches, such as deploying sensors on high-altitude aircraft and balloons, have also been tried, but they are costly or have limited coverage.
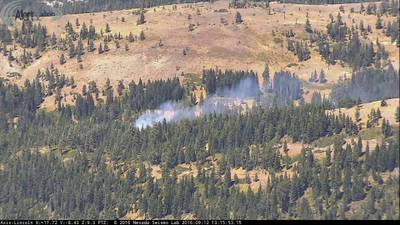
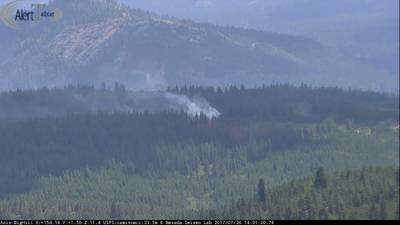
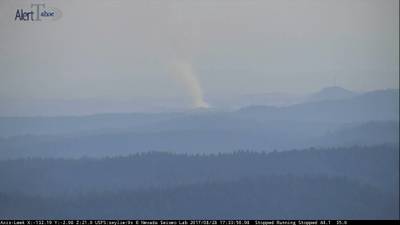
Finally, a terrestrial option to sense fire would be optical cameras installed at good vantage points. Two large-scale networks of such cameras are already deployed in the Western United States. AlertWildfire provides access to 900 cameras across eight states, while HPWREN provides a comprehensive coverage of the wildfire-prone Southern California. The placement of these cameras enables a range view of up to 50 miles. Some are also capable of panning, tilting, and zooming (PTZ), offering additional options to monitor wildfires at different resolutions. Wildfires typically ignite in rural and remote areas, such as forests, using abundant wildland vegetation as fuel. They spread quickly and uncontrollably, making them difficult to control in a short time. Thus, the most important objective of any wildfire detection system is to detect wildfires early and before they grow. This is called the incipient stage of fire development. Wildfires in the incipient stage comprise a non-flaming smoldering with relatively low heat. Recognizing fire at this stage offers the best chance of suppression. Moreover, flame is not typically visible at this stage; thus, any wildfire detection system that aims at early detection must focus on detecting smoke and not flame. Additionally, the smoke plume at this stage tends to be very small and, in some cases, not visible by human observation of wildfire videos, especially in the first few minutes after the start of the fire. Thus, any wildfire detection system tailored to early detection should be able to detect small smoke plumes, typically far from view and on the horizon.
Encoder self-attention for a set of reference points. The example shows that the encoder is able to separate instances and regions, even at the early stages of training.
Dataset description
In recent years, multi-institutional research projects such as AlertWildfire and the High Performance Wireless Research & Education Network (HPWREN) have become the leading source of live and archived video footage and image snapshots of rural and remote wildland areas on the west coast of the United States. While the initial objectives of these university-led projects have been research areas such as seismology and geophysics, they have morphed into invaluable resources for cross-disciplinary research in wildfire management, as well as for fire fighters and public safety agencies in multiple states. The network-connected cameras particularly help in:
- Discover/locate/verify fire ignition through continuous manual observation of camera feeds,
- Scaling allocated resources according to spread dynamics and severity,
- Persistent monitoring of fire behavior through containment and until its demise,
- Help develop an evacuation strategy and support decision-making in case of firestorms.
While the cameras, sensors, and available resources are effective for the latter three, the initial step, which is discovery, can be greatly improved with sophisticated deep-learning-based systems. The authors collaborated with The University of Nevada’s Seismological Laboratory (NSL), which is one of the leading groups in the AlertWildfire consortium, along with the University of California San Diego (UCSD) and the University of Oregon. The authors extracted frames containing smoke from 1073 videos from AlertWildfire and, then, labeled them with the class and bounding box of the smoke regions. Their preliminary results confirmed the inherent problem of false alarms in object detection. To overcome this, the authors created additional dataset configurations to explicitly add negative samples and reduce false alarms. The authors main wildfire object of interest is smoke, in particular smoke at the early incipient stage. To design an effective wildfire detection model, domain-specific challenges considering camera feeds, similar wildfire objects, and other factors related to non-object (non-smoke) classes need to be considered.
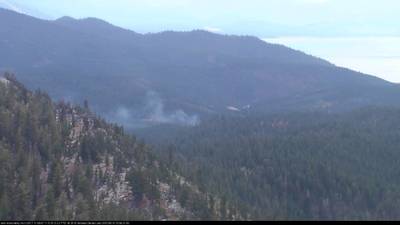
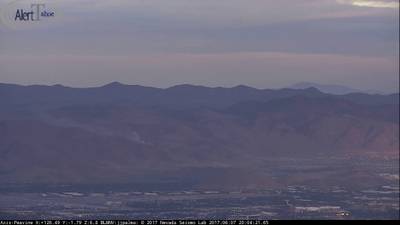
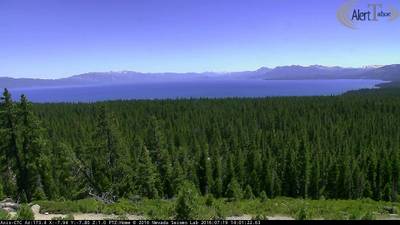
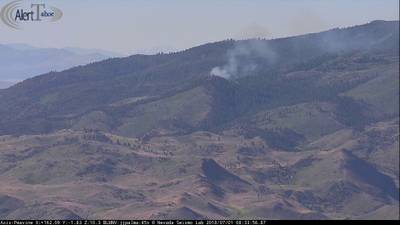
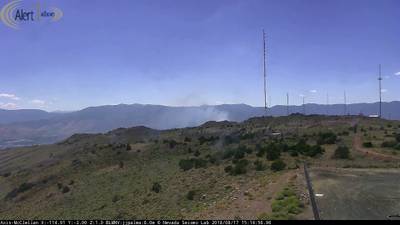
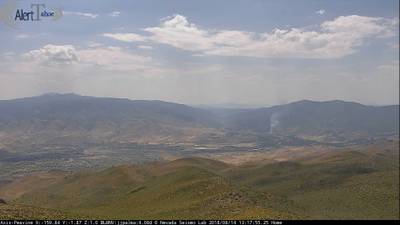
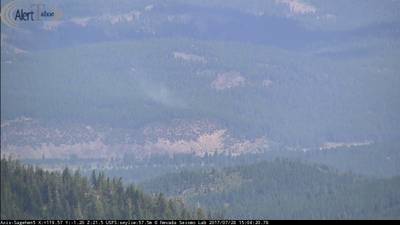
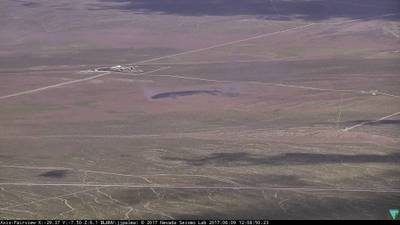
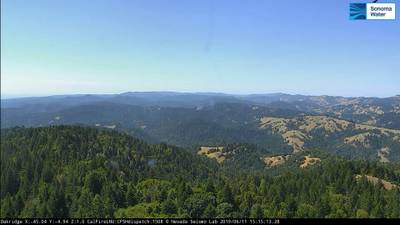
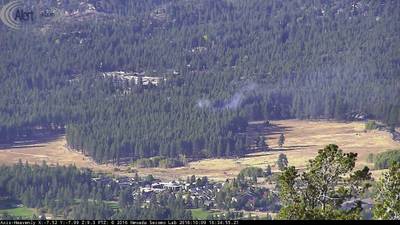
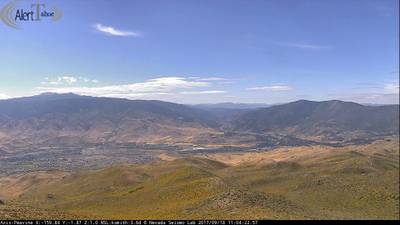
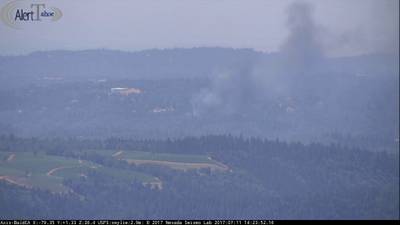
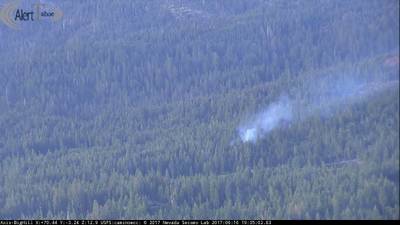
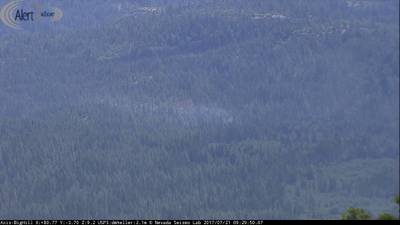
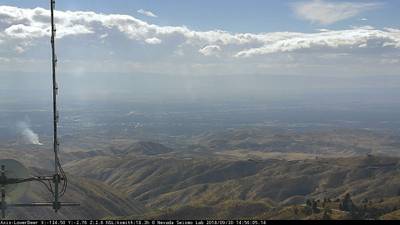
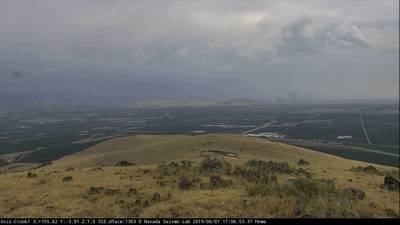
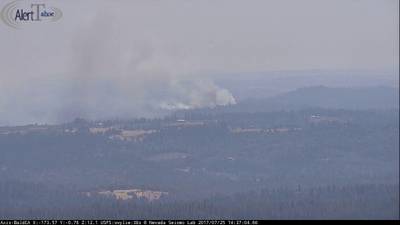
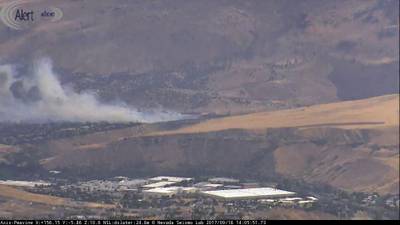
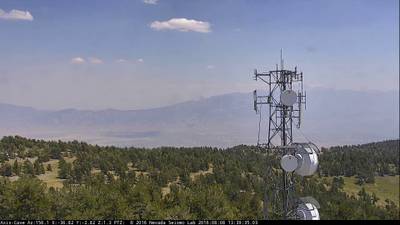
Examples of smoke-like objects. Most images are from Nevada and California wildlands and the Sierra Mountains. (a) Small cloud on the right. (b) Cloud on a mountain top with hazy background. (c) Dirty lens, reflection, and smog. (d) Small pile of dust resembles smoke at an early stage. (e) Sunset and sunrise. (f) Heavy dust, glare, and smudge. (g) Tiny, low-altitude cloud, and snow. (h) Heavy fog and yellow flood light. (i) Miscellaneous objects and glare.
AlertWildFire has expanded its reach to encompass 900 cameras spread across eight states, namely Nevada, California, Oregon, Washington, Utah, Idaho, Colorado, and more recently, Montana. This expansion owes much to leveraging existing communication infrastructures, particularly third-party microwave towers strategically positioned on mountaintops. These camera placements afford a broad vantage point, with views extending up to 50 miles, enabling the detection of wildfires spanning multiple counties. However, the extensive vistas captured by the cameras present unique challenges for object detection, characterized by significant background space and the potential for the target object, such as smoke from a wildfire, to occupy a minimal portion of the frame, resulting in a pronounced foreground-background class imbalance. For example, images from the test set captured by fixed wide-angle cameras produce frames measuring 3072 by 2048 pixels every minute. The background scenery may include objects resembling smoke or those typically found near smoke, such as flames, leading to potential false alarms. Moreover, discerning wildfires at advanced stages—larger and more distinguishable from background elements—presents fewer challenges compared to identifying them at early incipient stages. The observations indicate that objects resembling incipient wildfire smoke encompass clouds, fog, smog, dust, lens smudges, snow, glare, and various distant landscape features like winding roads. Similarly, objects resembling flames include the sun, along with its assorted shades and reflections during sunrise and sunset.
A tiny column of smoke near the horizon is correctly detected as low-density smoke, two minutes after the start of the fire. Viewed from a west-facing fixed camera on top of Palomar Mountain, California, on 1 October 2019. The smoke object is 24 × 26 pixels wide, and the image is 3072 × 2048 pixels, which makes the detected object less than 0.01% of the image. A focused 300 by 300 cutout of the smoke area is shown, with the smoke column centered.
Data collection and annotation
Collecting and labeling wildfire smoke from the raw videos came with certain challenges: small object size, the shallow and fuzzy nature of smoke, huge backgrounds and variety of smoke-like objects, unstructured and variable-length source videos, moving background scenes, obstruction caused by sunlight, glare, illumination, fog, haze, and other random environmental and technical factors that hamper visibility. The authors mainly overcame these challenges by careful and repetitive manual observation of the source videos with attention to spatial and temporal clues within the file names. Moreover, finding wildfire starts and labeling smoke objects at the early incipient stage is uniquely challenging and in stark contrast to the effort required for the later stages. Fine-grained relabeling of smoke objects based on their density also added to these challenges. To summarize, Figure 5 shows the preprocessing workflow for the early incipient stage. A group of individuals helped with this process, which took a substantial amount of time and effort in the form of revisions and re-annotations.
Early incipient data preprocessing workflow. Raw videos are manually observed to determine the appropriate period for data extraction, using automated scripts. This is particularly necessary for long videos. The extracted images are then labeled with bounding boxes using the makesense.ai tool. Since smoke at this stage tends to be small and typically not or hardly visible, a continuous feedback loop is crucial to locate smoke and draw the bounding boxes correctly. Finding wildfire starts is particularly difficult, since they are shallow and typically on or near the horizon.
The authors collected and annotated the data in different phases:
Phase 1. Initial frame extraction: They utilized 1073 original videos showcasing fires, obtained through collaboration with AlertWildfire. These videos were captured using pan-tilt-zoom (PTZ) cameras, with the majority of incidents occurring in wildlands, forests, remote regions, or in proximity to highways. Additionally, the collection includes footage of residential fires, prescribed burns, car and plane accidents, and nocturnal wildfires. However, the video file names lack structure and adhere to no consistent or standardized metadata or naming convention. Consequently, organizing them reliably based on factors like location, date, or stage of development proved impractical. The frames extracted from these videos depict various stages of fire. To augment the dataset with images depicting wildfire inception and early stages, the authors leveraged spatial and temporal cues embedded in the video file names. For instance, they focused on extracting images from videos containing cues such as “Small Fire near Highway 40 (Mogul Verdi) put out quickly” or “Evans Fire starts at 7:44 AM and camera points at Peavine 8:33 AM,” while diminishing the extraction from videos portraying advanced stages. Challenges in observation often stemmed from factors like smoke size, opacity, distance, weather, and lighting conditions, compounded by the frequent zooming and movement of PTZ cameras post-fire discovery. Despite efforts to gather more frames pre-discovery, numerous iterations and re-annotations were necessary to ensure accurate capture of smoke regions. Additionally, some videos exclusively depicted fully developed wildfires, such as “Firefighters turn the corner on the Slide fire, as seen from Snow Valley Peak at 4 PM,” or “Fifth hour of the Truckee Fire near Nixon, NV from the Virginia Peak fire camera 9–10 AM,” offering no valuable frames. Consequently, of the initially extracted 7,023 frames, only 4,347 were annotated, with many annotations later omitted from the dataset for the reasons outlined.
Phase 2. Single-class annotation: The authors initially annotated 4347 images using MakeSense AI , resulting in 4801 instances (i.e., smoke objects annotated with bounding boxes). At first, the annotations contained four classes: smoke, fire, flame, and nightSmoke, but they decided to only keep the smoke class. Determining the boundaries of smoke objects at night is a very difficult task with unreliable annotations. Flame is typically visible in the zoomed frames and more advanced stages, which is not their objective. The fire class, which they used to label bigger (typically more advanced) fires, was mostly removed or relabeled as smoke. What remained is the initial single-class smoke dataset containing 2587 images. It is randomly divided into 2349 training images containing 2450 instances and 238 validation images containing 246 instances. A long-term goal and aspiration of the project was to design a system that aids in climate prediction and determining the severity of wildfire smoke particles and other hazardous pollutants and emissions. The authors noticed that in any stage of a wildfire, smoke columns have varying opacity and density. Smoke at the earliest stages tends to be shallow and less severe than smoke at later stages. In some cases, different sub-regions of the same smoke column tend to have varying opacity. Thus, to aid in the goal of detecting smoke at the earliest stage and to design a proof-of-concept model for detecting the severity of pollutants, they defined three additional sub-classes of smoke based on their density: low smoke, mid smoke, and high smoke.
Phase 3. Smoke density re-annotation: The authors re-annotated the single-class smoke objects into three sub-classes based on perceived pixel density: low, mid, and high. For better visualization, smoke that was relatively bigger or zoomed in was chosen. This sub-categorization helps account for variations in visual appearance and fine-grained information of smoke columns. There were, however, several unique challenges. One of the hardest challenges in re-annotation is finding low-density parts of the smoke, as they tend to blend into the background or are extremely small. The authors noticed that the only way to properly annotate the low-density areas is to revisit the video sources and use the movement of the shallow parts to distinguish the bounding areas in the respective captured frames.
Challenging negative test set: The authors handpicked a set of 100 images containing no smoke from various sources. Importantly, this is not a set of random empty images, but 100 images, carefully and deliberately selected, to challenge the predictions based on the resemblance to smoke objects in the training set and other environmental conditions that make smoke prediction unreliable (e.g., haze, dust, fog, glare).
Examples of smoke density re-annotation. The left side shows the initial annotation with the single category “smoke” (bounding box denoted with white color). On the right side, the same images were re-annotated with smoke as the super-category, and “low” (blue), “mid” (pink), and “high” (red) as the categories based on the relative opacity of the smoke.
Phase 4—collage images and dummy annotations: The authors created additional dataset configurations to improve the diversity of background objects in the training set. They incorporated empty images by adding collages of smoke and non-smoke images or adding empty images without annotations. They also created a version of the dataset that added empty images with dummy annotations. This hack is suitable for situations where the underlying object detection codebasedoes not support negative samples for training.
 Homepage
 Research Paper
 Kaggle
Summary #
NEMO: Nevada Smoke Detection Dataset is a dataset for an object detection task. It is used in the forestry industry.
The dataset consists of 2934 images with 4522 labeled objects belonging to 3 different classes including low smoke, mid smoke, and high smoke.
Images in the NEMO dataset have bounding box annotations. There are 4 (0% of the total) unlabeled images (i.e. without annotations). There are 2 splits in the dataset: train (2684 images) and val (250 images). The dataset was released in 2022 by the University of Nevada, USA and University of Houston, USA.
Explore #
NEMO dataset has 2934 images. Click on one of the examples below or open "Explore" tool anytime you need to view dataset images with annotations. This tool has extended visualization capabilities like zoom, translation, objects table, custom filters and more. Hover the mouse over the images to hide or show annotations.


Class balance #
There are 3 annotation classes in the dataset. Find the general statistics and balances for every class in the table below. Click any row to preview images that have labels of the selected class. Sort by column to find the most rare or prevalent classes.

Class ㅤ | Images ㅤ | Objects ㅤ | Count on image average | Area on image average |
|---|---|---|---|---|
low smoke➔ rectangle | 2365 | 2726 | 1.15 | 5.28% |
mid smoke➔ rectangle | 1227 | 1403 | 1.14 | 4.04% |
high smoke➔ rectangle | 350 | 393 | 1.12 | 8.26% |
Co-occurrence matrix #
Co-occurrence matrix is an extremely valuable tool that shows you the images for every pair of classes: how many images have objects of both classes at the same time. If you click any cell, you will see those images. We added the tooltip with an explanation for every cell for your convenience, just hover the mouse over a cell to preview the description.
Images #
Explore every single image in the dataset with respect to the number of annotations of each class it has. Click a row to preview selected image. Sort by any column to find anomalies and edge cases. Use horizontal scroll if the table has many columns for a large number of classes in the dataset.
Object distribution #
Interactive heatmap chart for every class with object distribution shows how many images are in the dataset with a certain number of objects of a specific class. Users can click cell and see the list of all corresponding images.
Class sizes #
The table below gives various size properties of objects for every class. Click a row to see the image with annotations of the selected class. Sort columns to find classes with the smallest or largest objects or understand the size differences between classes.
Class | Object count | Avg area | Max area | Min area | Min height | Min height | Max height | Max height | Avg height | Avg height | Min width | Min width | Max width | Max width |
|---|---|---|---|---|---|---|---|---|---|---|---|---|---|---|
low smoke rectangle | 2726 | 4.58% | 71.48% | 0% | 7px | 0.65% | 915px | 84.72% | 194px | 17.56% | 9px | 0.47% | 2907px | 89.06% |
mid smoke rectangle | 1403 | 3.54% | 48.77% | 0.01% | 9px | 0.83% | 907px | 82.59% | 185px | 16.41% | 10px | 0.52% | 1758px | 83.39% |
high smoke rectangle | 393 | 7.37% | 46.94% | 0.01% | 11px | 1.02% | 1336px | 85.56% | 300px | 24.63% | 18px | 0.94% | 2329px | 93.54% |
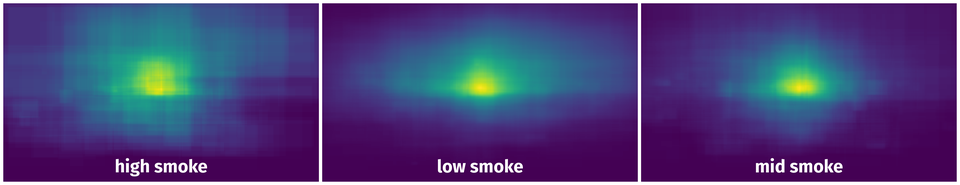
Spatial Heatmap #
The heatmaps below give the spatial distributions of all objects for every class. These visualizations provide insights into the most probable and rare object locations on the image. It helps analyze objects' placements in a dataset.
Objects #
Table contains all 4522 objects. Click a row to preview an image with annotations, and use search or pagination to navigate. Sort columns to find outliers in the dataset.
Object ID ㅤ | Class ㅤ | Image name click row to open | Image size height x width | Height ㅤ | Height ㅤ | Width ㅤ | Width ㅤ | Area ㅤ |
|---|---|---|---|---|---|---|---|---|
1➔ | low smoke rectangle | Fairview_Fire_begins_to_spread_uphill_at_2_PM_FR-74.jpg | 1080 x 1920 | 409px | 37.87% | 244px | 12.71% | 4.81% |
2➔ | low smoke rectangle | I-580_Incident_Fire_seen_from_Peavine_Mt_at_7_pm_FR-1288.jpg | 1080 x 1920 | 287px | 26.57% | 1041px | 54.22% | 14.41% |
3➔ | mid smoke rectangle | I-580_Incident_Fire_seen_from_Peavine_Mt_at_7_pm_FR-1288.jpg | 1080 x 1920 | 303px | 28.06% | 111px | 5.78% | 1.62% |
4➔ | mid smoke rectangle | Mill_Fire_spied_upon_from_McClellan_Peak_at_1_PM_SS-59.jpg | 1080 x 1920 | 67px | 6.2% | 113px | 5.89% | 0.37% |
5➔ | low smoke rectangle | Mill_Fire_spied_upon_from_McClellan_Peak_at_1_PM_SS-59.jpg | 1080 x 1920 | 578px | 53.52% | 1168px | 60.83% | 32.56% |
6➔ | mid smoke rectangle | collage-ART_cloudy_16.jpg | 2110 x 3264 | 529px | 25.07% | 1159px | 35.51% | 8.9% |
7➔ | low smoke rectangle | collage-ART_cloudy_16.jpg | 2110 x 3264 | 34px | 1.61% | 190px | 5.82% | 0.09% |
8➔ | low smoke rectangle | Gray_Fire_starts_slightly_before_Noon_as_seen_from_Fairview_Peak_fire_camera_FR-325.jpg | 1080 x 1920 | 46px | 4.26% | 130px | 6.77% | 0.29% |
9➔ | low smoke rectangle | Yet_another_suspicious_fire_near_the_Heavenly_Gondola_is_confirmed_around_430_PM_FR-800.jpg | 1080 x 1920 | 26px | 2.41% | 60px | 3.12% | 0.08% |
10➔ | low smoke rectangle | Ignition_of_the_Spruce_Fire_in_Tulare_County_caught_from_Colvin_Mt_at_345_PM_FR-1175.jpg | 1080 x 1920 | 164px | 15.19% | 565px | 29.43% | 4.47% |
License #
NEMO: Nevada Smoke Detection Dataset is under Apache 2.0 license.
Citation #
If you make use of the NEMO data, please cite the following reference:
@dataset{NEMO,
  author={Amirhessam Yazdi and Heyang Qin and Connor Jordan and Lei Yang and Feng Yan},
  title={NEMO: Nevada Smoke Detection Dataset},
  year={2022},
  url={https://github.com/SayBender/Nemo}
}
If you are happy with Dataset Ninja and use provided visualizations and tools in your work, please cite us:
@misc{ visualization-tools-for-nemo-dataset,
  title = { Visualization Tools for NEMO Dataset },
  type = { Computer Vision Tools },
  author = { Dataset Ninja },
  howpublished = { \url{ https://datasetninja.com/nemo } },
  url = { https://datasetninja.com/nemo },
  journal = { Dataset Ninja },
  publisher = { Dataset Ninja },
  year = { 2026 },
  month = { jul },
  note = { visited on 2026-07-22 },
}
Download #
Dataset NEMO can be downloaded in Supervisely format:
As an alternative, it can be downloaded with dataset-tools package:
pip install --upgrade dataset-tools
… using following python code:
import dataset_tools as dtools

dtools.download(dataset='NEMO', dst_dir='~/dataset-ninja/')
Make sure not to overlook the python code example available on the Supervisely Developer Portal. It will give you a clear idea of how to effortlessly work with the downloaded dataset.
The data in original format can be downloaded here.
Disclaimer #
Our gal from the legal dep told us we need to post this:
Dataset Ninja provides visualizations and statistics for some datasets that can be found online and can be downloaded by general audience. Dataset Ninja is not a dataset hosting platform and can only be used for informational purposes. The platform does not claim any rights for the original content, including images, videos, annotations and descriptions. Joint publishing is prohibited.
You take full responsibility when you use datasets presented at Dataset Ninja, as well as other information, including visualizations and statistics we provide. You are in charge of compliance with any dataset license and all other permissions. You are required to navigate datasets homepage and make sure that you can use it. In case of any questions, get in touch with us at hello@datasetninja.com.