

Introduction #
The authors of the RGB part of the NeonTreeEvaluation Benchmark dataset aimed to address the challenges associated with broad-scale remote sensing for building forest inventories combining RGB, LiDAR, and hyperspectral sensor data from the USA National Ecological Observatory Network’s Airborne Observation Platform. The dataset includes over 6,000 image-annotated crowns, 400 field-annotated crowns, and 3,000 canopy stem points, covering a diverse range of forest types. An R package is provided to standardize evaluation metrics, facilitating method comparisons. Additionally, the dataset offers more than 10,000 training crowns for optional use.
RGB data
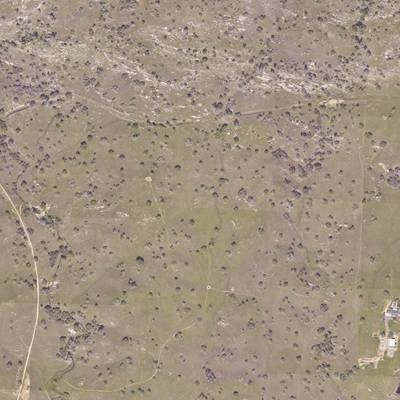
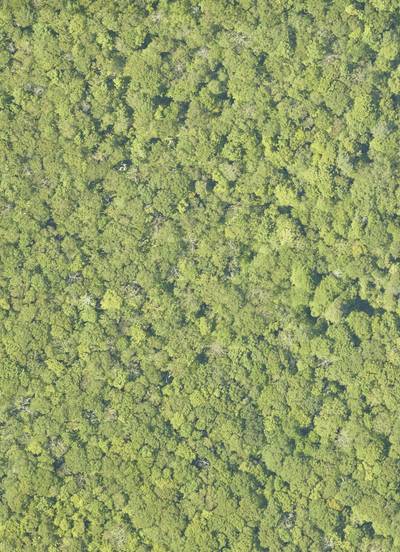
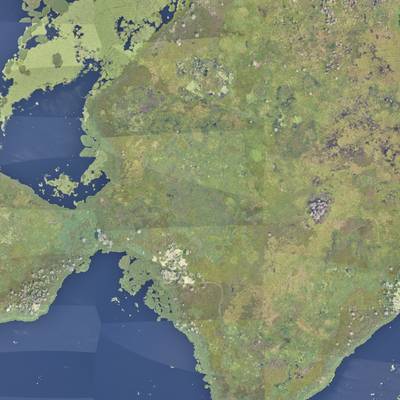
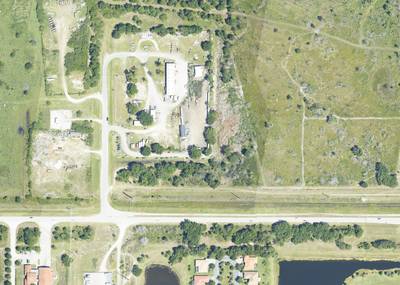
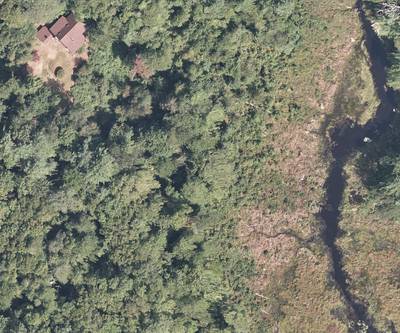
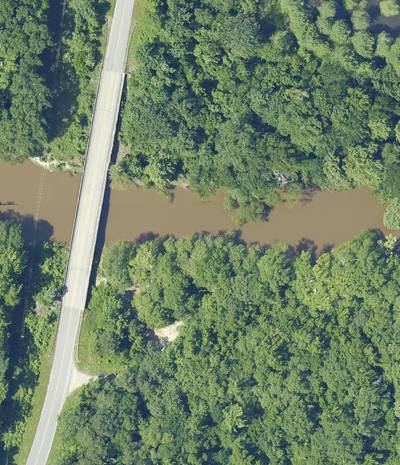
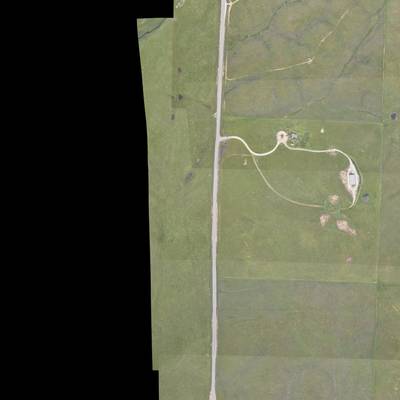
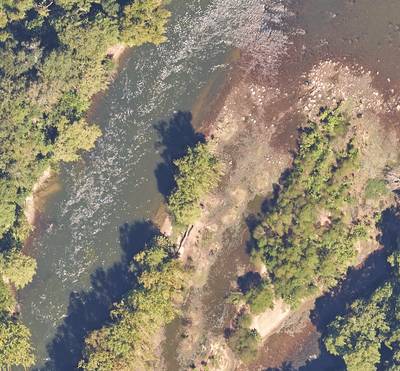
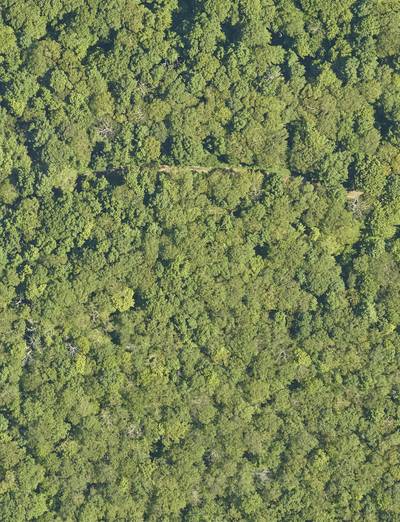
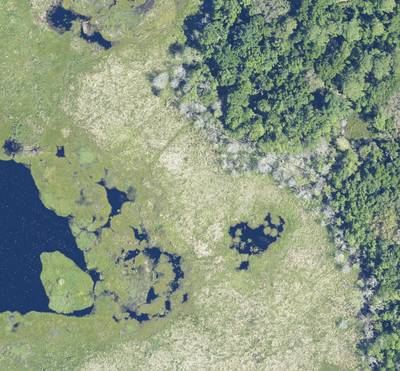
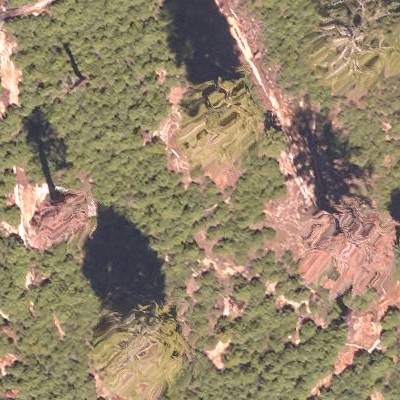
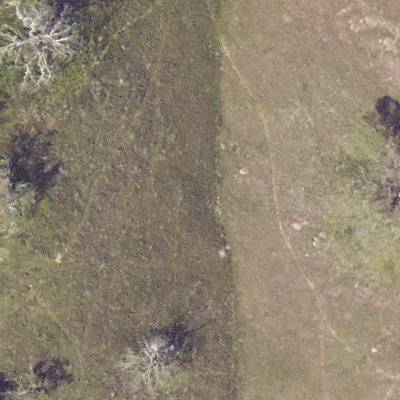
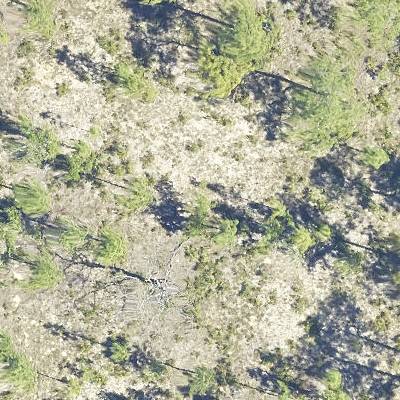
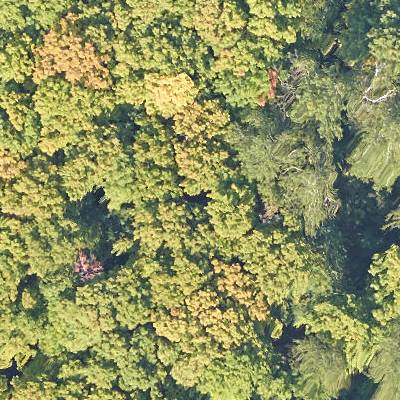
The RGB data were obtained using a D8900 camera with a format of 8,984 x 6,732 pixels. Individual images underwent color rectification, orthorectification, and mosaicking to generate a single raster image with a pixel size of 0.1 m^2. Mosaic tiles, available as 1000m x 1000m geoTIFF files, are named based on the UTM coordinate at the northwest origin. The high spatial resolution of RGB data allows the observation of individual canopy trees, discerning crown boundaries, and revealing color differences reflecting taxonomy and health status.
To ensure spatial overlap between LiDAR and RGB data, NEON staff superimposed the 0.1m spatial resolution RGB tile on a 1m spatial resolution LiDAR-derived surface height model.
LiDAR Point Cloud data
The LiDAR data consist of 3D coordinates (~5 points/m^2) providing detailed information about canopy crown shape and height. Stored as 1000m x 1000m .laz files, these files include x, y, z coordinates for each return, along with metadata on return intensity and point classification. The boundaries of individual canopy crowns often become apparent due to gaps among neighboring trees or variations in height among overlapping crowns.Notably, the point density of NEON LiDAR clouds is considerably lower than the densities (8–1000 pt/m^2) used in many studies of crown detection models.
Normalized LIDAR point cloud for evaluation plot SJER_064 from the San Joaquin Experimental Range, California (left) and MLBS_071 from Mountain
Lake Biological Station, Virginia. Points are colored by height above ground.
Hyperspectral surface reflectance data
NEON’s hyperspectral sensor captures reflected light across the visible and infrared spectrum (approximately 420–2500 nm) with a spectral sampling interval of 5nm, yielding a total of 426 bands. Orthorectified hyperspectral images, with a pixel size of 1 m^2 in 1000m x 1000m tiles aligning with RGB and LiDAR file conventions, are provided. Hyperspectral data, particularly in the infrared spectrum, proves valuable for distinguishing tree species based on spectral differences related to leaf chemistry and canopy structure. All hyperspectral data were collected during the same field campaign as RGB data, except for the UNDE site, where 2017 flight data was used due to the unavailability of 2019 RGB data.
Composite hyperspectral image (left) and corresponding RGB image (right) for the MLBS site. The composite image contains near infrared (940nm), red (650nm), and blue (430nm) channels. Trees that are difficult to segment in RGB imagery may be more separable in hyperspectral imagery due to the differing foliar chemical and structural properties of co-occurring trees.
Ecosystem Structure
The ‘Ecosystem Structure’ data product, provided by the authors of the dataset, represents a LiDAR-derived height raster at 1m spatial resolution, commonly referred to as a ‘canopy height model’ (CHM). The raster values denote the normalized height above ground for each grid cell. This dataset proves valuable for distinguishing crowns in three dimensions and for eliminating crowns below the 3m threshold utilized in this benchmark for minimum tree height.
Woody Plant Vegetation Structure
In conjunction with sensor data, the authors collect information on trees within fixed plots at each NEON site. This dataset includes data from two plot types: ‘distributed’ plots (20m x 20m fully sampled) and ‘Tower’ plots (40m x 40m with two sampled 20m x 20m quadrants). While the distinction between distributed and tower plots may prove useful for users familiar with NEON’s sampling regime, it is not essential for most uses of the benchmark dataset. The mapping and recording of all trees in sampled areas with a stem diameter exceeding 10cm are carried out, providing key tree metadata such as stem position, size, and estimated tree height.
Evaluation Annotations
The objective of this benchmark, as set by the authors of the dataset, is to evaluate algorithms for canopy tree detection and delineation. The term ‘canopy crown detection’ is adopted to differentiate between the tasks of ‘tree detection,’ involving the identification of the crown center of individual trees, and ‘crown delineation’ or ‘crown segmentation,’ often defined as identifying the boundary edge of individual crowns. The term ‘canopy’ is often implicitly assumed in most studies, given that optical data and low-density LiDAR data can only reflect the structure in the upper canopy. The evaluation of detection methods in this benchmark dataset involves assessing detections using three types of evaluation data: 1) image-annotated crown bounding boxes for 22 sites in the NEON network, 2) field-annotated crown polygons for two sites in the NEON network (Table 2), and 3) field-collected stem points from 14 sites from the NEON Woody Vegetation Structure dataset. For each of these data types, the authors outline how the data were collected and the evaluation procedure for canopy crown detection.
Image-Annotated Crowns
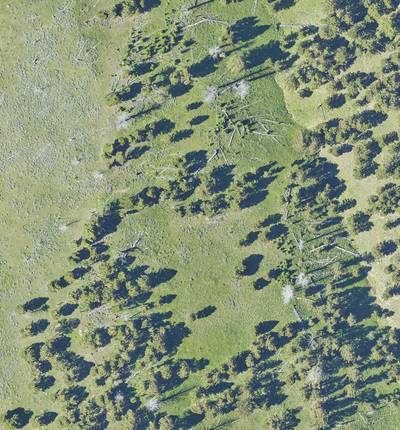
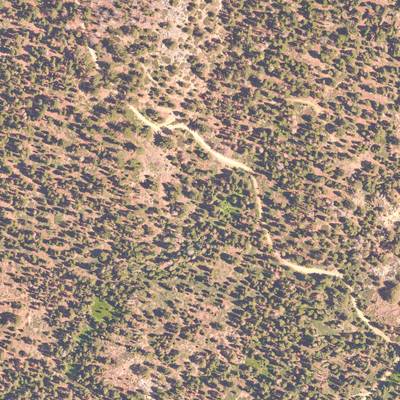
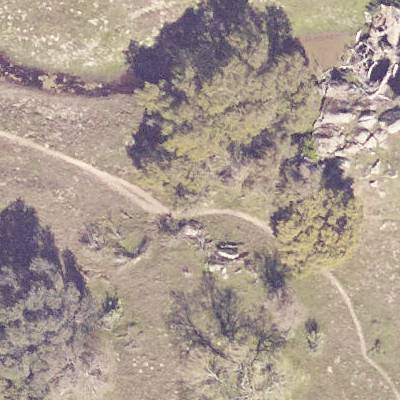
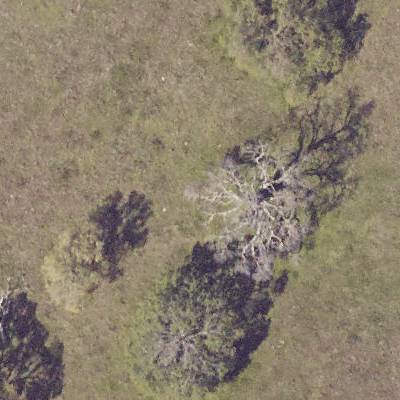
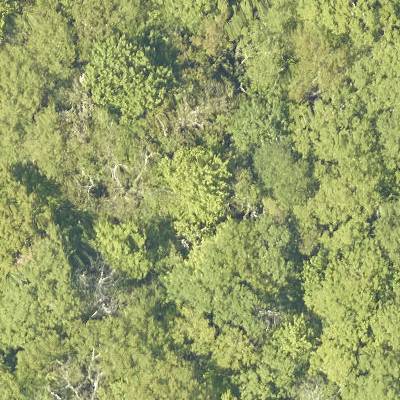
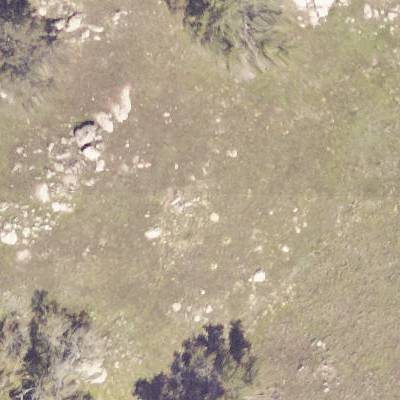
The authors selected airborne imagery from 22 sites surveyed by the NEON AOP. The sites were chosen based on the availability of the three types of sensor data, as well as representation of forest conditions across the US, including diversity in species composition, stand age, and canopy openness. The evaluation images were carefully annotated by comparing the RGB, LiDAR, and hyperspectral data. Using all three products facilitated more accurate distinction of neighboring trees by simultaneously assessing visual patterns (RGB), utilizing variation in spectral signatures to distinguish different species (hyperspectral), and considering the three-dimensional structure of the tree (LiDAR). The evaluation plot overlaps with a NEON 40m x 40m plot. Within each of these plots, NEON field crews survey a 20x20 subplot; therefore, while field data are available for most plots in the dataset, they do not cover every tree in the image.
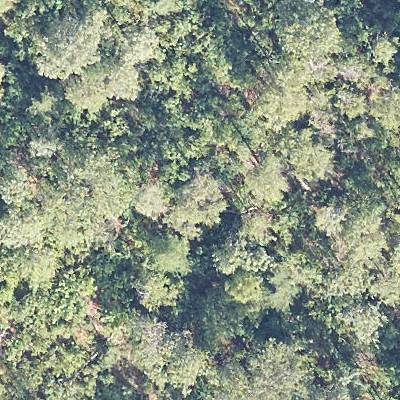
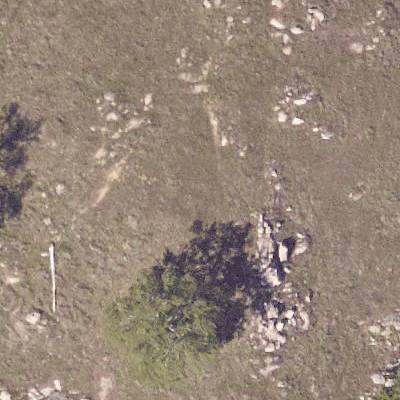
Image-annotated tree crowns for the evaluation data set for two sites in the National Ecological Observation Network. Using the RGB, LiDAR and hyperspectral products together contributes to more careful crown annotation. For some sites, such as MLBS (top row), the RGB and hyperspectral data are useful for differentiating overlapping crowns. For other sites, such as OSBS (bottom row) the LiDAR point cloud, shown as a rasterized height image, is most useful in capturing crown extent. The RGB-stretch image was produced by transforming the RGB data in the three principal components space. To create a three-band hyperspectral image, we used channels from the red, blue and infrared spectrum to capture changes in reflectance not apparent in the RGB imagery.
Field-Annotated Crowns
Individual trees were annotated by visiting two NEON sites and mapping the tree crown boundaries as polygons in the remote sensing images using a field tablet and GIS software while looking at each tree from the ground. False-color composites from the hyperspectral data, RGB, and LiDAR canopy height model were loaded onto tablet computers that were equipped with GPS receivers. While in the field, researchers digitized crown boundaries based on the location, size, and shape of the crown. Only alive trees with leaf-on vegetation were selected. Trees were mapped in 2014 and 2015, and all polygons were manually checked against the most recent NEON imagery. Adjustments to crown shape and position were refined after examining multiple years of RGB imagery. No adjustments to the polygons were made due to crown expansion.
Training Annotations
During their research on canopy crown detection algorithms, the authors annotated geographic tiles separate from the evaluation data. The training sites were selected to capture a range of forest conditions, including oak woodland (NEON site: SJER), mixed pine (TEAK), alpine forest (NIWO), riparian woodlands (LENO), southern pinelands (OSBS), and eastern deciduous forest (MLBS). The training tiles were chosen at random from the NEON data portal.
 Homepage
 Research Paper
 GitHub
Summary #
Data for the NeonTreeEvaluation Benchmark (RGB) is a dataset for an object detection task. It is used in the ecological research, and in the forestry domain.
The dataset consists of 2309 images with 30098 labeled objects belonging to 1 single class (tree).
Images in the NeonTreeEvaluation: RGB dataset have bounding box annotations. There are 2095 (91% of the total) unlabeled images (i.e. without annotations). There are 2 splits in the dataset: evaluation (2289 images) and training (20 images). Additionally, the images has site_id and site_name. The images in evaluation split are grouped by grid_id. Also, 175 images are marked with unnamed tag. The dataset was released in 2022 by the University of Florida.
Explore #
NeonTreeEvaluation: RGB dataset has 2309 images. Click on one of the examples below or open "Explore" tool anytime you need to view dataset images with annotations. This tool has extended visualization capabilities like zoom, translation, objects table, custom filters and more. Hover the mouse over the images to hide or show annotations.


Class balance #
There are 1 annotation classes in the dataset. Find the general statistics and balances for every class in the table below. Click any row to preview images that have labels of the selected class. Sort by column to find the most rare or prevalent classes.

Class ㅤ | Images ㅤ | Objects ㅤ | Count on image average | Area on image average |
|---|---|---|---|---|
tree➔ rectangle | 214 | 30098 | 140.64 | 36.43% |
Images #
Explore every single image in the dataset with respect to the number of annotations of each class it has. Click a row to preview selected image. Sort by any column to find anomalies and edge cases. Use horizontal scroll if the table has many columns for a large number of classes in the dataset.
Class sizes #
The table below gives various size properties of objects for every class. Click a row to see the image with annotations of the selected class. Sort columns to find classes with the smallest or largest objects or understand the size differences between classes.
Class | Object count | Avg area | Max area | Min area | Min height | Min height | Max height | Max height | Avg height | Avg height | Min width | Min width | Max width | Max width |
|---|---|---|---|---|---|---|---|---|---|---|---|---|---|---|
tree rectangle | 30098 | 0.27% | 14.6% | 0% | 2px | 0.05% | 232px | 46% | 41px | 3.01% | 2px | 0.02% | 243px | 43.25% |
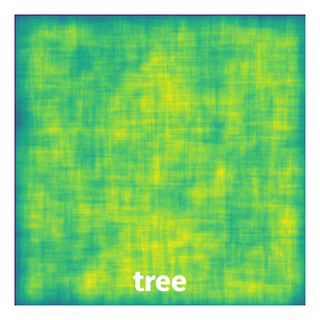
Spatial Heatmap #
The heatmaps below give the spatial distributions of all objects for every class. These visualizations provide insights into the most probable and rare object locations on the image. It helps analyze objects' placements in a dataset.
Objects #
Table contains all 30098 objects. Click a row to preview an image with annotations, and use search or pagination to navigate. Sort columns to find outliers in the dataset.
Object ID ㅤ | Class ㅤ | Image name click row to open | Image size height x width | Height ㅤ | Height ㅤ | Width ㅤ | Width ㅤ | Area ㅤ |
|---|---|---|---|---|---|---|---|---|
1➔ | tree rectangle | 2019_SJER_4_251000_4103000_image.tif.tiff | 10000 x 10000 | 24px | 0.24% | 24px | 0.24% | 0% |
2➔ | tree rectangle | 2019_SJER_4_251000_4103000_image.tif.tiff | 10000 x 10000 | 64px | 0.64% | 47px | 0.47% | 0% |
3➔ | tree rectangle | 2019_SJER_4_251000_4103000_image.tif.tiff | 10000 x 10000 | 53px | 0.53% | 43px | 0.43% | 0% |
4➔ | tree rectangle | 2019_SJER_4_251000_4103000_image.tif.tiff | 10000 x 10000 | 20px | 0.2% | 18px | 0.18% | 0% |
5➔ | tree rectangle | 2019_SJER_4_251000_4103000_image.tif.tiff | 10000 x 10000 | 27px | 0.27% | 23px | 0.23% | 0% |
6➔ | tree rectangle | 2019_SJER_4_251000_4103000_image.tif.tiff | 10000 x 10000 | 21px | 0.21% | 23px | 0.23% | 0% |
7➔ | tree rectangle | 2019_SJER_4_251000_4103000_image.tif.tiff | 10000 x 10000 | 25px | 0.25% | 24px | 0.24% | 0% |
8➔ | tree rectangle | 2019_SJER_4_251000_4103000_image.tif.tiff | 10000 x 10000 | 20px | 0.2% | 20px | 0.2% | 0% |
9➔ | tree rectangle | 2019_SJER_4_251000_4103000_image.tif.tiff | 10000 x 10000 | 19px | 0.19% | 24px | 0.24% | 0% |
10➔ | tree rectangle | 2019_SJER_4_251000_4103000_image.tif.tiff | 10000 x 10000 | 17px | 0.17% | 18px | 0.18% | 0% |
License #
Data for the NeonTreeEvaluation Benchmark is under CC BY 4.0 license.
Citation #
If you make use of the NeonTreeEvaluation data, please cite the following reference:
@dataset{ben_weinstein_2022_5914554,
  author       = {Ben Weinstein and
                  Sergio Marconi and
                  Ethan White},
  title        = {Data for the NeonTreeEvaluation Benchmark},
  month        = jan,
  year         = 2022,
  publisher    = {Zenodo},
  version      = {0.2.2},
  doi          = {10.5281/zenodo.5914554},
  url          = {https://doi.org/10.5281/zenodo.5914554}
}
If you are happy with Dataset Ninja and use provided visualizations and tools in your work, please cite us:
@misc{ visualization-tools-for-neon-tree-dataset,
  title = { Visualization Tools for NeonTreeEvaluation: RGB Dataset },
  type = { Computer Vision Tools },
  author = { Dataset Ninja },
  howpublished = { \url{ https://datasetninja.com/neon-tree } },
  url = { https://datasetninja.com/neon-tree },
  journal = { Dataset Ninja },
  publisher = { Dataset Ninja },
  year = { 2026 },
  month = { jul },
  note = { visited on 2026-07-22 },
}
Download #
Dataset NeonTreeEvaluation: RGB can be downloaded in Supervisely format:
As an alternative, it can be downloaded with dataset-tools package:
pip install --upgrade dataset-tools
… using following python code:
import dataset_tools as dtools

dtools.download(dataset='NeonTreeEvaluation: RGB', dst_dir='~/dataset-ninja/')
Make sure not to overlook the python code example available on the Supervisely Developer Portal. It will give you a clear idea of how to effortlessly work with the downloaded dataset.
The data in original format can be downloaded here:
Disclaimer #
Our gal from the legal dep told us we need to post this:
Dataset Ninja provides visualizations and statistics for some datasets that can be found online and can be downloaded by general audience. Dataset Ninja is not a dataset hosting platform and can only be used for informational purposes. The platform does not claim any rights for the original content, including images, videos, annotations and descriptions. Joint publishing is prohibited.
You take full responsibility when you use datasets presented at Dataset Ninja, as well as other information, including visualizations and statistics we provide. You are in charge of compliance with any dataset license and all other permissions. You are required to navigate datasets homepage and make sure that you can use it. In case of any questions, get in touch with us at hello@datasetninja.com.