
Introduction #
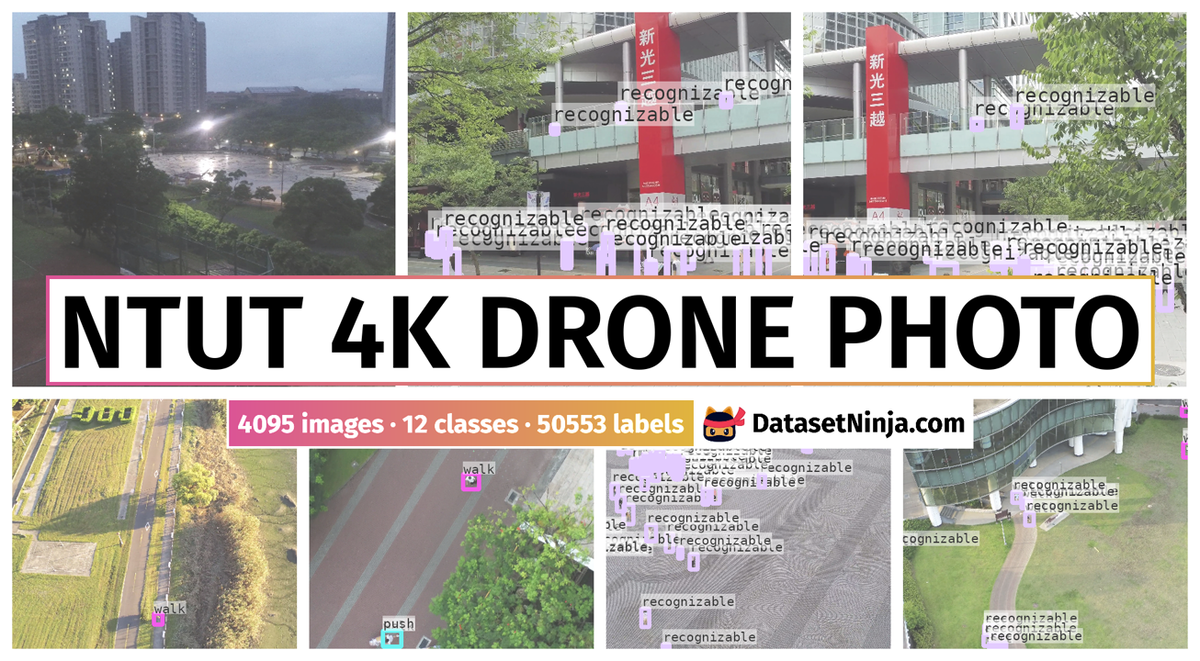
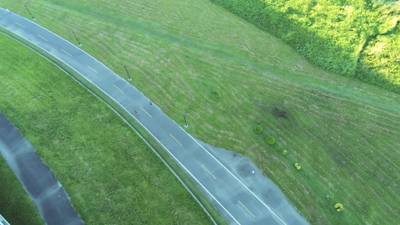
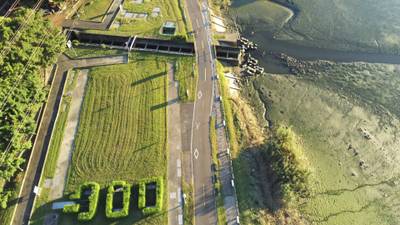
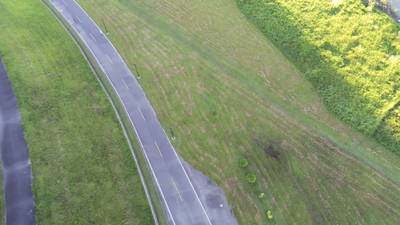
In the NTUT 4K Drone Photo Dataset for Human Detection authors furnish 4K photos extracted from drone videos captured in Taiwan. Authors claim, that contemporary drones are outfitted with 4K video cameras, and the heightened resolution of the images facilitates modern object detectors in discerning smaller objects. Despite this capability, many drone image datasets typically offer only downscaled images. The dataset is curated by the AIoT Lab at the National Taiwan University of Technology (NTUT).
Sometimes humans may be blocked. In this case, the following convention is proposed:
- block25 (Object is blocked 25~50%)
- block50 (Object is blocked 50~75%)
- block75 (Object is blocked 75~90%)
Also, the dataset propose recognizable objects for the purpose of identification task.
 Homepage
 Blog Post
 Competition
Summary #
NTUT 4K Drone Photo Dataset for Human Detection is a dataset for object detection and identification tasks. Possible applications of the dataset could be in the drone inspection domain.
The dataset consists of 4095 images with 50553 labeled objects belonging to 12 different classes including walk, recognizable, stand, and other: riding, sit, block50, block25, push, block75, watchphone, baseball, and soccer.
Images in the NTUT 4K Drone Photo dataset have bounding box annotations. There are 26 (1% of the total) unlabeled images (i.e. without annotations). There are 2 splits in the dataset: train (2156 images) and test (1939 images). Additionally, every recognizable class has its own id tag. The dataset was released in 2022 by the Taipei Tech AIoT Lab, Taiwan.
Explore #
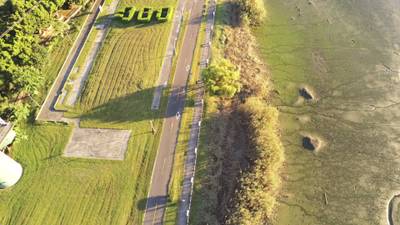
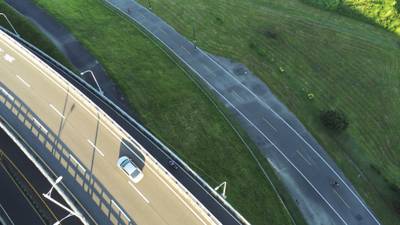
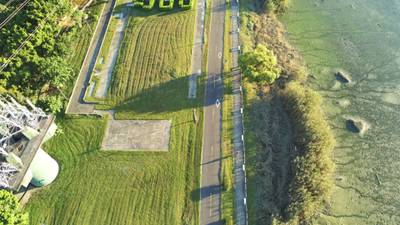
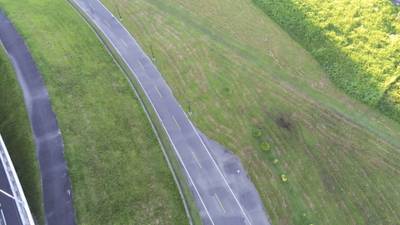
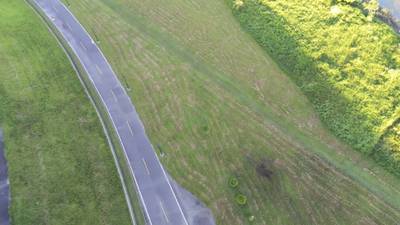
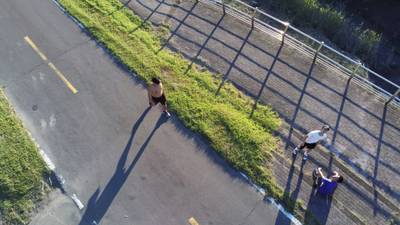
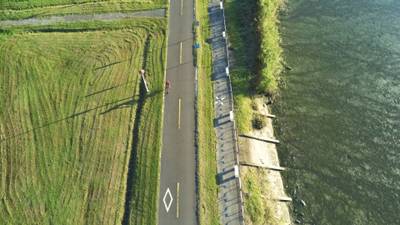
NTUT 4K Drone Photo dataset has 4095 images. Click on one of the examples below or open "Explore" tool anytime you need to view dataset images with annotations. This tool has extended visualization capabilities like zoom, translation, objects table, custom filters and more. Hover the mouse over the images to hide or show annotations.


Class balance #
There are 12 annotation classes in the dataset. Find the general statistics and balances for every class in the table below. Click any row to preview images that have labels of the selected class. Sort by column to find the most rare or prevalent classes.

Class ㅤ | Images ㅤ | Objects ㅤ | Count on image average | Area on image average |
|---|---|---|---|---|
walk➔ rectangle | 2486 | 9783 | 3.94 | 0.34% |
recognizable➔ rectangle | 1912 | 32388 | 16.94 | 2.32% |
stand➔ rectangle | 1291 | 3801 | 2.94 | 0.27% |
riding➔ rectangle | 681 | 2384 | 3.5 | 0.61% |
sit➔ rectangle | 428 | 905 | 2.11 | 0.17% |
block50➔ rectangle | 277 | 323 | 1.17 | 0.1% |
block25➔ rectangle | 241 | 282 | 1.17 | 0.14% |
push➔ rectangle | 176 | 177 | 1.01 | 0.13% |
block75➔ rectangle | 173 | 225 | 1.3 | 0.12% |
watchphone➔ rectangle | 147 | 167 | 1.14 | 0.12% |
Co-occurrence matrix #
Co-occurrence matrix is an extremely valuable tool that shows you the images for every pair of classes: how many images have objects of both classes at the same time. If you click any cell, you will see those images. We added the tooltip with an explanation for every cell for your convenience, just hover the mouse over a cell to preview the description.
Images #
Explore every single image in the dataset with respect to the number of annotations of each class it has. Click a row to preview selected image. Sort by any column to find anomalies and edge cases. Use horizontal scroll if the table has many columns for a large number of classes in the dataset.
Object distribution #
Interactive heatmap chart for every class with object distribution shows how many images are in the dataset with a certain number of objects of a specific class. Users can click cell and see the list of all corresponding images.
Class sizes #
The table below gives various size properties of objects for every class. Click a row to see the image with annotations of the selected class. Sort columns to find classes with the smallest or largest objects or understand the size differences between classes.
Class | Object count | Avg area | Max area | Min area | Min height | Min height | Max height | Max height | Avg height | Avg height | Min width | Min width | Max width | Max width |
|---|---|---|---|---|---|---|---|---|---|---|---|---|---|---|
recognizable rectangle | 32388 | 0.15% | 25.88% | 0.01% | 20px | 0.93% | 2160px | 100% | 145px | 6.72% | 12px | 0.31% | 996px | 25.94% |
walk rectangle | 9783 | 0.09% | 1.99% | 0.01% | 22px | 1.02% | 571px | 26.44% | 100px | 4.64% | 17px | 0.44% | 309px | 8.05% |
stand rectangle | 3801 | 0.09% | 3.83% | 0.01% | 28px | 1.3% | 569px | 26.34% | 93px | 4.3% | 22px | 0.57% | 649px | 16.9% |
riding rectangle | 2384 | 0.18% | 0.39% | 0.01% | 19px | 0.88% | 230px | 10.65% | 140px | 6.48% | 33px | 0.86% | 230px | 5.99% |
sit rectangle | 905 | 0.08% | 1.88% | 0.02% | 32px | 1.48% | 373px | 17.27% | 76px | 3.53% | 30px | 0.78% | 418px | 10.89% |
block50 rectangle | 323 | 0.08% | 1.14% | 0.01% | 22px | 1.02% | 404px | 18.7% | 86px | 3.99% | 25px | 0.65% | 234px | 6.09% |
block25 rectangle | 282 | 0.12% | 3.46% | 0.01% | 39px | 1.81% | 569px | 26.34% | 103px | 4.78% | 23px | 0.6% | 530px | 13.8% |
block75 rectangle | 225 | 0.09% | 0.43% | 0.01% | 19px | 0.88% | 197px | 9.12% | 87px | 4.01% | 20px | 0.52% | 246px | 6.41% |
push rectangle | 177 | 0.12% | 0.3% | 0.03% | 61px | 2.82% | 143px | 6.62% | 109px | 5.02% | 39px | 1.02% | 173px | 4.51% |
watchphone rectangle | 167 | 0.11% | 0.22% | 0.05% | 46px | 2.13% | 158px | 7.31% | 92px | 4.26% | 59px | 1.54% | 136px | 3.54% |
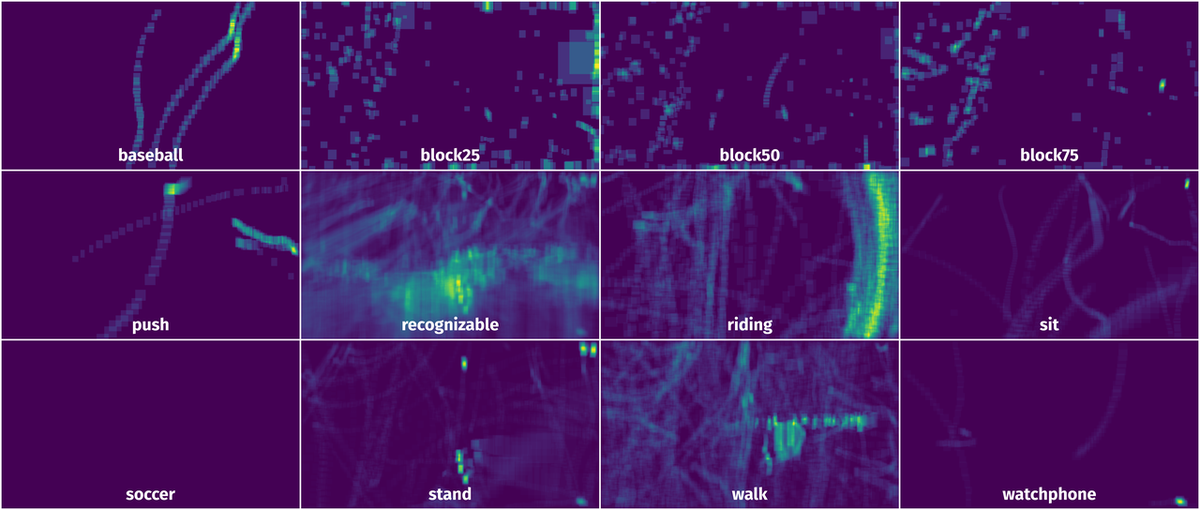
Spatial Heatmap #
The heatmaps below give the spatial distributions of all objects for every class. These visualizations provide insights into the most probable and rare object locations on the image. It helps analyze objects' placements in a dataset.
Objects #
Table contains all 50553 objects. Click a row to preview an image with annotations, and use search or pagination to navigate. Sort columns to find outliers in the dataset.
Object ID ㅤ | Class ㅤ | Image name click row to open | Image size height x width | Height ㅤ | Height ㅤ | Width ㅤ | Width ㅤ | Area ㅤ |
|---|---|---|---|---|---|---|---|---|
1➔ | recognizable rectangle | Drone_049.mp4_t-26.166667.jpg | 2160 x 3840 | 188px | 8.7% | 104px | 2.71% | 0.24% |
2➔ | recognizable rectangle | Drone_049.mp4_t-26.166667.jpg | 2160 x 3840 | 168px | 7.78% | 58px | 1.51% | 0.12% |
3➔ | recognizable rectangle | Drone_049.mp4_t-26.166667.jpg | 2160 x 3840 | 163px | 7.55% | 59px | 1.54% | 0.12% |
4➔ | recognizable rectangle | Drone_049.mp4_t-26.166667.jpg | 2160 x 3840 | 156px | 7.22% | 70px | 1.82% | 0.13% |
5➔ | recognizable rectangle | Drone_049.mp4_t-26.166667.jpg | 2160 x 3840 | 116px | 5.37% | 54px | 1.41% | 0.08% |
6➔ | recognizable rectangle | Drone_049.mp4_t-26.166667.jpg | 2160 x 3840 | 169px | 7.82% | 100px | 2.6% | 0.2% |
7➔ | recognizable rectangle | Drone_049.mp4_t-26.166667.jpg | 2160 x 3840 | 139px | 6.44% | 30px | 0.78% | 0.05% |
8➔ | recognizable rectangle | Drone_049.mp4_t-26.166667.jpg | 2160 x 3840 | 88px | 4.07% | 52px | 1.35% | 0.06% |
9➔ | recognizable rectangle | Drone_049.mp4_t-26.166667.jpg | 2160 x 3840 | 58px | 2.69% | 22px | 0.57% | 0.02% |
10➔ | recognizable rectangle | Drone_049.mp4_t-26.166667.jpg | 2160 x 3840 | 144px | 6.67% | 62px | 1.61% | 0.11% |
License #
License is unknown for the NTUT 4K Drone Photo Dataset for Human Detection dataset.
Citation #
If you make use of the NTUT 4K Drone Photo data, please cite the following reference:
@dataset{NTUT 4K Drone Photo,
  author={Kuan-Ting (K. T.) Lai},
  title={NTUT 4K Drone Photo Dataset for Human Detection},
  year={2022},
  url={https://www.kaggle.com/datasets/kuantinglai/ntut-4k-drone-photo-dataset-for-human-detection/data}
}
If you are happy with Dataset Ninja and use provided visualizations and tools in your work, please cite us:
@misc{ visualization-tools-for-ntut-4k-drone-photo-dataset,
  title = { Visualization Tools for NTUT 4K Drone Photo Dataset },
  type = { Computer Vision Tools },
  author = { Dataset Ninja },
  howpublished = { \url{ https://datasetninja.com/ntut-4k-drone-photo } },
  url = { https://datasetninja.com/ntut-4k-drone-photo },
  journal = { Dataset Ninja },
  publisher = { Dataset Ninja },
  year = { 2026 },
  month = { jul },
  note = { visited on 2026-07-20 },
}
Download #
Please visit dataset homepage to download the data.
Disclaimer #
Our gal from the legal dep told us we need to post this:
Dataset Ninja provides visualizations and statistics for some datasets that can be found online and can be downloaded by general audience. Dataset Ninja is not a dataset hosting platform and can only be used for informational purposes. The platform does not claim any rights for the original content, including images, videos, annotations and descriptions. Joint publishing is prohibited.
You take full responsibility when you use datasets presented at Dataset Ninja, as well as other information, including visualizations and statistics we provide. You are in charge of compliance with any dataset license and all other permissions. You are required to navigate datasets homepage and make sure that you can use it. In case of any questions, get in touch with us at hello@datasetninja.com.