Introduction #
nuImages: A Multimodal Dataset for Autonomous Driving was developed by the authors as an addition to the widely acclaimed nuScenes dataset. The strength of nuScenes is in the 1000 carefully curated scenes with 3d annotations, which cover many challenging driving situations. nuImages providing 93,000 2d annotated images from a much larger pool of data. A number of related image datasets for autonomous driving were released in the past. The authors believe that nuImages can complement the existing offerings by virtue of its size and because it is part of the bigger nuScenes ecosystem that features 3d cuboids, lidar segmentation labels, 2d boxes, instance masks and 2d segmentation masks.
Dataset creation
The researchers conducted driving experiments in Boston (Seaport and South Boston) and Singapore (One North, Holland Village, and Queenstown), selecting these cities for their reputation of dense traffic and complex driving scenarios. Emphasis was placed on capturing the diversity across locations, including variations in vegetation, buildings, vehicles, road markings, and traffic directions (right versus left-hand traffic).
From an extensive pool of training data, the authors manually identified 84 logs containing 15 hours of driving data, covering a distance of 242 kilometers at an average speed of 16 km/h. The driving routes were meticulously chosen to encompass a broad spectrum of locations (urban, residential, nature, and industrial), times of day (day and night), and weather conditions (sun, rain, and clouds).
To avoid redundant annotations in the nuScenes dataset, where annotating 1.4 million images with 2D annotations would be impractical, the authors decided to label a more diverse large-scale image dataset from nearly 500 logs (compared to 83 in nuScenes). The resulting set of 93,000 images was selected using two distinct approaches. Active learning techniques were employed to designate approximately 75% of the images as challenging, focusing on the uncertainty of an image-based object detector, with particular attention to rare classes like bicycles. The remaining 25% of the images were uniformly sampled to ensure a representative dataset and mitigate strong biases.
Through meticulous review, some images were discarded due to camera artifacts, excessive darkness, or the inclusion of pedestrians’ faces. This careful curation aimed to achieve a diverse dataset in terms of class distribution, spatiotemporal distribution, and varied weather and lighting conditions. The annotated images encompass scenarios involving rain, snow, and nighttime, crucial for autonomous driving applications. Additionally, the authors included six past and six future camera images at 2 Hz for each annotated image, providing a temporal dynamic aspect to the dataset. Consequently, nuImages comprises 93,000 video clips, each containing 13 frames spaced out at 2 Hz.
The authors labeled a total of 93,000 images with instance masks and 2d boxes for 800k foreground objects and 100k semantic segmentation masks.
Example of labeled image.
The foreground objects additionally have attribute annotations such as whether a motorcycle has a rider, the pose of a pedestrian, the activity of a vehicle, flashing emergency lights and whether an animal is flying.
| Attribute | Frequency | Ratio in this attribute group |
|---|---|---|
| cycle.with_rider | 8,075 | 22.4% |
| cycle.without_rider | 28,036 | 77.6% |
| pedestrian.moving | 102,066 | 61.4% |
| pedestrian.sitting_lying | 16,378 | 9.9% |
| pedestrian.standing | 47,702 | 28.7% |
| vehicle.moving | 116,855 | 38.3% |
| vehicle.parked | 162,360 | 53.2% |
| vehicle.stopped | 25,775 | 8.5% |
| vehicle_light.emergency.flashing | 33 | 18.0% |
| vehicle_light.emergency.not_flashing | 150 | 82.0% |
| vertical_position.off_ground | 33 | 12.9% |
| vertical_position.on_ground | 222 | 87.1% |
Attribute frequencies (excl. test set).
An attribute desc is a property of an instance that can change while the category remains the same. Example: a vehicle being parked/stopped/moving, and whether or not a bicycle has a rider. category is used for the taxonomy of object and surface categories. Example: vehicle -> car.
Summary #
nuImages: A Multimodal Dataset for Autonomous Driving is a dataset for instance segmentation, semantic segmentation, and object detection tasks. It is used in the automotive industry.
The dataset consists of 93476 images with 2122939 labeled objects belonging to 25 different classes including driveable surface, car, adult, and other: truck, trafficcone, barrier, ego, motorcycle, bicycle, rigid, construction worker, construction, bicycle rack, pushable pullable, trailer, debris, child, personal mobility, police officer, stroller, animal, bendy, police, ambulance, and wheelchair.
Images in the nuImages dataset have pixel-level instance segmentation and bounding box annotations. Due to the nature of the instance segmentation task, it can be automatically transformed into a semantic segmentation task (only one mask for every class). There are 11858 (13% of the total) unlabeled images (i.e. without annotations). There are 3 splits in the dataset: train (67279 images), val (16445 images), and test (9752 images). Additionally, labels have category tag, attribute desc, attribute, category desc. Also every image contains information about its sensor. The dataset was released in 2020 by the NuTonomy.
Here are the visualized examples for the classes:
Explore #
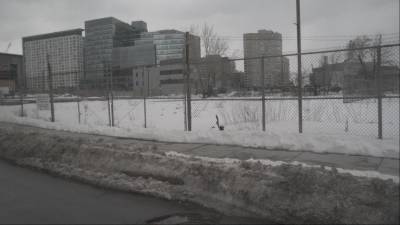
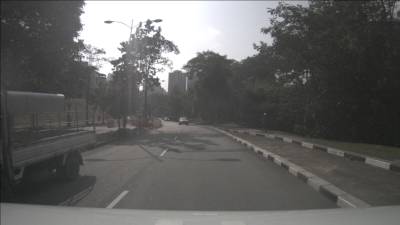
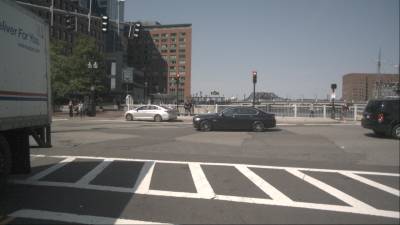
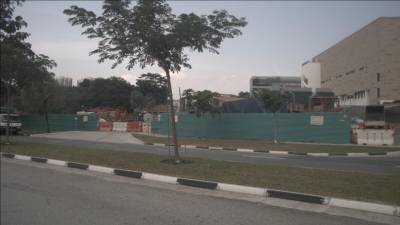
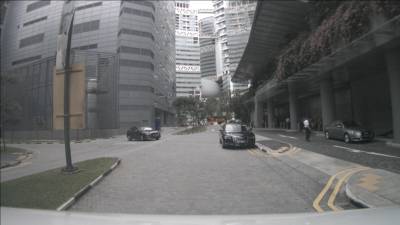
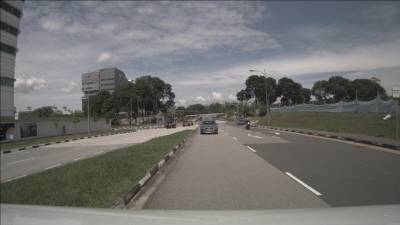
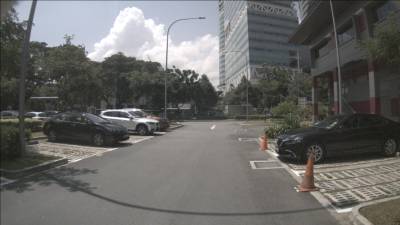
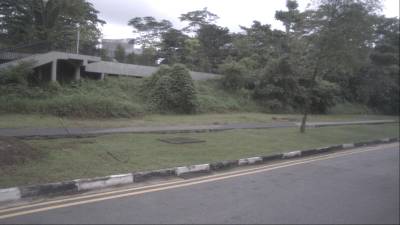
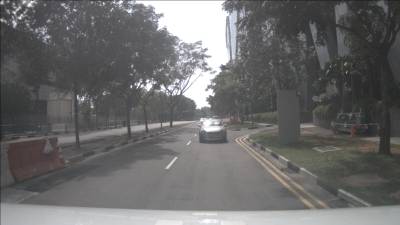
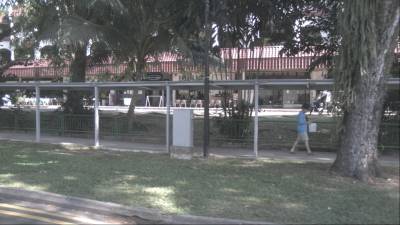
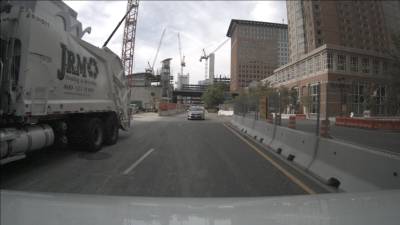
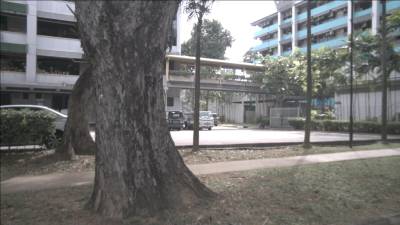
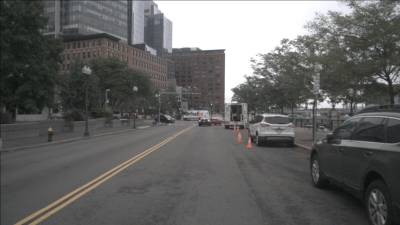
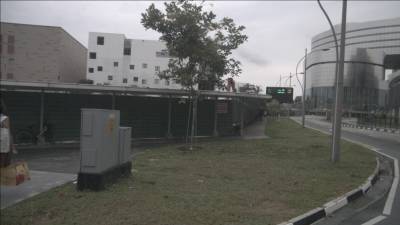
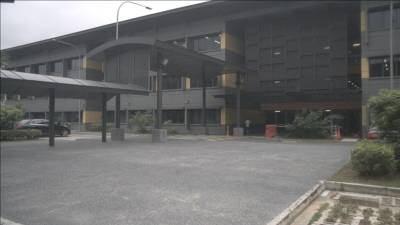
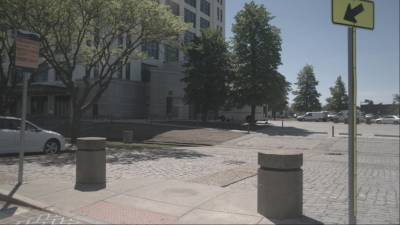
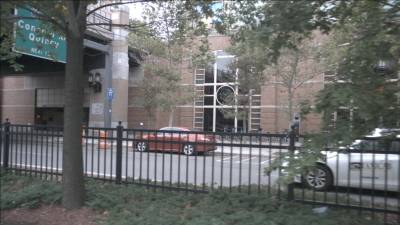
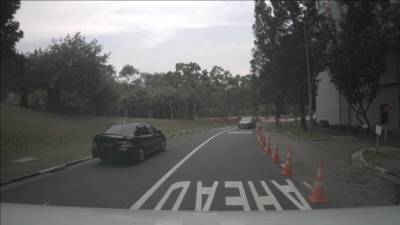
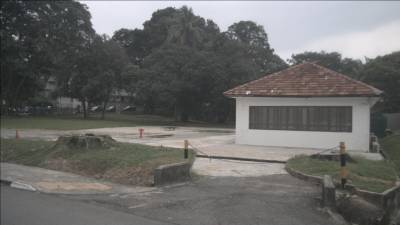
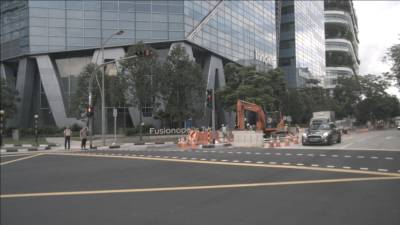
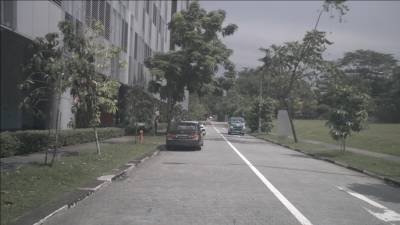
nuImages dataset has 93476 images. Click on one of the examples below or open "Explore" tool anytime you need to view dataset images with annotations. This tool has extended visualization capabilities like zoom, translation, objects table, custom filters and more. Hover the mouse over the images to hide or show annotations.






























Class balance #
There are 25 annotation classes in the dataset. Find the general statistics and balances for every class in the table below. Click any row to preview images that have labels of the selected class. Sort by column to find the most rare or prevalent classes.
Class ㅤ | Images ㅤ | Objects ㅤ | Count on image average | Area on image average |
|---|---|---|---|---|
driveable surface➔ any | 78151 | 465236 | 5.95 | 21.16% |
car➔ any | 56517 | 634505 | 11.23 | 5.31% |
adult➔ any | 40241 | 325286 | 8.08 | 0.99% |
truck➔ any | 23499 | 93465 | 3.98 | 4.68% |
trafficcone➔ any | 22194 | 184178 | 8.3 | 0.78% |
barrier➔ any | 13607 | 202762 | 14.9 | 4.69% |
ego➔ any | 13605 | 13607 | 1 | 9.17% |
motorcycle➔ any | 12523 | 39122 | 3.12 | 1.89% |
bicycle➔ any | 11883 | 43909 | 3.7 | 1.28% |
rigid➔ any | 7042 | 24378 | 3.46 | 4.08% |
Co-occurrence matrix #
Co-occurrence matrix is an extremely valuable tool that shows you the images for every pair of classes: how many images have objects of both classes at the same time. If you click any cell, you will see those images. We added the tooltip with an explanation for every cell for your convenience, just hover the mouse over a cell to preview the description.
Images #
Explore every single image in the dataset with respect to the number of annotations of each class it has. Click a row to preview selected image. Sort by any column to find anomalies and edge cases. Use horizontal scroll if the table has many columns for a large number of classes in the dataset.
Class sizes #
The table below gives various size properties of objects for every class. Click a row to see the image with annotations of the selected class. Sort columns to find classes with the smallest or largest objects or understand the size differences between classes.
Class | Object count | Avg area | Max area | Min area | Min height | Min height | Max height | Max height | Avg height | Avg height | Min width | Min width | Max width | Max width |
|---|---|---|---|---|---|---|---|---|---|---|---|---|---|---|
car any | 634505 | 0.87% | 100% | 0% | 2px | 0.22% | 900px | 100% | 61px | 6.76% | 2px | 0.12% | 1600px | 100% |
driveable surface any | 465236 | 3.53% | 51.47% | 0% | 2px | 0.22% | 789px | 87.67% | 88px | 9.72% | 2px | 0.12% | 1600px | 100% |
adult any | 325286 | 0.19% | 51.38% | 0% | 2px | 0.22% | 839px | 93.22% | 71px | 7.89% | 2px | 0.12% | 899px | 56.19% |
barrier any | 202762 | 0.6% | 35.26% | 0% | 2px | 0.22% | 702px | 78% | 62px | 6.84% | 2px | 0.12% | 1599px | 99.94% |
trafficcone any | 184178 | 0.14% | 12.94% | 0% | 2px | 0.22% | 455px | 50.56% | 55px | 6.11% | 2px | 0.12% | 1008px | 63% |
truck any | 93465 | 2.02% | 100% | 0% | 2px | 0.22% | 900px | 100% | 97px | 10.82% | 2px | 0.12% | 1600px | 100% |
bicycle any | 43909 | 0.51% | 39.64% | 0% | 2px | 0.22% | 697px | 77.44% | 77px | 8.55% | 2px | 0.12% | 925px | 57.81% |
motorcycle any | 39122 | 0.99% | 63.01% | 0% | 2px | 0.22% | 635px | 70.56% | 93px | 10.36% | 2px | 0.12% | 1429px | 89.31% |
construction worker any | 30239 | 0.26% | 17.54% | 0% | 2px | 0.22% | 650px | 72.22% | 76px | 8.4% | 2px | 0.12% | 451px | 28.19% |
rigid any | 24378 | 2.05% | 100% | 0% | 3px | 0.33% | 900px | 100% | 91px | 10.09% | 2px | 0.12% | 1600px | 100% |
Spatial Heatmap #
The heatmaps below give the spatial distributions of all objects for every class. These visualizations provide insights into the most probable and rare object locations on the image. It helps analyze objects' placements in a dataset.

Objects #
Table contains all 99204 objects. Click a row to preview an image with annotations, and use search or pagination to navigate. Sort columns to find outliers in the dataset.
Object ID ㅤ | Class ㅤ | Image name click row to open | Image size height x width | Height ㅤ | Height ㅤ | Width ㅤ | Width ㅤ | Area ㅤ |
|---|---|---|---|---|---|---|---|---|
1➔ | car any | n013-2018-08-27-14-41-26+0800__CAM_BACK__1535352519437005.jpg | 900 x 1600 | 59px | 6.56% | 131px | 8.19% | 0.38% |
2➔ | car any | n013-2018-08-27-14-41-26+0800__CAM_BACK__1535352519437005.jpg | 900 x 1600 | 60px | 6.67% | 135px | 8.44% | 0.56% |
3➔ | car any | n013-2018-08-27-14-41-26+0800__CAM_BACK__1535352519437005.jpg | 900 x 1600 | 21px | 2.33% | 24px | 1.5% | 0.03% |
4➔ | car any | n013-2018-08-27-14-41-26+0800__CAM_BACK__1535352519437005.jpg | 900 x 1600 | 22px | 2.44% | 27px | 1.69% | 0.04% |
5➔ | car any | n013-2018-08-27-14-41-26+0800__CAM_BACK__1535352519437005.jpg | 900 x 1600 | 140px | 15.56% | 185px | 11.56% | 1.4% |
6➔ | car any | n013-2018-08-27-14-41-26+0800__CAM_BACK__1535352519437005.jpg | 900 x 1600 | 144px | 16% | 173px | 10.81% | 1.73% |
7➔ | car any | n013-2018-08-27-14-41-26+0800__CAM_BACK__1535352519437005.jpg | 900 x 1600 | 94px | 10.44% | 114px | 7.12% | 0.59% |
8➔ | car any | n013-2018-08-27-14-41-26+0800__CAM_BACK__1535352519437005.jpg | 900 x 1600 | 97px | 10.78% | 117px | 7.31% | 0.79% |
9➔ | ego any | n013-2018-08-27-14-41-26+0800__CAM_BACK__1535352519437005.jpg | 900 x 1600 | 91px | 10.11% | 1599px | 99.94% | 7.28% |
10➔ | driveable surface any | n013-2018-08-27-14-41-26+0800__CAM_BACK__1535352519437005.jpg | 900 x 1600 | 372px | 41.33% | 1563px | 97.69% | 24.03% |
License #
nuScenes: A multimodal dataset for autonomous driving is under CC BY-NC-SA 4.0 license.
Citation #
If you make use of the nuImages data, please cite the following reference:
@article{nuscenes2019,
  title={nuScenes: A multimodal dataset for autonomous driving},
  author={Holger Caesar and Varun Bankiti and Alex H. Lang and Sourabh Vora and
          Venice Erin Liong and Qiang Xu and Anush Krishnan and Yu Pan and
          Giancarlo Baldan and Oscar Beijbom},
  journal={arXiv preprint arXiv:1903.11027},
  year={2019}
}
If you are happy with Dataset Ninja and use provided visualizations and tools in your work, please cite us:
@misc{ visualization-tools-for-nu-images-dataset,
  title = { Visualization Tools for nuImages Dataset },
  type = { Computer Vision Tools },
  author = { Dataset Ninja },
  howpublished = { \url{ https://datasetninja.com/nu-images } },
  url = { https://datasetninja.com/nu-images },
  journal = { Dataset Ninja },
  publisher = { Dataset Ninja },
  year = { 2026 },
  month = { feb },
  note = { visited on 2026-02-05 },
}
Download #
Dataset nuImages can be downloaded in Supervisely format:
As an alternative, it can be downloaded with dataset-tools package:
pip install --upgrade dataset-tools
… using following python code:
import dataset_tools as dtools

dtools.download(dataset='nuImages', dst_dir='~/dataset-ninja/')
Make sure not to overlook the python code example available on the Supervisely Developer Portal. It will give you a clear idea of how to effortlessly work with the downloaded dataset.
The data in original format can be downloaded here.
Disclaimer #
Our gal from the legal dep told us we need to post this:
Dataset Ninja provides visualizations and statistics for some datasets that can be found online and can be downloaded by general audience. Dataset Ninja is not a dataset hosting platform and can only be used for informational purposes. The platform does not claim any rights for the original content, including images, videos, annotations and descriptions. Joint publishing is prohibited.
You take full responsibility when you use datasets presented at Dataset Ninja, as well as other information, including visualizations and statistics we provide. You are in charge of compliance with any dataset license and all other permissions. You are required to navigate datasets homepage and make sure that you can use it. In case of any questions, get in touch with us at hello@datasetninja.com.


