
Introduction #
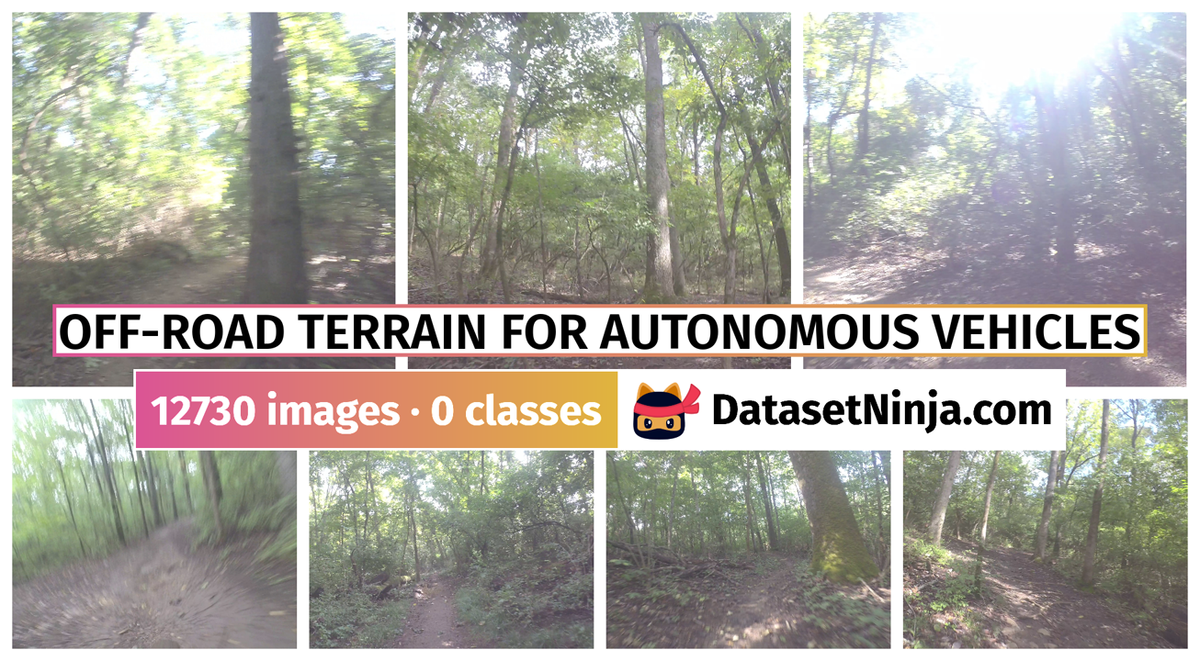
An extensive Off-Road Terrain dataset comprises more than 12,000 images captured through a monocular camera. Additionally, the dataset includes sensor data derived from GPS, IMUs, and a wheel rotation speed sensor. Notably, the IMU z-axis acceleration readings were utilized to compute eight potential measures of terrain roughness. These measures can be employed for labeling images and assessing their effectiveness.
While there has been significant attention on the development of autonomous vehicles for road use in recent years, with over 1,400 such vehicles undergoing testing in the United States by more than 80 companies in 2019, it is equally vital to explore the capabilities of autonomous vehicles in off-road environments. The autonomous vehicle industry, which aims for “Level 5” autonomy, enabling vehicles to operate autonomously under all conditions, must also be prepared for off-road scenarios. This readiness ensures that autonomous vehicles can safely navigate unexpected situations or routes with unmarked or unpaved terrains.
Motivation
This section first describes the following three challenges involved in preparing an off-road terrain dataset:
-
Lack of relevant off-road terrain data. Data collection at scale for roadway autonomous vehicles is relatively feasible due to the vast network of roads on which humans driving vehicles equipped with sensors can travel to collect data. In contrast, there is a much smaller network of relevant off-road drivable terrain.
-
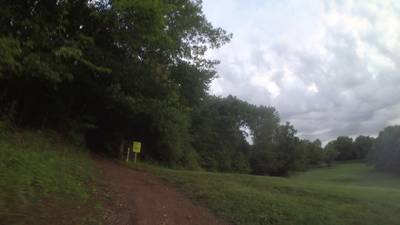
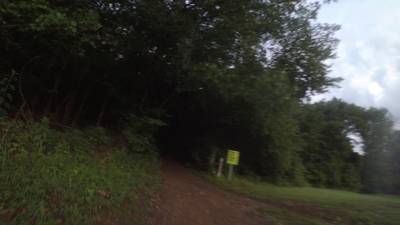
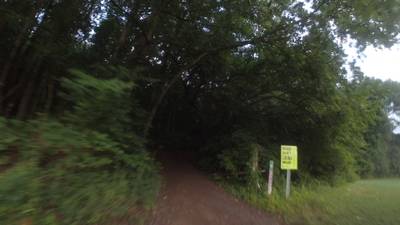
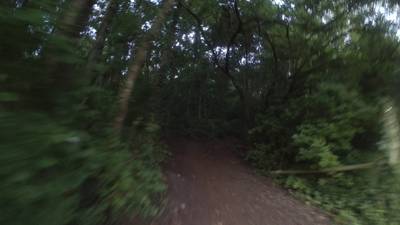
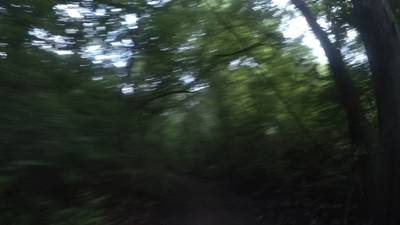
Traversing rough off-road terrain can cause an unsteady camera, which yields images where any drivable terrain ahead is not clearly visible. Moreover, trees surround most of the drivable portions of off-road terrain. Images are therefore susceptible to poor lighting and uneven sunlight that may obstruct the image view.
-
Labeling images of upcoming drivable terrain with a single quantitative roughness metric derived from IMU z-axis acceleration readings is hard because the length of terrain visible in an image may be unknown. As a result, determining the z-axis acceleration readings corresponding to the upcoming drivable terrain in the image is challenging. Validating that a given roughness metric effectively labels the images in the dataset is also hard because a human may not have intuitive insight as to how the vehicle’s motion will be affected by traversing this terrain, even though certain visual cues may be indicative of terrain roughness.
Data Acquisition
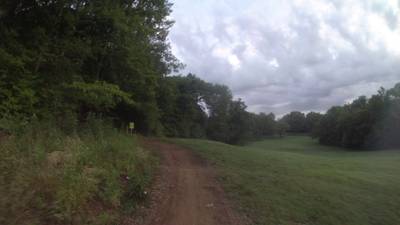
The Off-Road Terrain data was collected in Percy Warner Park in Nashville, Tennessee, USA via a mountain bike equipped with the following sensors: dual GPS receivers (Garmin 830), dual-high resolution IMUs (Garmin Virb Ultra), a 4k 30fps camera time synchronized to both accelerometers (Garmin Virb Ultra), and a wheel rotation speed sensor (Garmin Bike Speed Sensor 2). Data was collected on five different dates between late July and early October 2020.
The dataset contains two forms of data: sensor data and image frames extracted from video data. The videos were taken by a single monocular camera attached to the bike’s handlebars. Image frames were extracted at one-second intervals to minimize overlap between frames. The frame rate of the authors’ camera was ∼29.97 frames per second. It therefore was not possible to extract image frames at exactly one-second intervals, so instead authors found the image frame most closely corresponding to each second interval.
Image frames are named by their UTC timestamps in seconds and milliseconds (e.g., “1000s100ms”). The authors generated 12,982 images over nearly 44 miles of off-road terrain. Authors then excluded all images containing sensitive information (e.g., pictures of other bikers and license plates) and images taken before or after the bike travelled the off-road trail, resulting in 12,730 images included in the authors’ public dataset.
These images are not filtered by whether they contain a path, optimal lighting, or sufficient visible terrain for terrain learning so that researchers have access to the entire range of images collected by the vehicle. The size of each image is 3,840x2,160 pixels. Sensor data is stored in a format called a “fit file.” Authors converted fit files to comma-separated-value (CSV) files using tools provided by Garmin. The authors then formatted each CSV to a state-based representation where each row contains the readings at a single timestamp and add UTC timestamps to each reading so the data can be used alongside the image frames. This dataset contains the information described below
- Formatted sensor data. There is a folder for each data collection session with the following CSVs.
- accelerometer_calibrated split.csv which contains the calibrated and uncalibrated acceleration readings from the accelerometer, taken ∼10 ms apart.
- gyroscope_calibrated split.csv which contains the calibrated and uncalibrated readings from the gyroscope, taken ∼10 ms apart.
- magnetometer_split.csv, which contains the uncalibrated magnetometer readings.
- gps.csv, which contains the vehicle’s latitude, longitude, altitude, speed, heading, and velocity, taken ∼100 ms apart.
- record.csv, which contains the vehicle’s latitude, longitude, distance travelled, speed, and altitude, taken 1 second apart.
- Roughness labels for images. CSVs of the eight potential roughness labels for the subset of images valid for these labelling schemas are included, as described in Section V in the source.
- labels_tsm1.csv contains Labels 1–4.
- labels_tsm2.csv contians Labels 5–8.
The accelerometer, gyroscope, magnetometer, and GPS CSV files contain system timestamps that represent the relative time since the start of the data collection session, and calculated UTC timestamps. The GPS CSV file also contains a UTC timestamp recorded by the sensor, which may not always align with the calculated UTC timestamp due to sensor lags at certain parts of the forest. Calibrated readings correspond directly to the x-, y-, and z-axes and are in the conventionally understood units. The authors’ data did not contain the calibration factor necessary to calibrate the magnetometer CSV, meaning that the x-, y-, and z-axis readings may not correspond directly to these axes. The speed and velocity readings in the GPS CSV file are GPS estimates and are significantly less accurate than the speed readings in the record CSV file, which are recorded from the wheel rotation speed sensor.
Roughness Metric
Many studies have used z-axis acceleration to examine terrain roughness. This measure provides insight about how the vehicle’s motion will be affected b traversing the upcoming terrain. Although Stavens et al. standardized their measure of roughness by speed, authors used a different approach with their roughness metrics since their data did not exhibit a linear relationship between z-axis acceleration and speed, likely because the speeds of their vehicle (i.e., a bicycle) were significantly slower than the vehicle (i.e., a car) used by Stavens et al. Their roughness metric takes the standard deviation of a 1-second window of z-axis acceleration readings. This metric is a comprehensive measure of the terrain in the sample and is stable when the sample’s mean is nonzero (such as travelling down a hill with increasing acceleration). While authors’ samples could reflect between 1–7 meters since the vehicle’s speed was typically between 1–7 m/s, standard sample size was important to avoid certain samples being more susceptible to outliers than others.
The authors then determined which 1-second window of z-axis acceleration readings should be used to label each image. The bike travelled along particularly rough terrain, causing the angle and position of the camera to vary. The amount of upcoming terrain and its distance from the vehicle was therefore not constant across all images. For this reason, they decided to examine two terrain sampling approaches:
- Terrain Sampling Method 1 (TSM 1), which used a 1-second sampling of z-axis acceleration readings centered around the timestamp corresponding to 5 meters ahead of the image.
- Terrain Sampling Method 2 (TSM 2), which used a 1-second sampling of z-axis acceleration readings directly ahead of the image’s timestamp.
Authors discretized the continuous roughness metric using each of four methods: data visualization (examining the data distribution and z-axis acceleration readings alongside the continuous roughness metric), k-means clustering with k = 2, k-means clustering with k = 3, and k-means clustering with k = 4. These methods will be referred to as original groups, k = 2 groups, k = 3 groups, and k = 4 groups, respectively. In calculating the 1-second sample for TSM 1, only 0.99 seconds of readings were included.
Labeling Images
Each image was assigned eight labels, one for each possible
combination of the two methods of sampling the terrain and
the four methods of discretizing the roughness metric:
- Label 1: TSM 1, original groups.
- Label 2: TSM 1, k = 2 groups.
- Label 3: TSM 1, k = 3 groups.
- Label 4: TSM 1, k = 4 groups.
- Label 5: TSM 2, original groups.
- Label 6: TSM 2, k = 2 groups.
- Label 7: TSM 2, k = 3 groups.
- Label 8: TSM 2, k = 4 groups.
The authors filtered the 12,982 images in their dataset based on sensor and visual criteria, which resulted in 7,070 images valid for Labels 1–4. To compare Labels 1–4 and Labels 5–8, authors filtered the images valid for Labels 5–8 to include only images also valid for Labels 1–4, resulting in 7,061 images valid for Labels 5–8. The labelling CSVs included in the dataset do not contain two of the images used in this experiment since these images included other bikers.
The authors performed sensor validation to confirm that the sensor readings either 5 meters or 3 seconds ahead of each image met the following criteria: the vehicle should not be stopped, sensor readings should be continuous, and the calculated UTC timestamp should be within 1 second of the reported UTC timestamp. In sensor validation for Labels 1–4, they included the third criterion and GPS continuity in case other sensor readings were also affected. The authors did not consider these criteria for Labels 5–8 because significantly less sensor data was used to calculate these labels.
| TSM1 | TSM2 | Difference (TSM2-TSM1) | ||||
|---|---|---|---|---|---|---|
| Overall accuracy | Avg class accuracy | Overall accuracy | Avg class accuracy | Overall accuracy | Avg class accuracy | |
| Original groups | 34.75% | 36.48% | 45.48% | 47.72% | 10.73% | 11.24% |
| k = 2 groups | 71.19% | 71.33% | 73.45% | 75.06% | 2.26% | 3.73% |
| k = 3 groups | 55.65% | 46.20% | 60.17% | 52.30% | 4.52% | 6.10% |
| k = 4 groups | 45.76% | 35.72% | 50.00% | 46.27% | 4.24% | 10.55% |
| Average | 5.44% | 7.91% | ||||
Selection set performance of labeling schemas
 Homepage
 Research Paper
 GitHub
Summary #
Off-Road Terrain for Autonomous Vehicles is a dataset for an identification task. It is used in the automotive industry.
The dataset consists of 12730 images with 0 labeled objects. There are no pre-defined train/val/test splits in the dataset. Dataset contains the corresponding sensor data from a global positioning system (GPS, inertial measurement units (IMUs), a wheel rotation speed sensor, z-axis acceleration). In general, all sensor and label data recorded in seven CSV files (accelerometer_calibrated_split.csv, gps.csv, gyroscope_calibrated_split.csv, magnetometer_split.csv and record.csv - for Sensor Data, tsm_1_labels.csv, tsm_2_labels.csv - for Image Labels). All data has been carefully transferred to tag format: tsm1_original, tsm2_k2 … etc. from tsm_1_labels.csv and tsm_2_labels, accel_x (counts), calibrated_accel_x (g)… etc. from accelerometer_calibrated_split.csv etc. Each column in the source data corresponds to a tag, except utc_s(s) and utc_ms(ms) (this data contains in image name). Please note, that not every image has a tag due to differences in the frequency of data collection. The dataset was released in 2021 by the Vanderbilt University.
Explore #
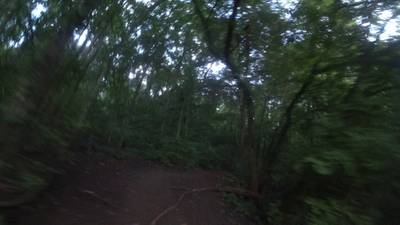
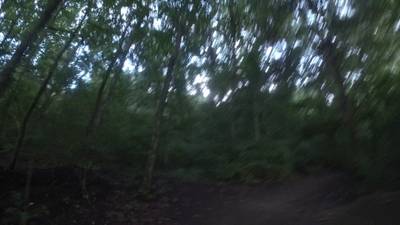
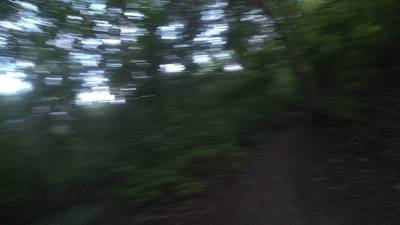
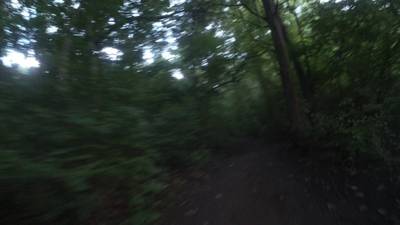
Off-Road Terrain for Autonomous Vehicles dataset has 12730 images. Click on one of the examples below or open "Explore" tool anytime you need to view dataset images with annotations. This tool has extended visualization capabilities like zoom, translation, objects table, custom filters and more. Hover the mouse over the images to hide or show annotations.


License #
License is unknown for the Off-Road Terrain for Autonomous Vehicles dataset.
Citation #
If you make use of the Off-Road Terrain for Autonomous Vehicles data, please cite the following reference:
Gresenz, G., White, J., & Schmidt, D. C. (2021).
"An Off-Road Terrain Dataset Including Images Labeled With Measures of Terrain Roughness"
Proceedings of the IEEE International Conference in Autonomous Systems, 309-313.
If you are happy with Dataset Ninja and use provided visualizations and tools in your work, please cite us:
@misc{ visualization-tools-for-off-road-terrain-for-autonomous-vehicles-dataset,
  title = { Visualization Tools for Off-Road Terrain for Autonomous Vehicles Dataset },
  type = { Computer Vision Tools },
  author = { Dataset Ninja },
  howpublished = { \url{ https://datasetninja.com/off-road-terrain-for-autonomous-vehicles } },
  url = { https://datasetninja.com/off-road-terrain-for-autonomous-vehicles },
  journal = { Dataset Ninja },
  publisher = { Dataset Ninja },
  year = { 2026 },
  month = { jul },
  note = { visited on 2026-07-29 },
}
Download #
Please visit dataset homepage to download the data.
Disclaimer #
Our gal from the legal dep told us we need to post this:
Dataset Ninja provides visualizations and statistics for some datasets that can be found online and can be downloaded by general audience. Dataset Ninja is not a dataset hosting platform and can only be used for informational purposes. The platform does not claim any rights for the original content, including images, videos, annotations and descriptions. Joint publishing is prohibited.
You take full responsibility when you use datasets presented at Dataset Ninja, as well as other information, including visualizations and statistics we provide. You are in charge of compliance with any dataset license and all other permissions. You are required to navigate datasets homepage and make sure that you can use it. In case of any questions, get in touch with us at hello@datasetninja.com.