

Introduction #
The OPPD: Open Plant Phenotyping Database is a publicly available dataset consisting of 7590 RGB images featuring 47 plant species. Each species undergoes cultivation under three distinct growth conditions, ensuring a diverse visual appearance. These images are gathered at Aarhus University, Research Centre Flakkebjerg, Denmark, utilizing a custom data acquisition platform that offers images at a ground resolution of approximately 6.6 pixels per millimeter. Note, that the actual number of plant species is 52
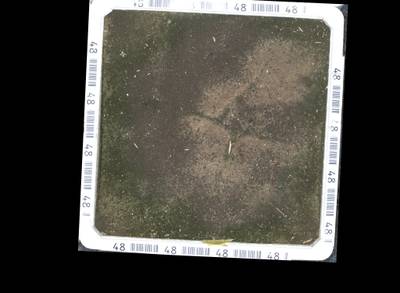
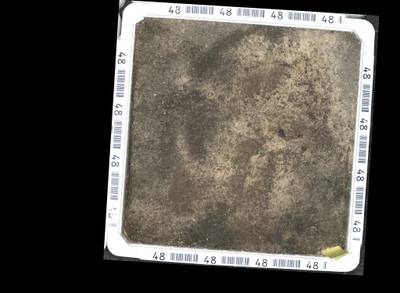
The imaging setup consisted of a 12.3 Megapixel global shutter camera (Flir GS3-U3-123S6C) paired with a 38mm lens at F/4 (Schneider Kreuznach Xenon-Topaz XN 2,0/38-0901). To ensure well-illuminated, high-resolution images, a Xenon ring flash (Paul C. Buff, AlienBee ABR800) was used, with the lens positioned at the center of the ring. The imaging system was mounted at a height of 1.7 meters above the seedbeds, providing a ground field of view measuring 0.62×0.45 meters and resulting in a ground resolution of approximately 6.6 pixels per millimeter.
Recording was conducted by moving the imaging system over each of the polystyrene boxes 1–3 times daily, depending on the season of the trial. The tracking of plants in each trial extended from seedling emergence to the 6 to 8 leaf stage, covering a developmental period spanning from 36 to 60 days. These stages are relevant for weed control in field settings. Data collection was carried out across four trial seasons: 2017 spring, 2017 autumn, 2018 summer, and 2019 summer.
Individual plant annotations within each image were carried out using the RoboWeedMaPS online tool (I·GIS A/S in Risskov, Denmark). This tool offered a machine learning-assisted annotation framework for creating bounding boxes and annotating plant species. Initially, the RoboWeedMaPS annotation tool provided region proposals and made preliminary classifications, distinguishing between monocotyledon and dicotyledon plants within a given image. Consequently, the manual annotator’s task primarily involved validating these proposals and rectifying any potential errors.
In order to provide a broad spectrum of plant appearances, the authors cultivated plant species in polystyrene boxes (0.40×0.40×0.15 m) under three different controlled growth conditions, partly inducing stress. The different growth conditions were as follows: G1 involved a potting mixture consisting of sandy loam soil, sand, and peat (2:1:1 w/w) with all necessary micro- and macro-nutrients, and optimum soil moisture; G2 utilized sandy loam soil with optimum fertilizer supply and sub-optimum watering; and G3 used sandy soil with low nutrient content and optimum soil moisture. Initially, the growth boxes were watered to field capacity, and seeds were placed at the soil surface and covered with approximately 1 cm of soil. Subsequently, the boxes were placed on outdoor tables and watered from below three times a day, with occasional light showers applied on top to maintain surface moisture. After seedling emergence, the authors thinned the plants to minimize overlapping plant leaves. For the sandy loam soil (condition G2), drought stress was induced in the plants by stopping watering when the seedlings had 2 true leaves. The authors prevented natural rain using an automated rain cover that was activated only when nearby rain sensors detected rain. All seeds used in the experiments were provided by the seed bank at Research Centre Flakkebjerg, Aarhus University.
The dataset comes complete with annotations using the EPPO encoding system for plant species, bounding box annotations for plant detection and individual extraction, information about the growth conditions, and time elapsed since seeding. Information about the trial id, box id, date and time since seeding are represented as image’s filename. EPPO code and growth condition are applied as tags on each image.
Here is how EPPO codes for plants generally work: codes consist of 5 letters = 3 (genus) + 2 (species). For example, Alopecurus myosuroides -> ALOMY
More information on that here
 Homepage
 Research Paper
 GitLab
Summary #
OPPD: Open Plant Phenotyping Database - Full Images is a dataset for an object detection task. It is used in the biological research. Possible applications of the dataset could be in the agricultural industry.
The dataset consists of 7590 images with 315040 labeled objects belonging to 52 different classes including PPPDD, PPPMM, CHEAL, and other: VERPE, CONAR, 1COMF, VERAR, POLAV, SONOL, MATCH, MATIN, PLAMA, CENCY, SENVU, STEME, VICHI, POLCO, SOLNI, CAPBP, SINAR, CHYSE, BRSNN, MELNO, EROCI, VIOAR, GERMO, LYCAR, THLAR, URTUR, PAPRH, GALAP, RUMCR, BROST, POLLA, LOLMU, MYOAR, ARTVU, POAAN, ALOMY, APESV, ANGAR, EPHPE, AVEFA, LAPCO, PLALA, CIRAR, EPHHE, POLPE, SONAS, FUMOF, 3UNCLK, and 1PLAK.
Images in the OPPD: Full Images dataset have bounding box annotations. There are 489 (6% of the total) unlabeled images (i.e. without annotations). There are no pre-defined train/val/test splits in the dataset. Additionally, every image contains following tags: eppo, latin, english, upload_id, image_id, date, trial_id, box_id, growth_condition. The dataset was released in 2020 by the Aarhus University, Denmark and I-GIS A/S, Denmark.
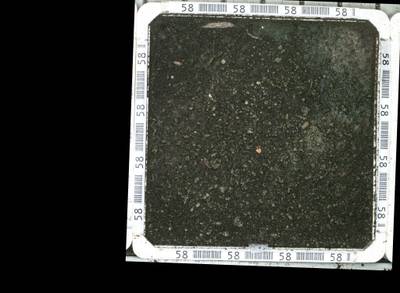
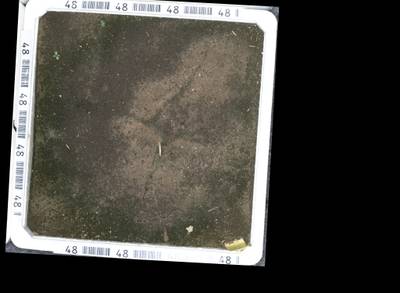
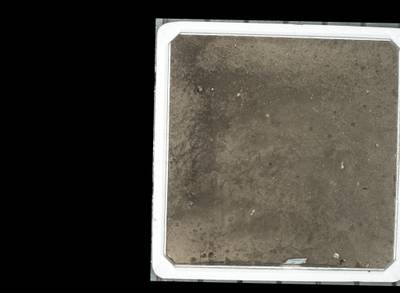
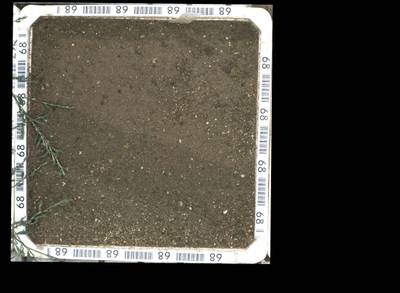
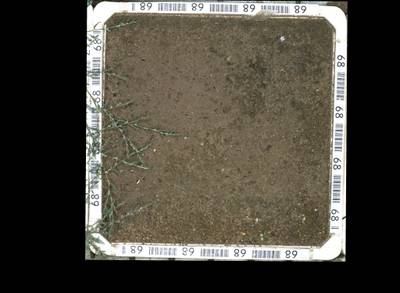
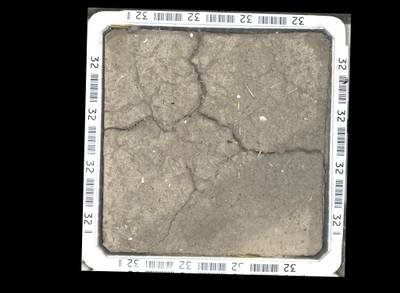
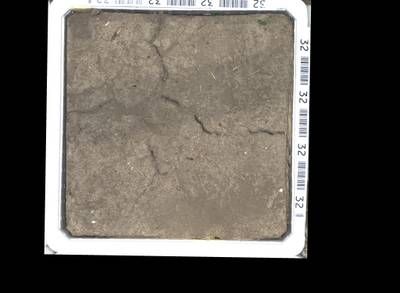
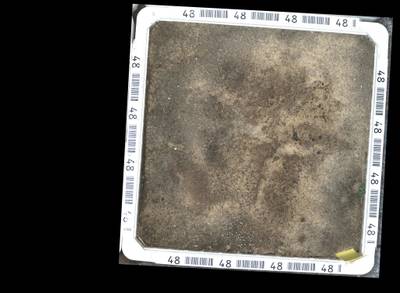
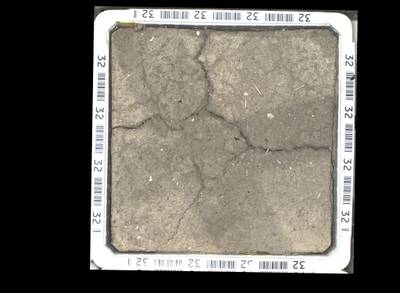
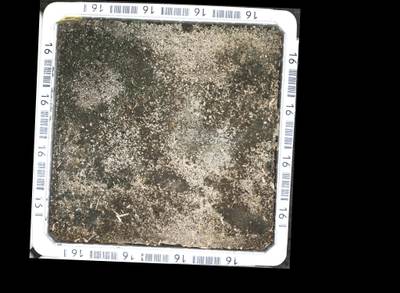
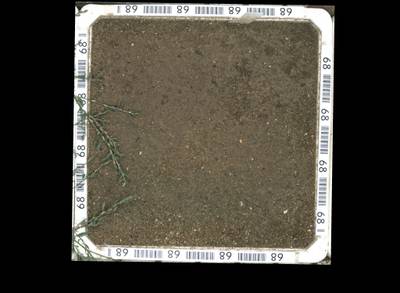
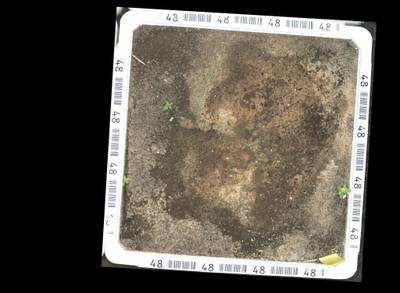
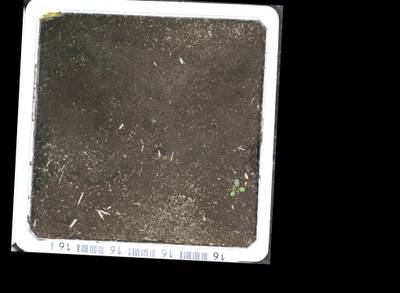
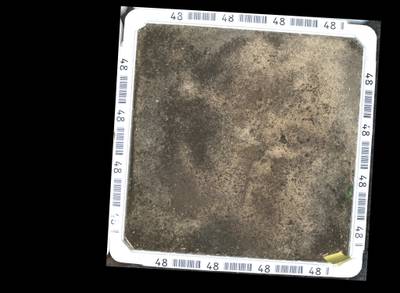
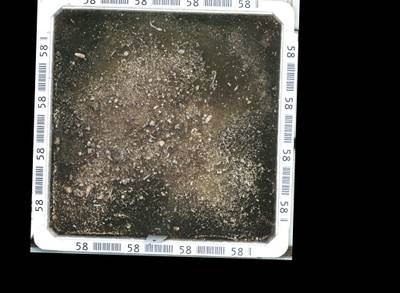
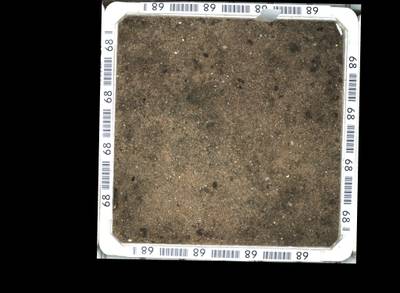
Here is a visualized example for randomly selected sample classes:
Explore #
OPPD: Full Images dataset has 7590 images. Click on one of the examples below or open "Explore" tool anytime you need to view dataset images with annotations. This tool has extended visualization capabilities like zoom, translation, objects table, custom filters and more. Hover the mouse over the images to hide or show annotations.


Class balance #
There are 52 annotation classes in the dataset. Find the general statistics and balances for every class in the table below. Click any row to preview images that have labels of the selected class. Sort by column to find the most rare or prevalent classes.

Class ㅤ | Images ㅤ | Objects ㅤ | Count on image average | Area on image average |
|---|---|---|---|---|
PPPDD➔ rectangle | 4933 | 37991 | 7.7 | 0.61% |
PPPMM➔ rectangle | 3345 | 9365 | 2.8 | 0.24% |
CHEAL➔ rectangle | 292 | 6321 | 21.65 | 7.59% |
VERPE➔ rectangle | 253 | 9191 | 36.33 | 9.25% |
CONAR➔ rectangle | 237 | 1259 | 5.31 | 6.67% |
1COMF➔ rectangle | 213 | 2781 | 13.06 | 2.18% |
VERAR➔ rectangle | 193 | 28791 | 149.18 | 8.57% |
POLAV➔ rectangle | 186 | 2411 | 12.96 | 15.31% |
SONOL➔ rectangle | 160 | 4646 | 29.04 | 15.86% |
MATIN➔ rectangle | 150 | 15065 | 100.43 | 21.86% |
Images #
Explore every single image in the dataset with respect to the number of annotations of each class it has. Click a row to preview selected image. Sort by any column to find anomalies and edge cases. Use horizontal scroll if the table has many columns for a large number of classes in the dataset.
Class sizes #
The table below gives various size properties of objects for every class. Click a row to see the image with annotations of the selected class. Sort columns to find classes with the smallest or largest objects or understand the size differences between classes.
Class | Object count | Avg area | Max area | Min area | Min height | Min height | Max height | Max height | Avg height | Avg height | Min width | Min width | Max width | Max width |
|---|---|---|---|---|---|---|---|---|---|---|---|---|---|---|
PPPDD rectangle | 37991 | 0.09% | 59.13% | 0% | 1px | 0.03% | 2765px | 92.17% | 67px | 2.23% | 1px | 0.02% | 2628px | 64.16% |
VERAR rectangle | 28791 | 0.06% | 1.61% | 0% | 18px | 0.6% | 572px | 19.07% | 66px | 2.2% | 19px | 0.46% | 503px | 12.28% |
PAPRH rectangle | 23302 | 0.07% | 18.55% | 0% | 11px | 0.37% | 1860px | 62% | 66px | 2.19% | 11px | 0.27% | 1791px | 43.73% |
CAPBP rectangle | 16411 | 0.18% | 23.36% | 0% | 19px | 0.63% | 1651px | 55.03% | 93px | 3.1% | 19px | 0.46% | 2006px | 48.97% |
MATIN rectangle | 15065 | 0.25% | 16.54% | 0% | 17px | 0.57% | 1493px | 49.77% | 117px | 3.9% | 17px | 0.42% | 1467px | 35.82% |
ANGAR rectangle | 10691 | 0.08% | 2.24% | 0% | 15px | 0.5% | 503px | 16.77% | 81px | 2.7% | 21px | 0.51% | 548px | 13.38% |
PPPMM rectangle | 9365 | 0.09% | 7.32% | 0% | 10px | 0.33% | 1354px | 45.13% | 80px | 2.67% | 13px | 0.32% | 1711px | 41.77% |
POAAN rectangle | 9329 | 0.28% | 22.65% | 0% | 12px | 0.4% | 1733px | 57.77% | 111px | 3.71% | 15px | 0.37% | 1782px | 43.51% |
VERPE rectangle | 9191 | 0.27% | 17.69% | 0% | 21px | 0.7% | 1725px | 57.5% | 139px | 4.63% | 21px | 0.51% | 1467px | 35.82% |
STEME rectangle | 8613 | 0.37% | 16.46% | 0% | 1px | 0.03% | 1524px | 50.8% | 150px | 4.99% | 1px | 0.02% | 1556px | 37.99% |
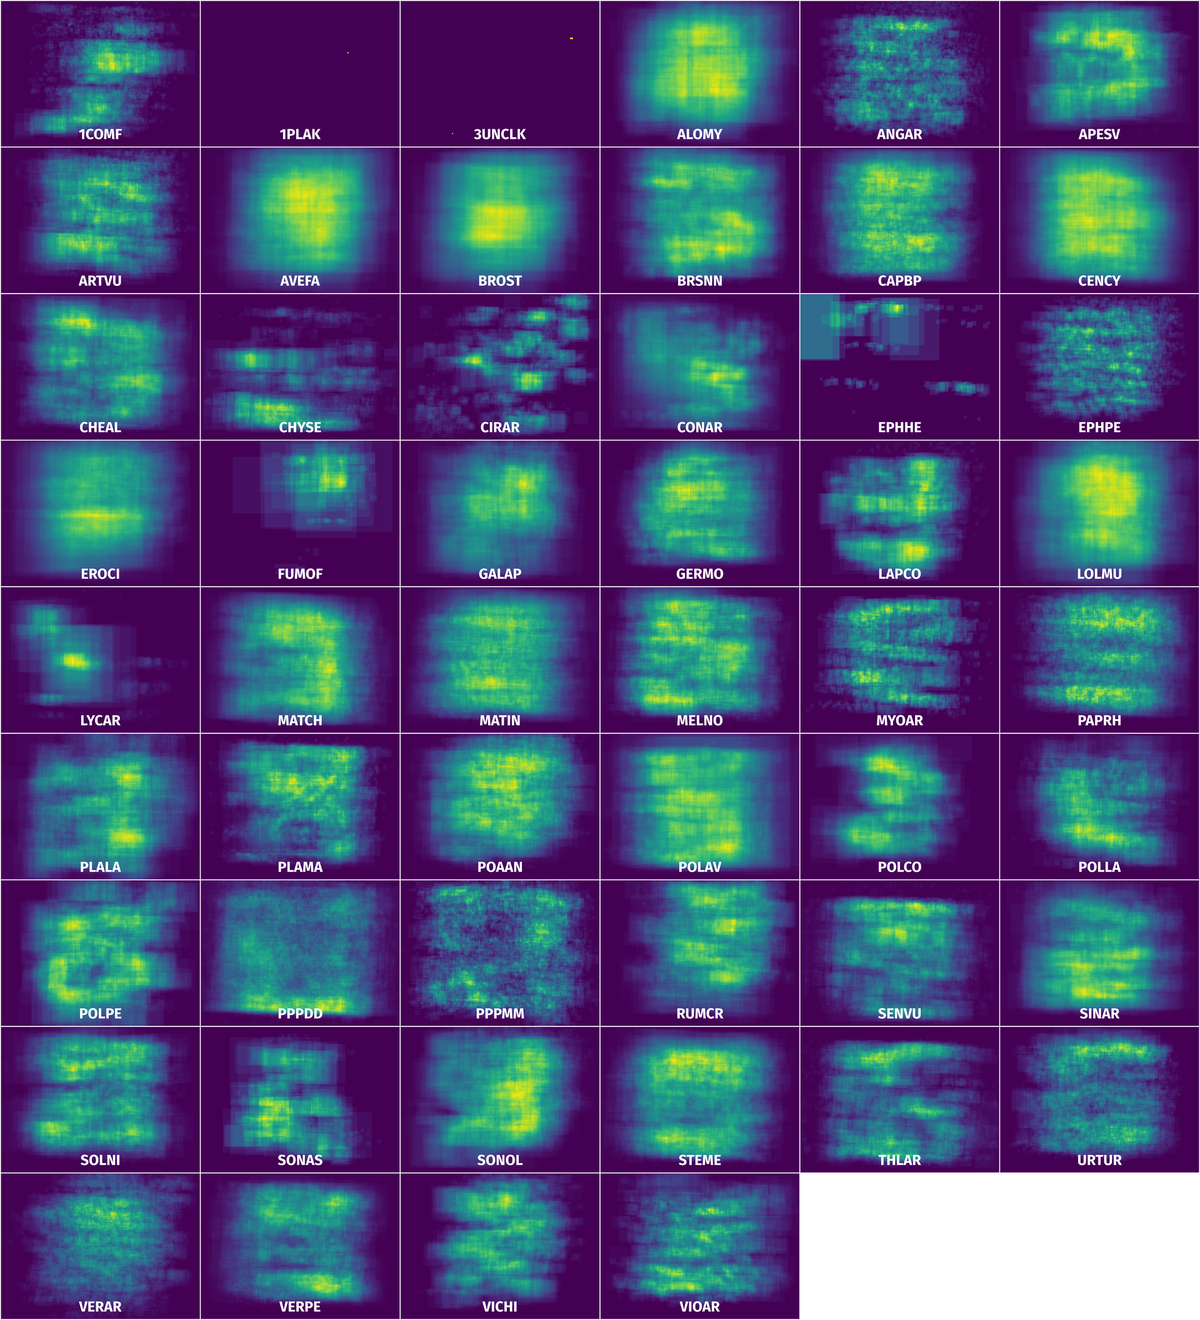
Spatial Heatmap #
The heatmaps below give the spatial distributions of all objects for every class. These visualizations provide insights into the most probable and rare object locations on the image. It helps analyze objects' placements in a dataset.
Objects #
Table contains all 100324 objects. Click a row to preview an image with annotations, and use search or pagination to navigate. Sort columns to find outliers in the dataset.
Object ID ㅤ | Class ㅤ | Image name click row to open | Image size height x width | Height ㅤ | Height ㅤ | Width ㅤ | Width ㅤ | Area ㅤ |
|---|---|---|---|---|---|---|---|---|
1➔ | EROCI rectangle | T02_Box006_2017-09-19T08-50-44-609.jpg | 3000 x 4096 | 233px | 7.77% | 248px | 6.05% | 0.47% |
2➔ | EROCI rectangle | T02_Box006_2017-09-19T08-50-44-609.jpg | 3000 x 4096 | 325px | 10.83% | 243px | 5.93% | 0.64% |
3➔ | EROCI rectangle | T02_Box006_2017-09-19T08-50-44-609.jpg | 3000 x 4096 | 175px | 5.83% | 155px | 3.78% | 0.22% |
4➔ | EROCI rectangle | T02_Box006_2017-09-19T08-50-44-609.jpg | 3000 x 4096 | 303px | 10.1% | 270px | 6.59% | 0.67% |
5➔ | EROCI rectangle | T02_Box006_2017-09-19T08-50-44-609.jpg | 3000 x 4096 | 168px | 5.6% | 189px | 4.61% | 0.26% |
6➔ | EROCI rectangle | T02_Box006_2017-09-19T08-50-44-609.jpg | 3000 x 4096 | 214px | 7.13% | 250px | 6.1% | 0.44% |
7➔ | PPPDD rectangle | T02_Box006_2017-09-19T08-50-44-609.jpg | 3000 x 4096 | 46px | 1.53% | 58px | 1.42% | 0.02% |
8➔ | EROCI rectangle | T02_Box006_2017-09-19T08-50-44-609.jpg | 3000 x 4096 | 153px | 5.1% | 202px | 4.93% | 0.25% |
9➔ | EROCI rectangle | T02_Box006_2017-09-19T08-50-44-609.jpg | 3000 x 4096 | 269px | 8.97% | 201px | 4.91% | 0.44% |
10➔ | PPPDD rectangle | T02_Box006_2017-09-19T08-50-44-609.jpg | 3000 x 4096 | 43px | 1.43% | 48px | 1.17% | 0.02% |
License #
OPPD: Open Plant Phenotyping Database is under CC BY-NC-SA 4.0 license.
Citation #
If you make use of the OPPD data, please cite the following reference:
@article{Madsen2020OPPD,
  author = {Madsen, Simon Leminen and Mathiassen, Solvejg Kopp and Dyrmann, Mads and Laursen, Morten Stigaard and Paz, Laura-Carlota and J{\o}rgensen, Rasmus Nyholm},
  doi = {10.3390/RS12081246},
  journal = {Remote Sensing},
  keywords = {dataset,plant phenotyping,plant seedlings,weed control},
  month = {apr},
  number = {8},
  pages = {1246},
  publisher = {Multidisciplinary Digital Publishing Institute},
  title = {{Open Plant Phenotype Database of Common Weeds in Denmark}},
  url = {https://www.mdpi.com/691100},
  volume = {12},
  year = {2020}
}
If you are happy with Dataset Ninja and use provided visualizations and tools in your work, please cite us:
@misc{ visualization-tools-for-open-plant-phenotyping-database-dataset,
  title = { Visualization Tools for OPPD: Full Images Dataset },
  type = { Computer Vision Tools },
  author = { Dataset Ninja },
  howpublished = { \url{ https://datasetninja.com/open-plant-phenotyping-database } },
  url = { https://datasetninja.com/open-plant-phenotyping-database },
  journal = { Dataset Ninja },
  publisher = { Dataset Ninja },
  year = { 2026 },
  month = { jul },
  note = { visited on 2026-07-22 },
}
Download #
Dataset OPPD: Full Images can be downloaded in Supervisely format:
As an alternative, it can be downloaded with dataset-tools package:
pip install --upgrade dataset-tools
… using following python code:
import dataset_tools as dtools

dtools.download(dataset='OPPD: Full Images', dst_dir='~/dataset-ninja/')
Make sure not to overlook the python code example available on the Supervisely Developer Portal. It will give you a clear idea of how to effortlessly work with the downloaded dataset.
The data in original format can be downloaded here.
Disclaimer #
Our gal from the legal dep told us we need to post this:
Dataset Ninja provides visualizations and statistics for some datasets that can be found online and can be downloaded by general audience. Dataset Ninja is not a dataset hosting platform and can only be used for informational purposes. The platform does not claim any rights for the original content, including images, videos, annotations and descriptions. Joint publishing is prohibited.
You take full responsibility when you use datasets presented at Dataset Ninja, as well as other information, including visualizations and statistics we provide. You are in charge of compliance with any dataset license and all other permissions. You are required to navigate datasets homepage and make sure that you can use it. In case of any questions, get in touch with us at hello@datasetninja.com.