

Introduction #
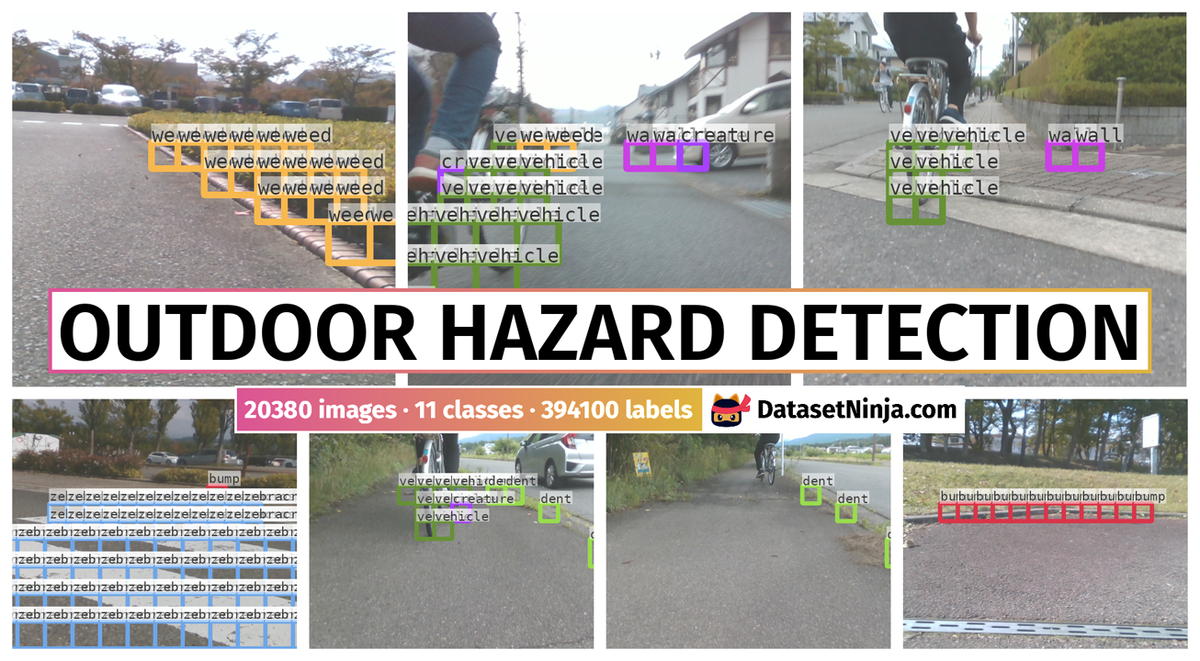
Authors introduce the Outdoor Hazard Detection dataset, a valuable resource for the advancement of outdoor risk detection systems tailored for low-cost electric scooters. This dataset leverages the “You Only Look at Interested Cells” (YOLIC) framework to facilitate efficient real-time hazard detection during scooter navigation. With a total of 20,380 images, the dataset is divided into test (4,076 images), train (14,266 images), and val (2,038 images) sets, encompassing 11 distinct hazard classes, including but not limited to bumps, weeds, columns, and fences. It serves as a crucial tool for the development and evaluation of safety measures in the context of electric scooter travel.
About YOLIC
YOLIC employs Cell of Interest (CoI) as the unit of classification based on cell-wise segmentation rather than classifying each pixel as in semantic segmentation. These CoIs, larger than individual pixels, encapsulate more relevant information, thereby enhancing detection efficiency and reducing computational overhead. On the other hand, instead of merely enclosing objects within bounding boxes, YOLIC infers a rough shape of the objects by utilizing multiple CoIs, offering a more nuanced perspective of object presence in the scene. This is accomplished by defining a number of cells and concentrating solely on those identified as CoIs in an image. Thus computational load could be significantly reduced. YOLIC is particularly effective in scenarios where both the shape and location of an object are crucial. Leveraging a prior knowledge of the expected object’s position, size, and shape, YOLIC allows for predefined positioning and count of cells. This approach simplifies the computational process for object detection, eliminating the need for region proposal networks or bounding box regression techniques. Furthermore, YOLIC adopts multi-label classification for each cell, enhancing the detection of multiple objects within a single cell. This approach effectively recognizes overlapping or closely situated objects within the same cell, thereby overcoming the limitations associated with single-label classification. YOLIC’s integration of cell-wise segmentation and multi-label classification achieves accuracy levels comparable to state-of-theart object detection algorithms while significantly reducing computational resource demands. This balance between precision and computational efficiency positions YOLIC as an ideal solution for object detection on edge devices.

YOLIC’s adaptability is showcased in diverse applications such as intelligent driving, industrial manufacturing, and smart parking, where it proficiently identifies various cells of interest. Unlike conventional object detection algorithms which involve laborious searching for objects in the entire image, the proposed method passively waits for the object to appear in the predefined cells of interest. This flexibility enables customized cell configurations for unique scenarios, allowing precise object detection and analysis across different tasks.
“You Only Look at Interested Cells” (YOLIC) is specifically designed for edge devices and low-performance hardware. Rather than merely classifying predefined pixels of a compressed image, YOLIC utilizes a more complex process, identifying object categories by classifying CoIs of various shapes and sizes, based on the application’s requirements. This approach effectively converts each input image into a ‘mosaic art image,’ composed of numerous diverse CoIs. The cell configuration, defining the size, shape, position, and quantity of CoIs, is what lends YOLIC its precision and versatility in object localization, differing from traditional algorithms that rely primarily on object coordinates. These cells, tailored according to factors such as distance, direction, and the degree of danger posed by frequently appearing objects, provide sufficient and critical information for tasks like safe driving. For instance, in intelligent driving applications, CoIs can be set according to driving distance for accurate detection of the distance between objects and the vehicle. In industrial manufacturing scenarios, CoIs can be configured based on equipment panels for monitoring the operational status of traditional industrial machinery. Additionally, in smart parking lot applications, CoIs can be tailored to individual parking spaces to precisely locate vehicles. Furthermore, YOLIC’s adaptability extends to various other applications such as retail analytics, where CoIs can be set to monitor product shelf areas for inventory management and customer behavior analysis. In healthcare, CoIs can be adjusted to track and analyze specific body parts or regions in medical imaging for early diagnosis and treatment planning. Overall, YOLIC’s flexibility in adjusting CoIs across a multitude of tasks showcases its potential for widespread adoption in diverse industries and use cases.

A detailed diagram of the YOLIC model, showcasing its two main components: the feature extraction module and the multi-label classification head. The figure also demonstrates the output of the model, highlighting the position of each CoI on an input image. The overall structure emphasizes YOLIC’s lightweight and efficient design, which makes it well-suited for edge devices with limited computational resources.
In this experiment, authors focus on the development of an outdoor risk detection system specifically tailored for low-cost electric scooters. The motivation behind using YOLIC for this application lies in its ability to provide efficient real-time detection, which is crucial for ensuring safety during scooter navigation. Furthermore, low-cost electric scooters typically have limited computational resources, making YOLIC’s lightweight architecture an ideal choice for deployment on such devices. To accommodate the typical speed of electric scooters and ensure safety, authors designed a detection range of 0-6 meters on the road. Authors divided this range into different CoIs based on distance, allowing for precise object localization and prioritization of areas posing higher risks. In total, 96 CoIs are allocated to the road detection area. Additionally, authors designated a traffic sign detection area at the top of the image, employing eight CoIs to approximate the location of traffic signs. For this application, it is essential to accurately identify various objects that could potentially pose risks to scooter navigation. Accordingly, authors defined 11 objects of interest: Bump, Column, Dent, Fence, People, Vehicle, Wall, Weed, Zebra Crossing, Traffic Cone, and Traffic Sign. These objects were selected due to their relevance and potential impact on scooter movement and safety. Therefore, considering the 11 objects and one additional category for background class, YOLIC’s output for this experiment becomes 104 × (11 + 1) = 1248. In authors’ evaluation, authors hand-picked and annotated 20,380 distinct video frames from road footage around the University of Aizu campus. These frames were carefully chosen to provide unique data points. For the experiment, authors randomly divided this dataset into 70% for training, 10% for validation, and the remaining 20% for testing. This dataset showcasing varied outdoor conditions, facilitates a comprehensive assessment of the effectiveness of authors’ proposed YOLIC-based risk detection system for electric scooters. Authors evaluate authors’ model using common metrics such as precision, recall, and the F1-score for each object category. Authors also appraise the binary classification of each CoI based on the results of the background class.
 Homepage
 Research Paper
Summary #
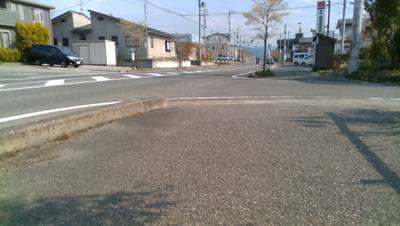
Outdoor Hazard Detection is a dataset for a cell wise segmentation task. It is used in the internet of things (IoT) domain.
The dataset consists of 20380 images with 394100 labeled objects belonging to 11 different classes including bump, weed, vehicle, and other: column, creature, wall, dent, zebracrossing, fence, trafficsign, and trafficcone.
Images in the Outdoor Hazard Detection dataset have bounding box annotations. There are 4102 (20% of the total) unlabeled images (i.e. without annotations). There are 3 splits in the dataset: train (14266 images), test (4076 images), and val (2038 images). The dataset was released in 2023 by the University of Aizu, Japan.
Explore #
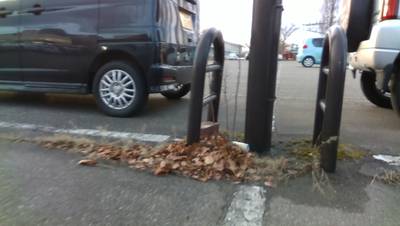
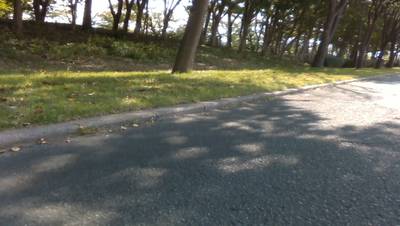
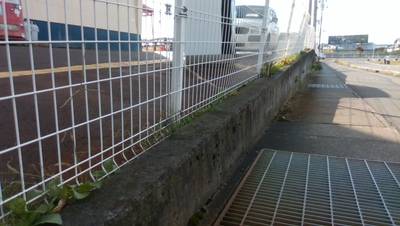
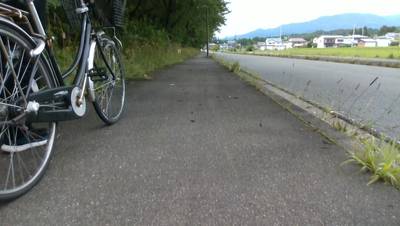
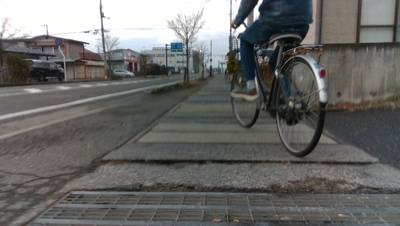
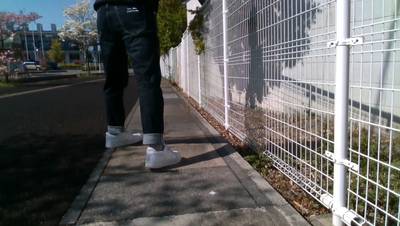
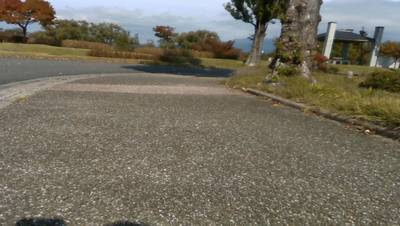
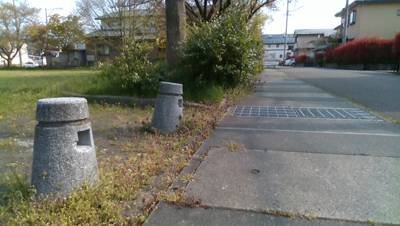
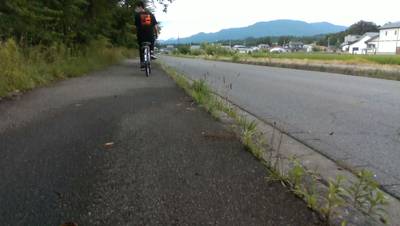
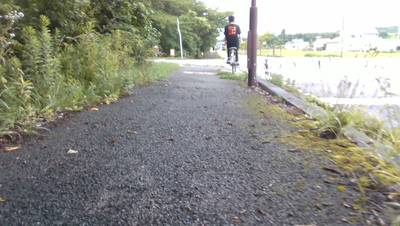
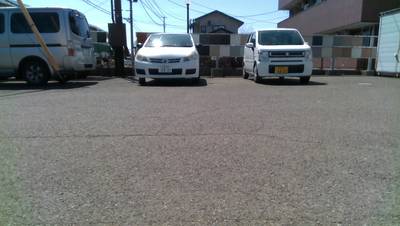
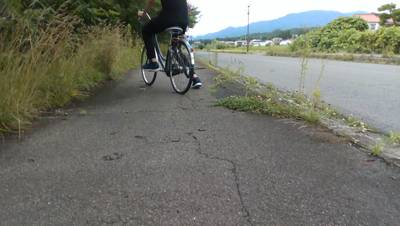
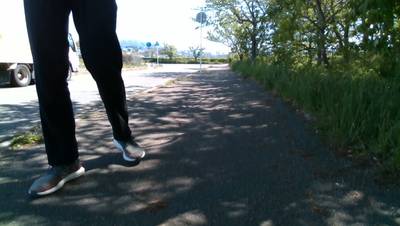
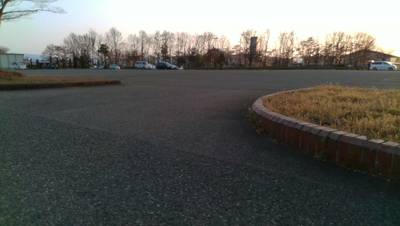
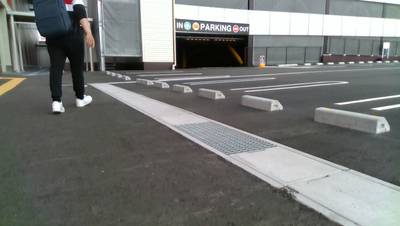
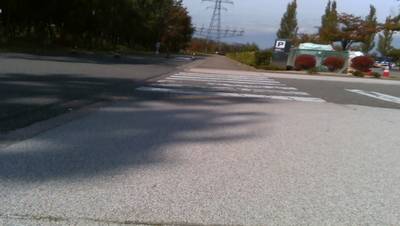
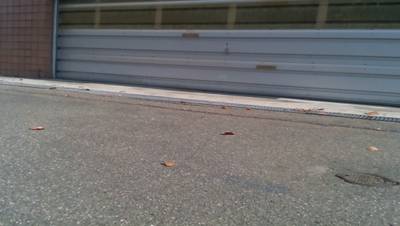
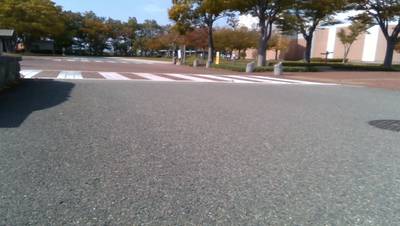
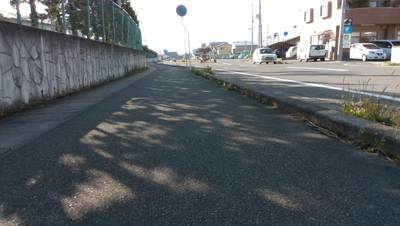
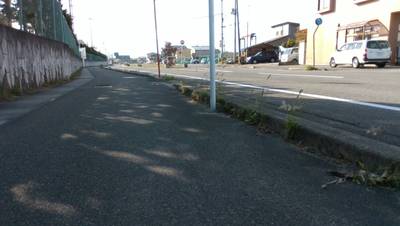
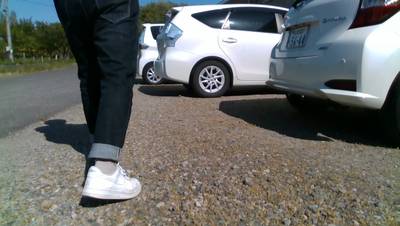
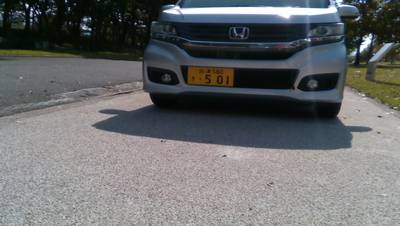
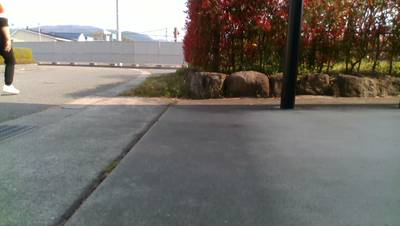
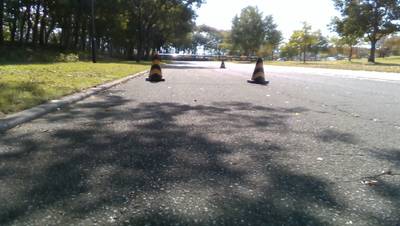
Outdoor Hazard Detection dataset has 20380 images. Click on one of the examples below or open "Explore" tool anytime you need to view dataset images with annotations. This tool has extended visualization capabilities like zoom, translation, objects table, custom filters and more. Hover the mouse over the images to hide or show annotations.


Class balance #
There are 11 annotation classes in the dataset. Find the general statistics and balances for every class in the table below. Click any row to preview images that have labels of the selected class. Sort by column to find the most rare or prevalent classes.

Class ㅤ | Images ㅤ | Objects ㅤ | Count on image average | Area on image average |
|---|---|---|---|---|
bump➔ rectangle | 6346 | 84092 | 13.25 | 6.37% |
weed➔ rectangle | 5826 | 91632 | 15.73 | 7.33% |
vehicle➔ rectangle | 4557 | 33194 | 7.28 | 2.75% |
column➔ rectangle | 3851 | 17862 | 4.64 | 1.87% |
creature➔ rectangle | 3771 | 23055 | 6.11 | 2.72% |
wall➔ rectangle | 3107 | 43582 | 14.03 | 6.47% |
dent➔ rectangle | 2885 | 23538 | 8.16 | 4.27% |
zebracrossing➔ rectangle | 1598 | 59406 | 37.18 | 20.46% |
fence➔ rectangle | 808 | 12221 | 15.12 | 6.83% |
trafficsign➔ rectangle | 774 | 996 | 1.29 | 1.17% |
Co-occurrence matrix #
Co-occurrence matrix is an extremely valuable tool that shows you the images for every pair of classes: how many images have objects of both classes at the same time. If you click any cell, you will see those images. We added the tooltip with an explanation for every cell for your convenience, just hover the mouse over a cell to preview the description.
Images #
Explore every single image in the dataset with respect to the number of annotations of each class it has. Click a row to preview selected image. Sort by any column to find anomalies and edge cases. Use horizontal scroll if the table has many columns for a large number of classes in the dataset.
Object distribution #
Interactive heatmap chart for every class with object distribution shows how many images are in the dataset with a certain number of objects of a specific class. Users can click cell and see the list of all corresponding images.
Class sizes #
The table below gives various size properties of objects for every class. Click a row to see the image with annotations of the selected class. Sort columns to find classes with the smallest or largest objects or understand the size differences between classes.
Class | Object count | Avg area | Max area | Min area | Min height | Min height | Max height | Max height | Avg height | Avg height | Min width | Min width | Max width | Max width |
|---|---|---|---|---|---|---|---|---|---|---|---|---|---|---|
weed rectangle | 91632 | 0.48% | 0.72% | 0.3% | 35px | 7.29% | 54px | 11.25% | 43px | 9% | 35px | 4.13% | 54px | 6.37% |
bump rectangle | 84092 | 0.49% | 0.91% | 0.3% | 35px | 7.29% | 61px | 12.71% | 44px | 9.12% | 35px | 4.13% | 61px | 7.19% |
zebracrossing rectangle | 59406 | 0.57% | 0.72% | 0.3% | 35px | 7.29% | 54px | 11.25% | 47px | 9.84% | 35px | 4.13% | 54px | 6.37% |
wall rectangle | 43582 | 0.48% | 0.91% | 0.3% | 35px | 7.29% | 61px | 12.71% | 43px | 8.95% | 35px | 4.13% | 61px | 7.19% |
vehicle rectangle | 33194 | 0.39% | 0.72% | 0.3% | 35px | 7.29% | 54px | 11.25% | 39px | 8.12% | 35px | 4.13% | 54px | 6.37% |
dent rectangle | 23538 | 0.53% | 0.72% | 0.3% | 35px | 7.29% | 54px | 11.25% | 46px | 9.5% | 35px | 4.13% | 54px | 6.37% |
creature rectangle | 23055 | 0.46% | 0.72% | 0.3% | 35px | 7.29% | 54px | 11.25% | 42px | 8.78% | 35px | 4.13% | 54px | 6.37% |
column rectangle | 17862 | 0.41% | 0.72% | 0.3% | 35px | 7.29% | 54px | 11.25% | 40px | 8.35% | 35px | 4.13% | 54px | 6.37% |
fence rectangle | 12221 | 0.47% | 0.72% | 0.3% | 35px | 7.29% | 54px | 11.25% | 43px | 8.86% | 35px | 4.13% | 54px | 6.37% |
trafficcone rectangle | 4522 | 0.45% | 0.72% | 0.3% | 35px | 7.29% | 54px | 11.25% | 42px | 8.73% | 35px | 4.13% | 54px | 6.37% |
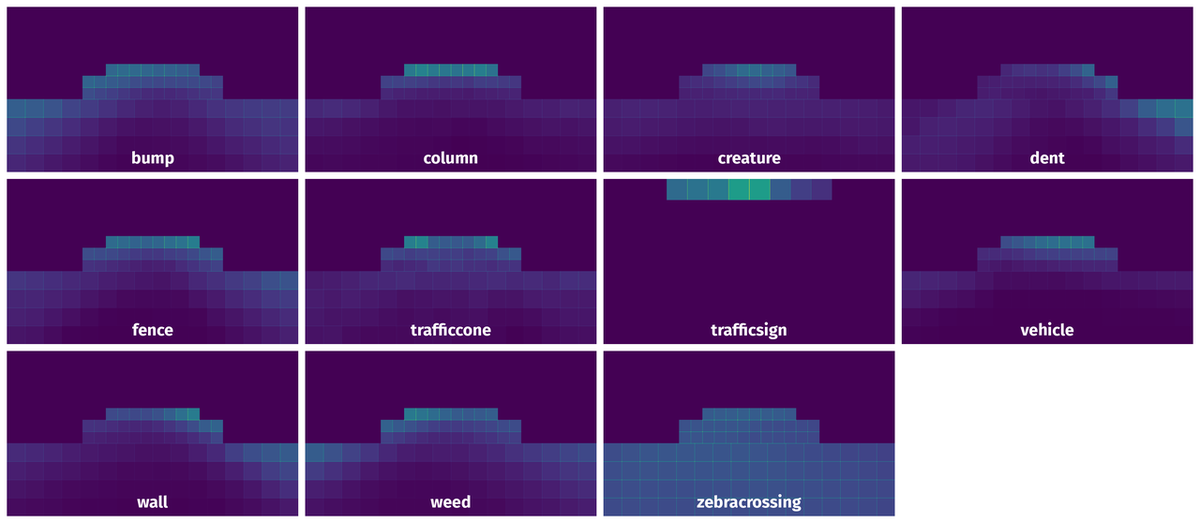
Spatial Heatmap #
The heatmaps below give the spatial distributions of all objects for every class. These visualizations provide insights into the most probable and rare object locations on the image. It helps analyze objects' placements in a dataset.
Objects #
Table contains all 100930 objects. Click a row to preview an image with annotations, and use search or pagination to navigate. Sort columns to find outliers in the dataset.
Object ID ㅤ | Class ㅤ | Image name click row to open | Image size height x width | Height ㅤ | Height ㅤ | Width ㅤ | Width ㅤ | Area ㅤ |
|---|---|---|---|---|---|---|---|---|
1➔ | dent rectangle | 200508_13460200004530.png | 480 x 848 | 54px | 11.25% | 54px | 6.37% | 0.72% |
2➔ | dent rectangle | 200508_13460200004530.png | 480 x 848 | 54px | 11.25% | 54px | 6.37% | 0.72% |
3➔ | dent rectangle | 200508_13460200004530.png | 480 x 848 | 54px | 11.25% | 54px | 6.37% | 0.72% |
4➔ | dent rectangle | 200508_13460200004530.png | 480 x 848 | 54px | 11.25% | 54px | 6.37% | 0.72% |
5➔ | dent rectangle | 200508_13460200004530.png | 480 x 848 | 54px | 11.25% | 54px | 6.37% | 0.72% |
6➔ | dent rectangle | 200508_13460200004530.png | 480 x 848 | 53px | 11.04% | 54px | 6.37% | 0.7% |
7➔ | dent rectangle | 200508_13460200004530.png | 480 x 848 | 53px | 11.04% | 54px | 6.37% | 0.7% |
8➔ | bump rectangle | 200425_17391000000360.png | 480 x 848 | 35px | 7.29% | 35px | 4.13% | 0.3% |
9➔ | bump rectangle | 200425_17391000000360.png | 480 x 848 | 35px | 7.29% | 35px | 4.13% | 0.3% |
10➔ | bump rectangle | 200425_17391000000360.png | 480 x 848 | 35px | 7.29% | 35px | 4.13% | 0.3% |
License #
Citation #
If you make use of the Outdoor Hazard Detection data, please cite the following reference:
@misc{su2023yolic,
  title={YOLIC: An Efficient Method for Object Localization and Classification on Edge Devices},
  author={Kai Su and Yoichi Tomioka and Qiangfu Zhao and Yong Liu},
  year={2023},
  eprint={2307.06689},
  archivePrefix={arXiv},
  primaryClass={cs.CV}
}
If you are happy with Dataset Ninja and use provided visualizations and tools in your work, please cite us:
@misc{ visualization-tools-for-outdoor-hazard-detection-dataset,
  title = { Visualization Tools for Outdoor Hazard Detection Dataset },
  type = { Computer Vision Tools },
  author = { Dataset Ninja },
  howpublished = { \url{ https://datasetninja.com/outdoor-hazard-detection } },
  url = { https://datasetninja.com/outdoor-hazard-detection },
  journal = { Dataset Ninja },
  publisher = { Dataset Ninja },
  year = { 2026 },
  month = { jul },
  note = { visited on 2026-07-23 },
}
Download #
Dataset Outdoor Hazard Detection can be downloaded in Supervisely format:
As an alternative, it can be downloaded with dataset-tools package:
pip install --upgrade dataset-tools
… using following python code:
import dataset_tools as dtools

dtools.download(dataset='Outdoor Hazard Detection', dst_dir='~/dataset-ninja/')
Make sure not to overlook the python code example available on the Supervisely Developer Portal. It will give you a clear idea of how to effortlessly work with the downloaded dataset.
The data in original format can be downloaded here.
Disclaimer #
Our gal from the legal dep told us we need to post this:
Dataset Ninja provides visualizations and statistics for some datasets that can be found online and can be downloaded by general audience. Dataset Ninja is not a dataset hosting platform and can only be used for informational purposes. The platform does not claim any rights for the original content, including images, videos, annotations and descriptions. Joint publishing is prohibited.
You take full responsibility when you use datasets presented at Dataset Ninja, as well as other information, including visualizations and statistics we provide. You are in charge of compliance with any dataset license and all other permissions. You are required to navigate datasets homepage and make sure that you can use it. In case of any questions, get in touch with us at hello@datasetninja.com.