Introduction #
The authors of the Paddy Rice Imagery Dataset for Panicle Segmentation recognize the critical role of precise panicle identification. They acknowledge the potential of deep learning methods, rooted in high-spatial-resolution images, for achieving both high throughput and accuracy in panicle segmentation. However, they highlight the considerable challenges posed by the need for costly annotations to train robust deep-learning models. Furthermore, the scarcity of public datasets specifically tailored for rice-panicle phenotyping presents a substantial hurdle. In response, the authors propose a semi-supervised approach to deep learning model training, designed to facilitate dataset annotation and refinement. Their approach involves training the model on limited annotations while enabling it to autonomously localize more positive samples within the dataset, thus reducing the need for extensive manual intervention. Remarkably, this dataset refinement process results in a 40.6% increase in the number of annotations.
The authors emphasize the broader context of their work within the realms of global population growth and climate change. They stress the significance of accurate panicle segmentation in understanding grain yield, growth periods, nutrition assessment, and disease detection in rice crops. They underscore the limitations of traditional panicle observation, which relies heavily on manual labor, tends to be labor-intensive, and yields results subject to sampling limitations. Consequently, the authors advocate for automated and precise panicle detection methods, aligning with the goals of smart agriculture, where efficiency, accuracy, reliability, and cost-effectiveness are paramount.
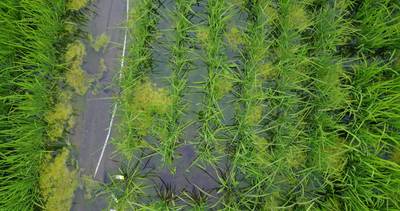
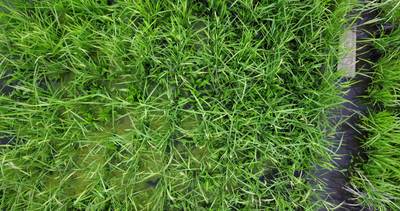
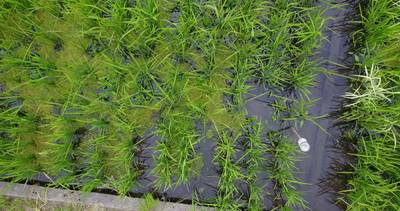
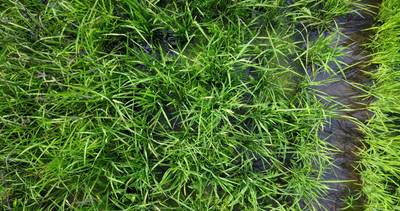
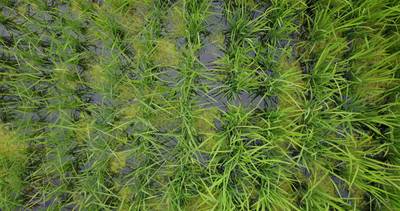
The data collection was conducted in August 2018, at the experimental paddy field of Hokkaido University, Sapporo, Japan. The white dashed line indicates the flight route. There are two rice species, Kitaake and Kokusyokuto-2. The cultivation densities are around 11.46 ~ 16.18 plants/m2. The authors used a commercial UAV to capture the rice field images.
| FOV | Aperture | Gimbal | Resolution | Velocity (m/s) | Altitude (m) | GSD (cm/px) |
|---|---|---|---|---|---|---|
| 78.8 (26 mm) | f/2.2 | −90 | 4096 × 2160 | 0.28 | 1.2 | 0.04 |
Configurations of UAV and the camera.
Furthermore, the authors share their strategy for creating a basic dataset, where they manually annotate panicle boundaries using the Labelme tool. They analyze the annotations’ characteristics across different stages of rice growth (heading stage, flowering stage and ripening stage) and emphasize the importance of images captured on August 12 as being particularly informative for panicle identification. Their basic dataset comprises 400 images with a total of 36,089 annotations*.
The authors elucidate the dataset refinement process, which involves training an instance segmentation model (Mask R-CNN) using manual annotations and then applying this model to refine the entire dataset. They describe the process of scanning the full-resolution images using a sliding window approach and generating a confidence map based on model predictions. After applying threshold and morphology filtering methods, they obtain the refined dataset, which includes both manually labeled annotations and new annotations generated by the model.
Finally, the authors highlight the importance of splitting the refined dataset into training, validation, and testing subsets for machine learning research. They emphasize the need to balance the size of receptive fields for annotation completeness and GPU memory constraints. The authors provide insights into the characteristics of these subsets and underscore the challenges related to receptive field size in capturing complete panicle annotations.
*It differs from the actual number of instances
Summary #
Paddy Rice Imagery Dataset for Panicle Segmentation is a dataset for instance segmentation, semantic segmentation, object detection, and semi supervised learning tasks. It is used in the agricultural industry.
The dataset consists of 400 images with 50730 labeled objects belonging to 1 single class (panicle).
Images in the Paddy Rice Imagery dataset have pixel-level instance segmentation annotations. Due to the nature of the instance segmentation task, it can be automatically transformed into a semantic segmentation (only one mask for every class) or object detection (bounding boxes for every object) tasks. All images are labeled (i.e. with annotations). There are 3 splits in the dataset: train (243 images), test (100 images), and val (57 images). The dataset was released in 2021 by the Beijing Academy of Agriculture and Forestry Sciences, China and Hokkaido University, Japan.

Explore #
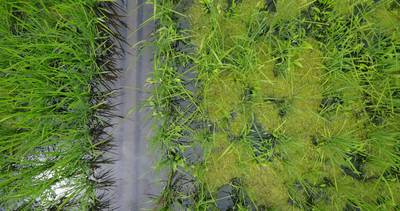
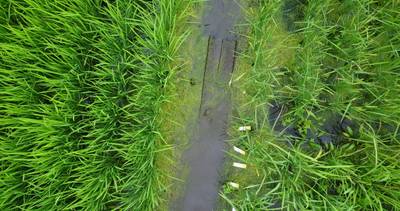
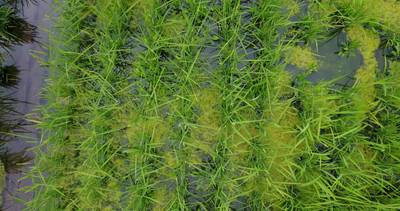
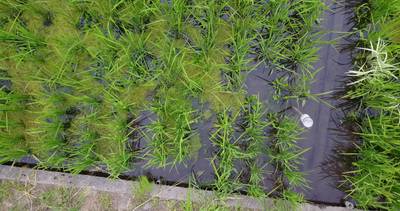
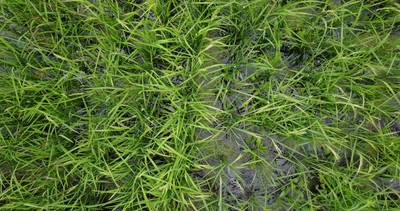
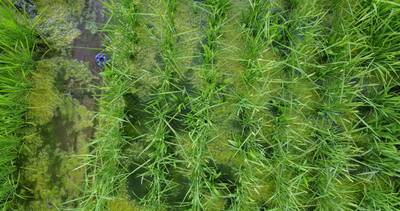
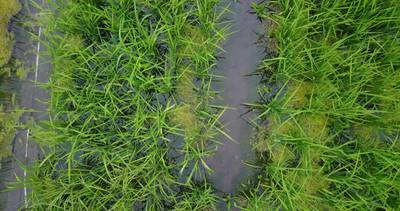
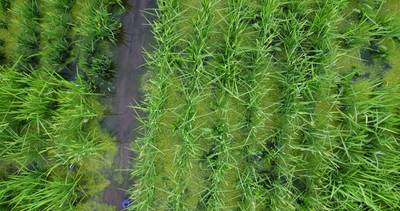
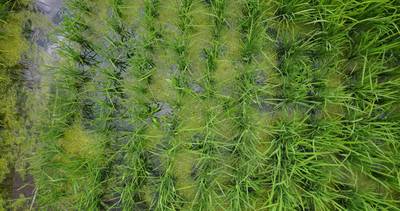
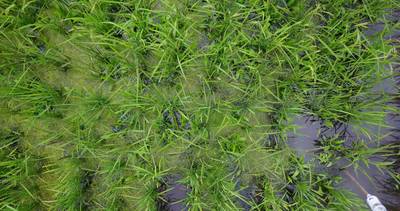
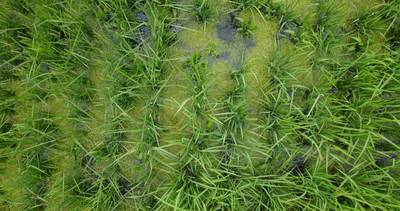
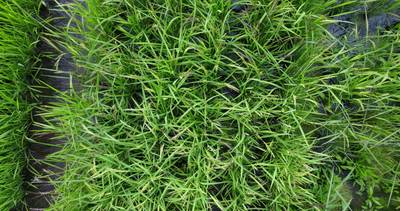
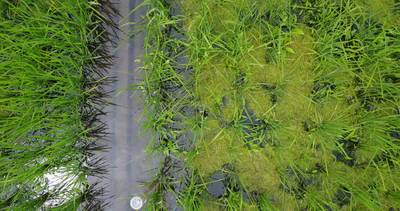
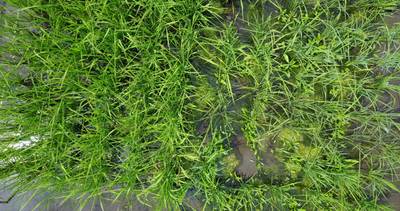
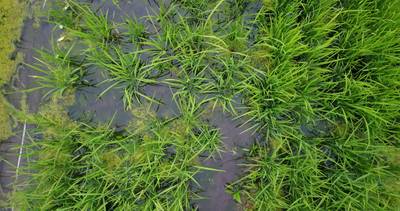
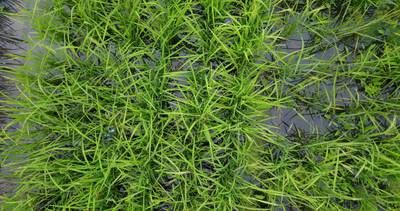
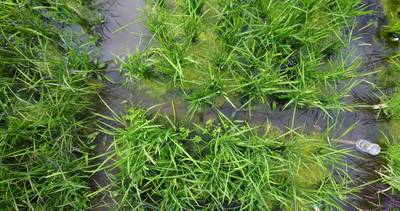
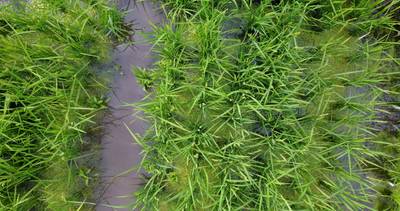
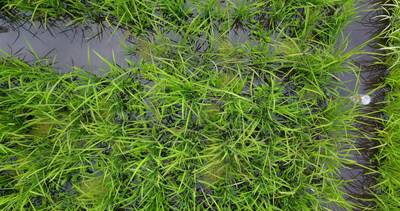
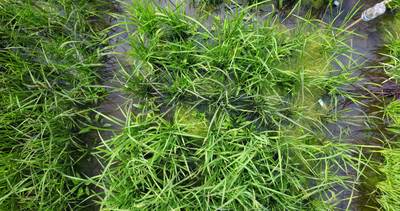
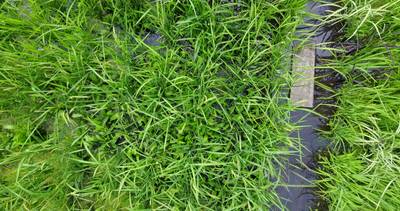
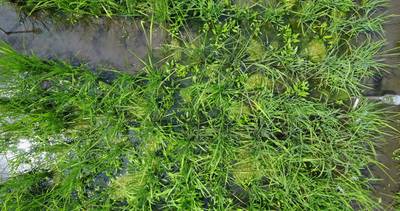
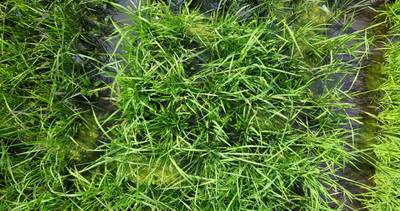
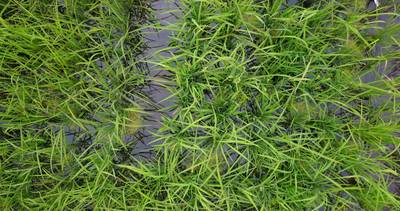
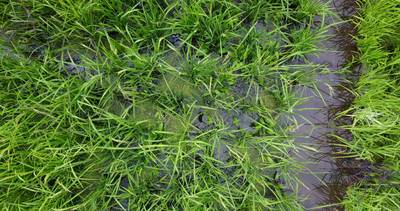
Paddy Rice Imagery dataset has 400 images. Click on one of the examples below or open "Explore" tool anytime you need to view dataset images with annotations. This tool has extended visualization capabilities like zoom, translation, objects table, custom filters and more. Hover the mouse over the images to hide or show annotations.






























Class balance #
There are 1 annotation classes in the dataset. Find the general statistics and balances for every class in the table below. Click any row to preview images that have labels of the selected class. Sort by column to find the most rare or prevalent classes.
Class ㅤ | Images ㅤ | Objects ㅤ | Count on image average | Area on image average |
|---|---|---|---|---|
panicle➔ polygon | 400 | 50730 | 126.83 | 1.53% |
Images #
Explore every single image in the dataset with respect to the number of annotations of each class it has. Click a row to preview selected image. Sort by any column to find anomalies and edge cases. Use horizontal scroll if the table has many columns for a large number of classes in the dataset.
Class sizes #
The table below gives various size properties of objects for every class. Click a row to see the image with annotations of the selected class. Sort columns to find classes with the smallest or largest objects or understand the size differences between classes.
Class | Object count | Avg area | Max area | Min area | Min height | Min height | Max height | Max height | Avg height | Avg height | Min width | Min width | Max width | Max width |
|---|---|---|---|---|---|---|---|---|---|---|---|---|---|---|
panicle polygon | 50730 | 0.01% | 0.3% | 0% | 3px | 0.14% | 376px | 17.41% | 45px | 2.07% | 3px | 0.07% | 402px | 9.81% |
Spatial Heatmap #
The heatmaps below give the spatial distributions of all objects for every class. These visualizations provide insights into the most probable and rare object locations on the image. It helps analyze objects' placements in a dataset.

Objects #
Table contains all 50730 objects. Click a row to preview an image with annotations, and use search or pagination to navigate. Sort columns to find outliers in the dataset.
Object ID ㅤ | Class ㅤ | Image name click row to open | Image size height x width | Height ㅤ | Height ㅤ | Width ㅤ | Width ㅤ | Area ㅤ |
|---|---|---|---|---|---|---|---|---|
1➔ | panicle polygon | 0808_0004_Frame_23.png | 2160 x 4096 | 36px | 1.67% | 28px | 0.68% | 0.01% |
2➔ | panicle polygon | 0808_0004_Frame_23.png | 2160 x 4096 | 21px | 0.97% | 52px | 1.27% | 0% |
3➔ | panicle polygon | 0808_0004_Frame_23.png | 2160 x 4096 | 69px | 3.19% | 70px | 1.71% | 0.02% |
4➔ | panicle polygon | 0808_0004_Frame_23.png | 2160 x 4096 | 32px | 1.48% | 81px | 1.98% | 0.01% |
5➔ | panicle polygon | 0808_0004_Frame_23.png | 2160 x 4096 | 28px | 1.3% | 35px | 0.85% | 0% |
6➔ | panicle polygon | 0808_0004_Frame_23.png | 2160 x 4096 | 29px | 1.34% | 48px | 1.17% | 0.01% |
7➔ | panicle polygon | 0808_0004_Frame_23.png | 2160 x 4096 | 20px | 0.93% | 37px | 0.9% | 0% |
8➔ | panicle polygon | 0808_0004_Frame_23.png | 2160 x 4096 | 30px | 1.39% | 22px | 0.54% | 0% |
9➔ | panicle polygon | 0808_0004_Frame_23.png | 2160 x 4096 | 26px | 1.2% | 14px | 0.34% | 0% |
10➔ | panicle polygon | 0808_0004_Frame_23.png | 2160 x 4096 | 40px | 1.85% | 31px | 0.76% | 0% |
License #
Citation #
If you make use of the Paddy Rice Imagery data, please cite the following reference:
@dataset{wang_hao_2021_4444741,
  author       = {Wang, Hao and
                  Lyu, Suxing},
  title        = {{UAV Imagery Dataset for Paddy Rice Panicle
                   Detection}},
  month        = jan,
  year         = 2021,
  publisher    = {Zenodo},
  version      = {1.0},
  doi          = {10.5281/zenodo.4444741},
  url          = {https://doi.org/10.5281/zenodo.4444741}
}

@article{wang2021paddy,
  title={Paddy Rice Imagery Dataset for Panicle Segmentation},
  author={Wang, Hao and Lyu, Suxing and Ren, Yaxin},
  journal={Agronomy},
  volume={11},
  number={8},
  pages={1542},
  year={2021},
  publisher={Multidisciplinary Digital Publishing Institute}
}
If you are happy with Dataset Ninja and use provided visualizations and tools in your work, please cite us:
@misc{ visualization-tools-for-paddy-rice-panicle-detection-dataset,
  title = { Visualization Tools for Paddy Rice Imagery Dataset },
  type = { Computer Vision Tools },
  author = { Dataset Ninja },
  howpublished = { \url{ https://datasetninja.com/paddy-rice-panicle-detection } },
  url = { https://datasetninja.com/paddy-rice-panicle-detection },
  journal = { Dataset Ninja },
  publisher = { Dataset Ninja },
  year = { 2026 },
  month = { jan },
  note = { visited on 2026-01-21 },
}
Download #
Dataset Paddy Rice Imagery can be downloaded in Supervisely format:
As an alternative, it can be downloaded with dataset-tools package:
pip install --upgrade dataset-tools
… using following python code:
import dataset_tools as dtools

dtools.download(dataset='Paddy Rice Imagery', dst_dir='~/dataset-ninja/')
Make sure not to overlook the python code example available on the Supervisely Developer Portal. It will give you a clear idea of how to effortlessly work with the downloaded dataset.
The data in original format can be downloaded here:
Disclaimer #
Our gal from the legal dep told us we need to post this:
Dataset Ninja provides visualizations and statistics for some datasets that can be found online and can be downloaded by general audience. Dataset Ninja is not a dataset hosting platform and can only be used for informational purposes. The platform does not claim any rights for the original content, including images, videos, annotations and descriptions. Joint publishing is prohibited.
You take full responsibility when you use datasets presented at Dataset Ninja, as well as other information, including visualizations and statistics we provide. You are in charge of compliance with any dataset license and all other permissions. You are required to navigate datasets homepage and make sure that you can use it. In case of any questions, get in touch with us at hello@datasetninja.com.


