
Introduction #
The authors of the PAXRAY: A Projected dataset for the segmentation of Anatomical structures in X-RAY data present a novel pipeline for generating annotations to assist the CXR (chest X-ray) domain by extracting information from more easily annotatable CTs (computed tomography scans). They provide a densely labeled fine-grained dataset for anatomy segmentation, encompassing both frontal and lateral views. The methodology leverages the consistency of anatomy across imaging domains, utilizing established models in the CT domain to generate annotations automatically. These annotations and corresponding images are then projected to 2D, mimicking the X-ray domain.
To exploit anatomical structures, the authors used a sophisticated automatic system for collecting and integrating human body structures from computed tomography data first fine-grained anatomy dataset. Their evaluation showed that methods using anatomical information significantly improved the visual support of radiologists’ conclusions. Based on high-quality predictions in CT space, the authors displayed 92 individual anatomical marks structures which, including superclasses, lead to a total of 166 labels in both side and front view. All annotations on both the lateral and frontal views overlap because the authors view anatomical structures as 3D volume classes that can overlap along one dimension.
Dataset description
Due to the immense difficulty of gathering precise pixel-wise annotations in the CXR domain, most datasets rely on either automatically parsed pathology labels or complete medical reports. In contrast, as the authors extract information from much easier to annotate CTs, they propose a novel pipeline for generating annotations assisting the CXR domain and provide a densely labeled fine-grained dataset for anatomy segmentation containing both frontal and lateral
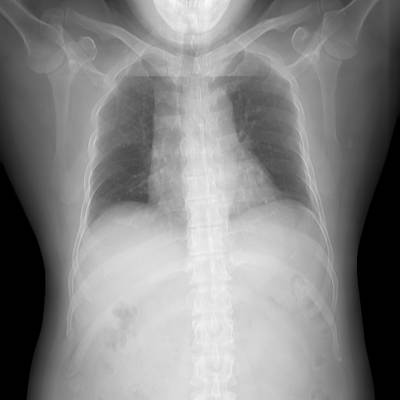
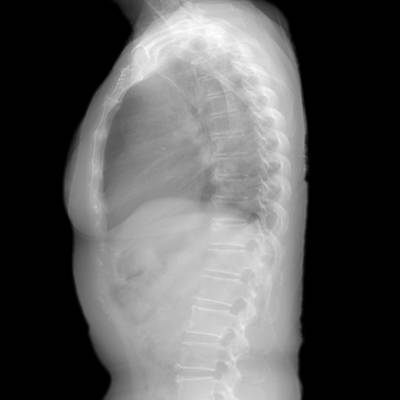
views. Here, they leverage the consistency of anatomy between imaging domains to collect annotations from established models in the CT domain and then project these automatically generated annotations and images to 2D imitating the X-ray domain as shown below:
Dataset creation protocol. The authors of the dataset apply established 3D segmentation methods to generate comprehensive annotations of a CT dataset. Afterwards, the CTs and their labels are projected to 2D using post-processing techniques to emulate X-ray characteristics.
The authors consider four super-categories: bones, lung, mediastinum, and sub-diaphragm. Each fine-grained class is assumed to be a subset of its parent class, for example, the segmentation of individual vertebrae and overall ribs within the bone structure. The rib annotation is expanded by discerning individual ribs, posterior, and anterior parts based on their center and horizontal inflection.
For lung annotation, the authors utilize the lung lobe segmentation model. Merging individual lobes results in the formation of lung halves. Pulmonary vessels and total lungs are then gathered through calculated thresholding and post-processing strategies.
For the mediastinum, the authors focus on the area between the lung halves. This area is segmented and split into superior and inferior along the 4th T-spine following medical definitions. Annotations for the heart, aorta, airways, and esophagus are extracted.
Regarding the sub-diaphragm, the authors consider the area below the diaphragm. This area is extracted from the soft tissue region segmented using the BCA, which is then split centrally into the left/right hemidiaphragm due to the absence of an anatomical indicator. Volumes with contradicting segmentations are ignored, and volumes with noticeable errors are manually removed.
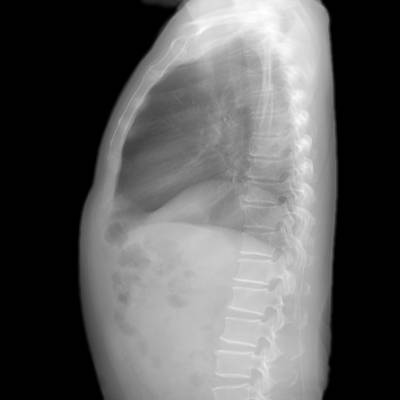
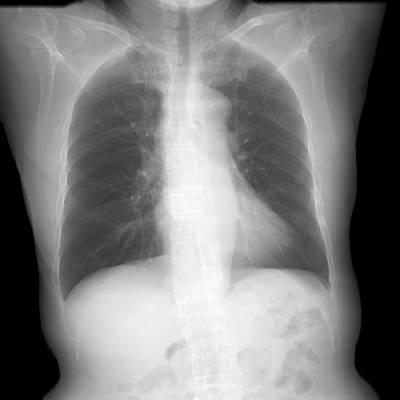
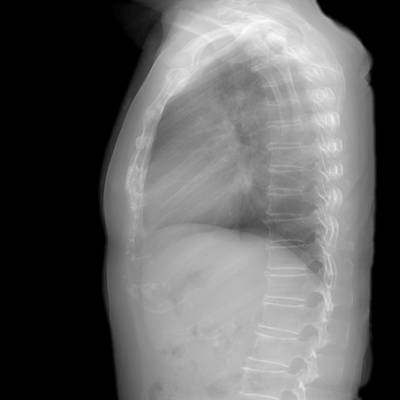
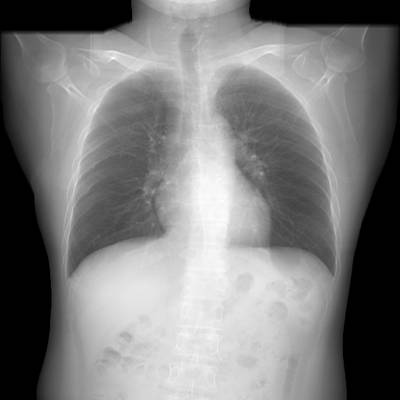
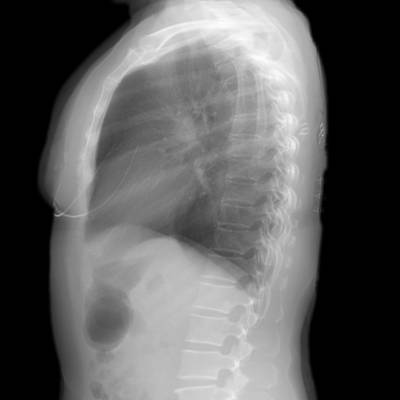
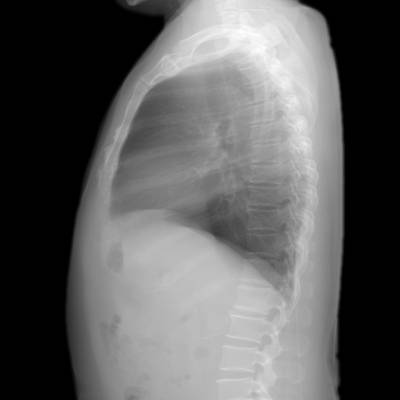
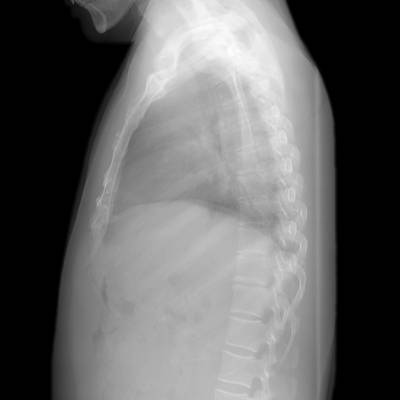
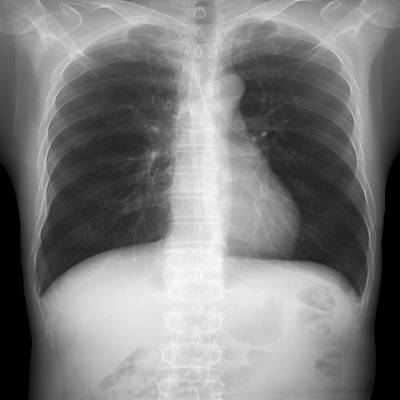
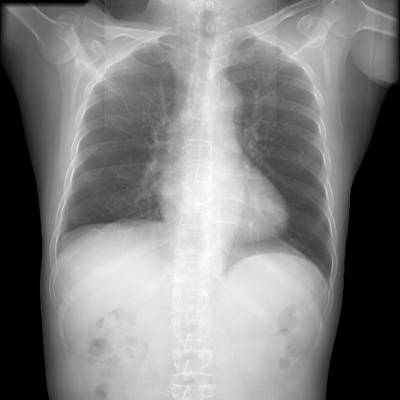
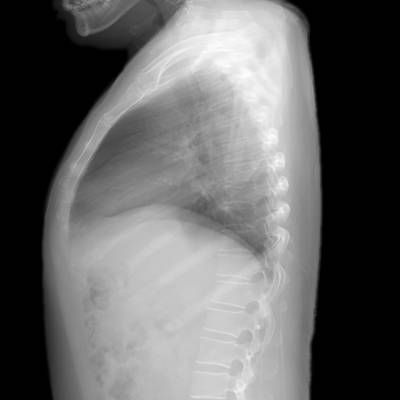
Examples of overlapping annotations in both lateral and frontal view of PAX-ray.
In medical reports, the authors of the dataset note that medical observations are frequently associated with specific anatomical regions to denote their respective positions. Building upon the assumption of co-occurrence between diseases and anatomical regions within the text, a straightforward baseline is developed by the authors to assess the effectiveness of anatomy guidance in grounding observations.
For each image-report pair in a dataset comprising N pairs, the authors focus on the finding-section of the report. This section contains descriptions of visual observations present in the image. The authors process the report sentence-wise, segmenting it into medically relevant phrases. These phrases are then classified as either problems or treatments using a named-entity-recognition (NER) model. Any non-relevant information is subsequently discarded.
Examples of overlapping annotations in both lateral and frontal view of PAX-ray.
The authors did not provide the resulting descriptions, so we cannot tag them.
 Homepage
 Research PaperSupplementary Material
Summary #
PAXRAY: A Projected dataset for the segmentation of Anatomical structures in X-RAY data is a dataset for instance segmentation, semantic segmentation, and object detection tasks. It is used in the medical industry.
The dataset consists of 852 images with 161742 labeled objects belonging to 165 different classes including lung_overall, lung_left_lobeupper, lung_left_lobelower, and other: lung_right_lobeupper, lung_right_lobemiddle, lung_right_lobelower, mediastinum_overall, mediastinum_lower, mediastinum_upper, mediastinum_anterior, mediastinum_middle, mediastinum_posterior, heart, airways, esophagus, aorta, aorta_arch, bones, spine, t1, t2, t3, t4, t5, t6, t7, t8, t9, and 137 more.
Images in the PAXRAY dataset have pixel-level instance segmentation annotations. Due to the nature of the instance segmentation task, it can be automatically transformed into a semantic segmentation (only one mask for every class) or object detection (bounding boxes for every object) tasks. All images are labeled (i.e. with annotations). There are 3 splits in the dataset: train (598 images), test (180 images), and val (74 images). Additionally, every image has following tags: im_id and view (frontal or lateral). Explore it in supervisely labeling tool. The dataset was released in 2022 by the GE joint research group.
Here is a visualized example for randomly selected sample classes:
Explore #
PAXRAY dataset has 852 images. Click on one of the examples below or open "Explore" tool anytime you need to view dataset images with annotations. This tool has extended visualization capabilities like zoom, translation, objects table, custom filters and more. Hover the mouse over the images to hide or show annotations.


Class balance #
There are 165 annotation classes in the dataset. Find the general statistics and balances for every class in the table below. Click any row to preview images that have labels of the selected class. Sort by column to find the most rare or prevalent classes.

Class ㅤ | Images ㅤ | Objects ㅤ | Count on image average | Area on image average |
|---|---|---|---|---|
t9➔ mask | 852 | 872 | 1.02 | 1.33% |
t8➔ mask | 852 | 872 | 1.02 | 1.34% |
t7➔ mask | 852 | 872 | 1.02 | 1.32% |
t6➔ mask | 852 | 873 | 1.02 | 1.26% |
t5➔ mask | 852 | 907 | 1.06 | 1.2% |
t4➔ mask | 852 | 898 | 1.05 | 1.13% |
t3➔ mask | 852 | 896 | 1.05 | 1.08% |
t2➔ mask | 852 | 869 | 1.02 | 1.08% |
t12➔ mask | 852 | 879 | 1.03 | 1.36% |
t11➔ mask | 852 | 871 | 1.02 | 1.29% |
Images #
Explore every single image in the dataset with respect to the number of annotations of each class it has. Click a row to preview selected image. Sort by any column to find anomalies and edge cases. Use horizontal scroll if the table has many columns for a large number of classes in the dataset.
Object distribution #
Interactive heatmap chart for every class with object distribution shows how many images are in the dataset with a certain number of objects of a specific class. Users can click cell and see the list of all corresponding images.
Class sizes #
The table below gives various size properties of objects for every class. Click a row to see the image with annotations of the selected class. Sort columns to find classes with the smallest or largest objects or understand the size differences between classes.
Class | Object count | Avg area | Max area | Min area | Min height | Min height | Max height | Max height | Avg height | Avg height | Min width | Min width | Max width | Max width |
|---|---|---|---|---|---|---|---|---|---|---|---|---|---|---|
lung_right_vessel mask | 7460 | 0.71% | 15.57% | 0.01% | 1px | 0.2% | 376px | 73.44% | 40px | 7.75% | 3px | 0.59% | 297px | 58.01% |
lung_left_vessel mask | 6041 | 0.71% | 10.32% | 0.01% | 2px | 0.39% | 378px | 73.83% | 44px | 8.62% | 2px | 0.39% | 268px | 52.34% |
ribs mask | 2583 | 7.78% | 33.99% | 0.08% | 13px | 2.54% | 512px | 100% | 254px | 49.64% | 17px | 3.32% | 372px | 72.66% |
bones mask | 2072 | 18.44% | 68.14% | 0.01% | 5px | 0.98% | 512px | 100% | 219px | 42.79% | 5px | 0.98% | 512px | 100% |
mediastinum_anterior mask | 1458 | 1.67% | 9.91% | 0.01% | 1px | 0.2% | 262px | 51.17% | 103px | 20.14% | 1px | 0.2% | 290px | 56.64% |
rib_anterior_10 mask | 1358 | 0.22% | 1.2% | 0.01% | 4px | 0.78% | 97px | 18.95% | 44px | 8.51% | 3px | 0.59% | 139px | 27.15% |
rib_anterior_9 mask | 1354 | 0.4% | 1.5% | 0.01% | 7px | 1.37% | 127px | 24.8% | 66px | 12.97% | 4px | 0.78% | 150px | 29.3% |
rib_anterior_8 mask | 1344 | 0.55% | 2.01% | 0.01% | 7px | 1.37% | 141px | 27.54% | 81px | 15.82% | 4px | 0.78% | 147px | 28.71% |
rib_anterior_7 mask | 1332 | 0.71% | 3.56% | 0.03% | 28px | 5.47% | 173px | 33.79% | 85px | 16.56% | 4px | 0.78% | 177px | 34.57% |
rib_anterior_1 mask | 1310 | 0.52% | 2.23% | 0.01% | 3px | 0.59% | 110px | 21.48% | 48px | 9.31% | 3px | 0.59% | 150px | 29.3% |
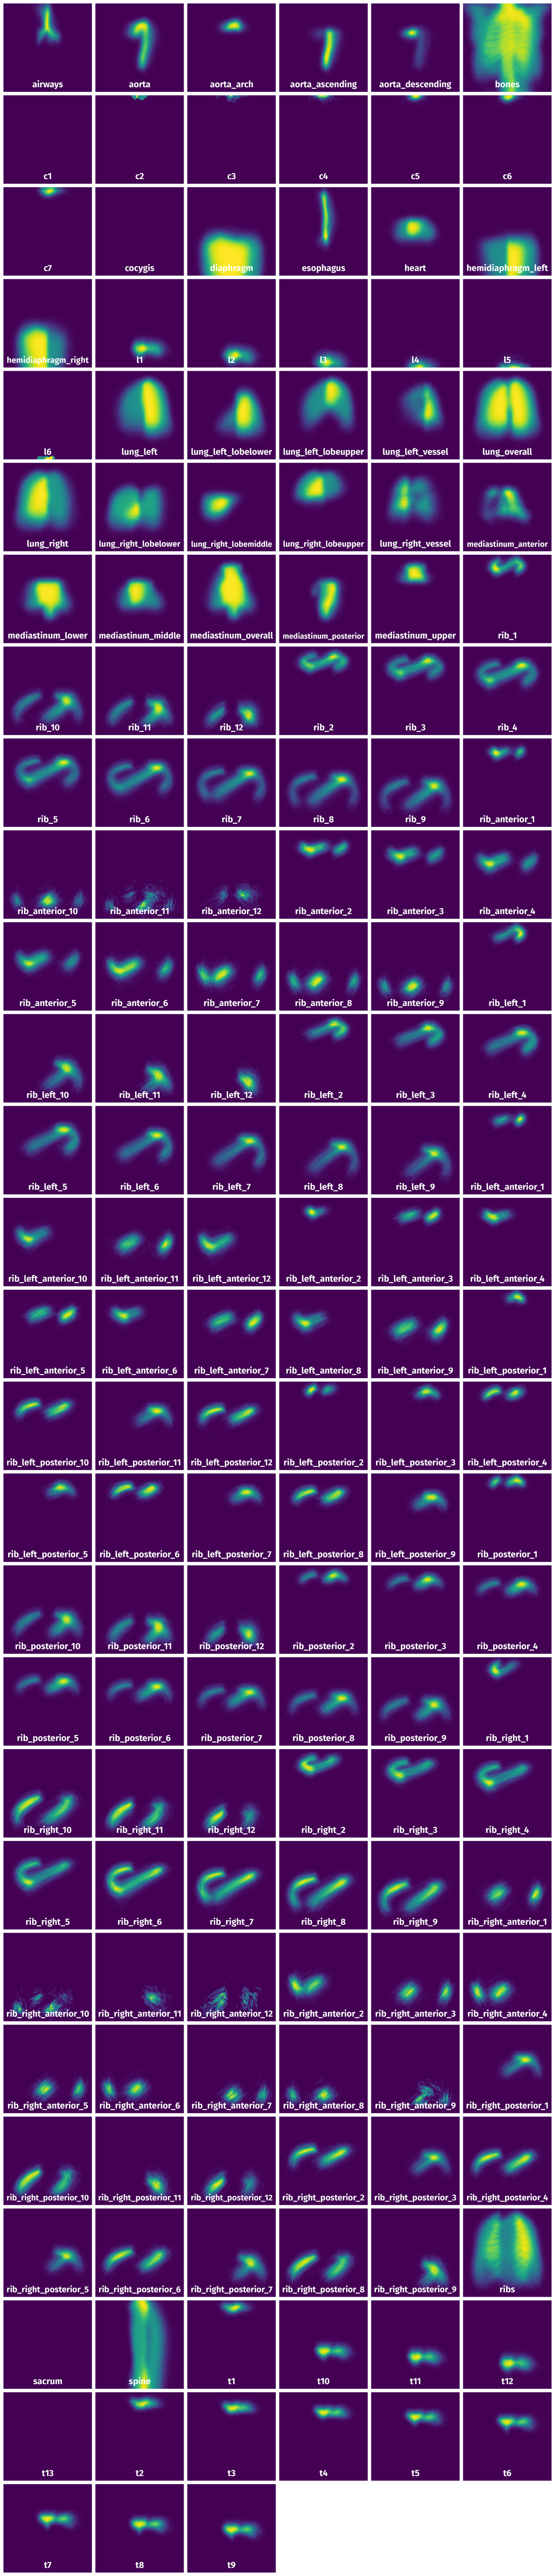
Spatial Heatmap #
The heatmaps below give the spatial distributions of all objects for every class. These visualizations provide insights into the most probable and rare object locations on the image. It helps analyze objects' placements in a dataset.
Objects #
Table contains all 106784 objects. Click a row to preview an image with annotations, and use search or pagination to navigate. Sort columns to find outliers in the dataset.
Object ID ㅤ | Class ㅤ | Image name click row to open | Image size height x width | Height ㅤ | Height ㅤ | Width ㅤ | Width ㅤ | Area ㅤ |
|---|---|---|---|---|---|---|---|---|
1➔ | lung_overall mask | RibFrac360lateral.png | 512 x 512 | 272px | 53.12% | 252px | 49.22% | 19.94% |
2➔ | lung_right mask | RibFrac360lateral.png | 512 x 512 | 272px | 53.12% | 252px | 49.22% | 19.94% |
3➔ | lung_left_lobeupper mask | RibFrac360lateral.png | 512 x 512 | 263px | 51.37% | 220px | 42.97% | 13.66% |
4➔ | lung_left_lobelower mask | RibFrac360lateral.png | 512 x 512 | 194px | 37.89% | 157px | 30.66% | 7.11% |
5➔ | lung_right_lobeupper mask | RibFrac360lateral.png | 512 x 512 | 178px | 34.77% | 225px | 43.95% | 9.63% |
6➔ | lung_right_lobemiddle mask | RibFrac360lateral.png | 512 x 512 | 105px | 20.51% | 151px | 29.49% | 3.98% |
7➔ | lung_right_lobelower mask | RibFrac360lateral.png | 512 x 512 | 188px | 36.72% | 188px | 36.72% | 8.4% |
8➔ | lung_right_vessel mask | RibFrac360lateral.png | 512 x 512 | 234px | 45.7% | 224px | 43.75% | 8.3% |
9➔ | lung_right_vessel mask | RibFrac360lateral.png | 512 x 512 | 6px | 1.17% | 8px | 1.56% | 0.01% |
10➔ | lung_right_vessel mask | RibFrac360lateral.png | 512 x 512 | 6px | 1.17% | 8px | 1.56% | 0.01% |
License #
License is unknown for the PAXRAY: A Projected dataset for the segmentation of Anatomical structures in X-RAY data dataset.
Citation #
If you make use of the PAXRAY data, please cite the following reference:
@inproceedings{paxray,
    author = {Seibold,Constantin and Reiß,Simon and Sarfraz,Saquib and Fink,Matthias A. and Mayer,Victoria and Sellner,Jan and Kim,Moon Sung and Maier-Hein, Klaus H. and Kleesiek, Jens  and Stiefelhagen,Rainer},
    title = {Detailed Annotations of Chest X-Rays via CT Projection for Report Understanding},
    booktitle = {Proceedings of the 33th British Machine Vision Conference (BMVC)},
    year = {2022}
}
If you are happy with Dataset Ninja and use provided visualizations and tools in your work, please cite us:
@misc{ visualization-tools-for-paxray-dataset,
  title = { Visualization Tools for PAXRAY Dataset },
  type = { Computer Vision Tools },
  author = { Dataset Ninja },
  howpublished = { \url{ https://datasetninja.com/paxray } },
  url = { https://datasetninja.com/paxray },
  journal = { Dataset Ninja },
  publisher = { Dataset Ninja },
  year = { 2026 },
  month = { jul },
  note = { visited on 2026-07-20 },
}
Download #
Please visit dataset homepage to download the data.
Disclaimer #
Our gal from the legal dep told us we need to post this:
Dataset Ninja provides visualizations and statistics for some datasets that can be found online and can be downloaded by general audience. Dataset Ninja is not a dataset hosting platform and can only be used for informational purposes. The platform does not claim any rights for the original content, including images, videos, annotations and descriptions. Joint publishing is prohibited.
You take full responsibility when you use datasets presented at Dataset Ninja, as well as other information, including visualizations and statistics we provide. You are in charge of compliance with any dataset license and all other permissions. You are required to navigate datasets homepage and make sure that you can use it. In case of any questions, get in touch with us at hello@datasetninja.com.