
Introduction #
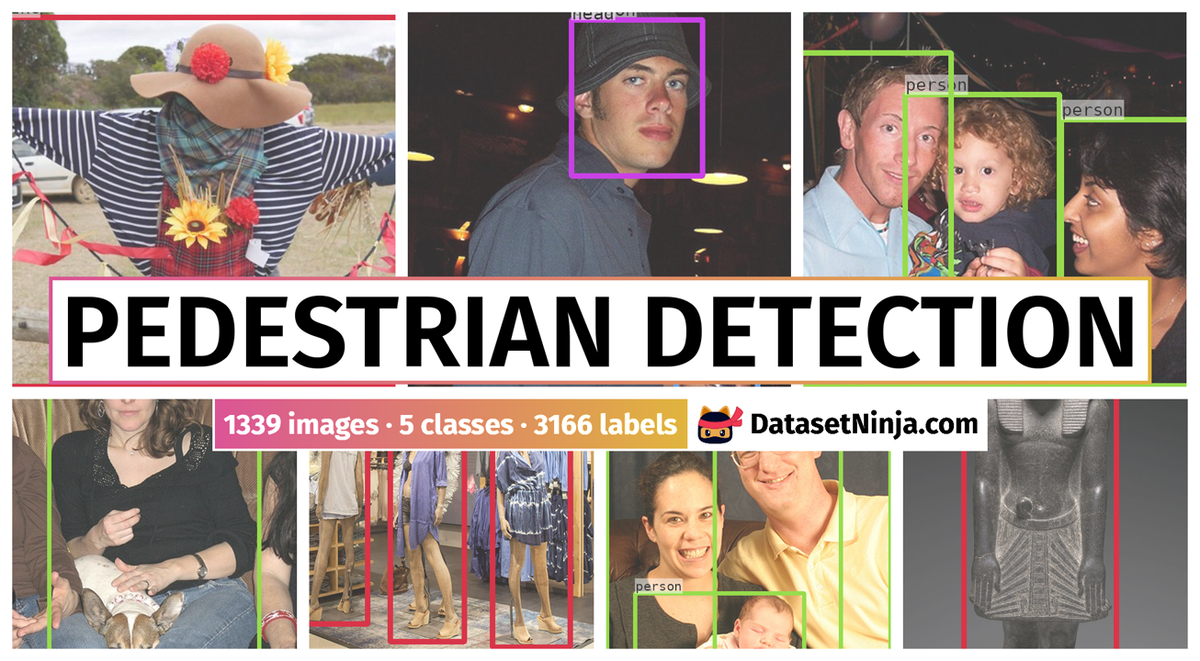
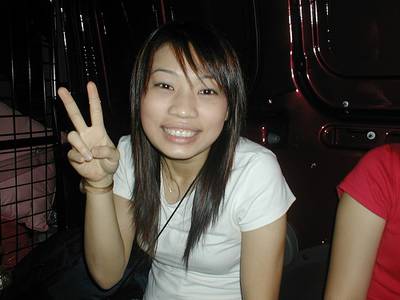
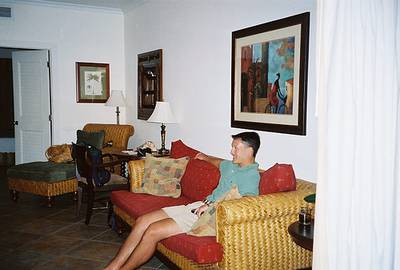
Pedestrian Detection dataset addresses the challenge of false positives in person detection, a critical subfield of object detection essential for applications like person tracking, intelligent surveillance systems, and autonomous vehicles. consists of 944 train images, 160 val images, and 235 test images, with a total of 1626 person and 1368 person-like labelling.
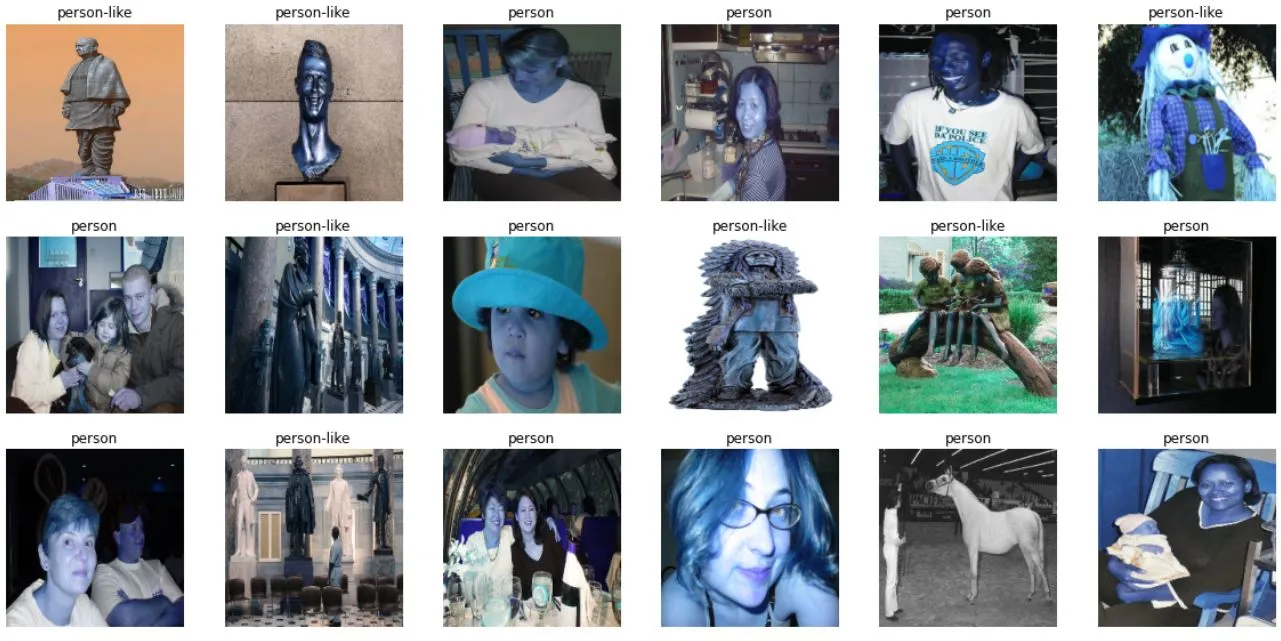
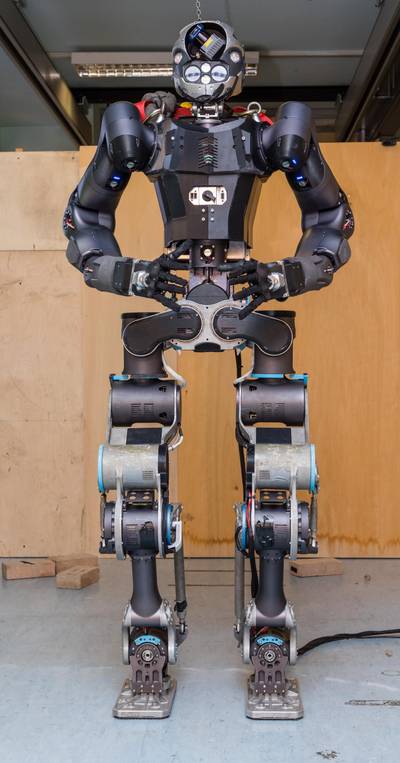
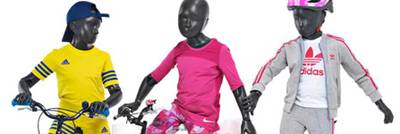
Some objects have very similar features to those of a person. If a model is trained using a dataset containing only persons, it leads to several false positives since it cannot differentiate such objects from that of a person. Our dataset includes person and person-like objects (PnPLO). Person-like objects that the authors introduce in our dataset are statues, mannequins, scarecrows, and robots. Authors used the SSD model to show that, on training a model using our dataset, authors can significantly reduce the false positives during detection when compared to models trained on standard person datasets, thereby improving the precision.
 Homepage
 Research Paper
Summary #
Pedestrian Detection is a dataset for an object detection task. It is used in the surveillance industry.
The dataset consists of 1339 images with 3166 labeled objects belonging to 5 different classes including person, person-like, head, and other: hand and foot.
Images in the Pedestrian Detection dataset have bounding box annotations. All images are labeled (i.e. with annotations). There are 3 splits in the dataset: train (944 images), test (235 images), and val (160 images). Also, objects in the dataset have pose tag. Explore them in the supervisely labeling tool. The dataset was released in 2020 by the National Institute of Technology, India.
Explore #
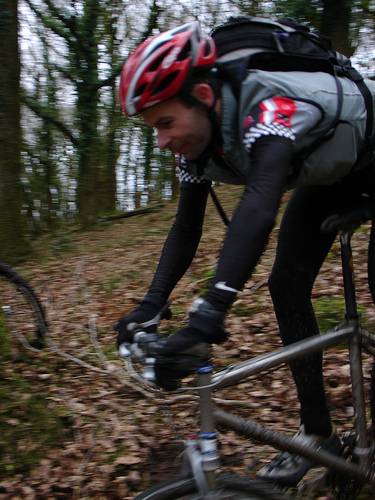
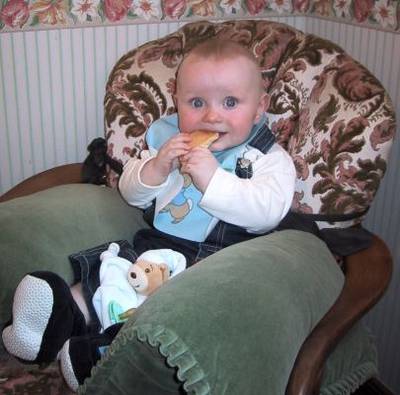
Pedestrian Detection dataset has 1339 images. Click on one of the examples below or open "Explore" tool anytime you need to view dataset images with annotations. This tool has extended visualization capabilities like zoom, translation, objects table, custom filters and more. Hover the mouse over the images to hide or show annotations.


Class balance #
There are 5 annotation classes in the dataset. Find the general statistics and balances for every class in the table below. Click any row to preview images that have labels of the selected class. Sort by column to find the most rare or prevalent classes.

Class ㅤ | Images ㅤ | Objects ㅤ | Count on image average | Area on image average |
|---|---|---|---|---|
person➔ rectangle | 820 | 1626 | 1.98 | 40.66% |
person-like➔ rectangle | 601 | 1368 | 2.28 | 46.81% |
head➔ rectangle | 32 | 47 | 1.47 | 4.36% |
hand➔ rectangle | 32 | 79 | 2.47 | 1.83% |
foot➔ rectangle | 18 | 46 | 2.56 | 0.89% |
Co-occurrence matrix #
Co-occurrence matrix is an extremely valuable tool that shows you the images for every pair of classes: how many images have objects of both classes at the same time. If you click any cell, you will see those images. We added the tooltip with an explanation for every cell for your convenience, just hover the mouse over a cell to preview the description.
Images #
Explore every single image in the dataset with respect to the number of annotations of each class it has. Click a row to preview selected image. Sort by any column to find anomalies and edge cases. Use horizontal scroll if the table has many columns for a large number of classes in the dataset.
Object distribution #
Interactive heatmap chart for every class with object distribution shows how many images are in the dataset with a certain number of objects of a specific class. Users can click cell and see the list of all corresponding images.
Class sizes #
The table below gives various size properties of objects for every class. Click a row to see the image with annotations of the selected class. Sort columns to find classes with the smallest or largest objects or understand the size differences between classes.
Class | Object count | Avg area | Max area | Min area | Min height | Min height | Max height | Max height | Avg height | Avg height | Min width | Min width | Max width | Max width |
|---|---|---|---|---|---|---|---|---|---|---|---|---|---|---|
person rectangle | 1626 | 22.51% | 99.53% | 0.05% | 20px | 3.41% | 1312px | 99.8% | 231px | 56.59% | 12px | 1.33% | 984px | 99.8% |
person-like rectangle | 1368 | 21.54% | 99.01% | 0.09% | 31px | 4.95% | 3455px | 99.88% | 497px | 67.44% | 19px | 1.79% | 2369px | 99.83% |
hand rectangle | 79 | 0.77% | 8.64% | 0.04% | 8px | 2.19% | 150px | 40% | 30px | 7.62% | 8px | 1.6% | 120px | 24% |
head rectangle | 47 | 2.97% | 31.86% | 0.1% | 15px | 4.1% | 251px | 66.93% | 64px | 16.1% | 11px | 2.2% | 238px | 47.6% |
foot rectangle | 46 | 0.37% | 1.89% | 0.03% | 5px | 1.37% | 56px | 13.15% | 22px | 5.65% | 9px | 1.8% | 81px | 24.25% |
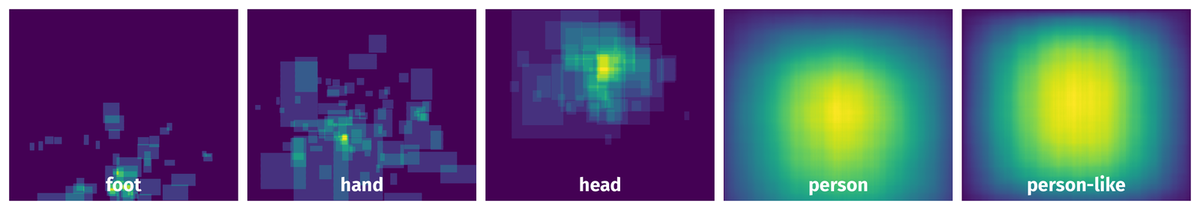
Spatial Heatmap #
The heatmaps below give the spatial distributions of all objects for every class. These visualizations provide insights into the most probable and rare object locations on the image. It helps analyze objects' placements in a dataset.
Objects #
Table contains all 3166 objects. Click a row to preview an image with annotations, and use search or pagination to navigate. Sort columns to find outliers in the dataset.
Object ID ㅤ | Class ㅤ | Image name click row to open | Image size height x width | Height ㅤ | Height ㅤ | Width ㅤ | Width ㅤ | Area ㅤ |
|---|---|---|---|---|---|---|---|---|
1➔ | person-like rectangle | image (787).jpg | 900 x 900 | 793px | 88.11% | 279px | 31% | 27.31% |
2➔ | person-like rectangle | image (757).jpg | 720 x 1280 | 683px | 94.86% | 1114px | 87.03% | 82.56% |
3➔ | person rectangle | image (304).jpg | 500 x 334 | 420px | 84% | 230px | 68.86% | 57.84% |
4➔ | person rectangle | image (133).jpg | 375 x 500 | 322px | 85.87% | 252px | 50.4% | 43.28% |
5➔ | person-like rectangle | image (570).jpg | 400 x 600 | 361px | 90.25% | 102px | 17% | 15.34% |
6➔ | person-like rectangle | image (570).jpg | 400 x 600 | 252px | 63% | 85px | 14.17% | 8.93% |
7➔ | person-like rectangle | image (570).jpg | 400 x 600 | 331px | 82.75% | 97px | 16.17% | 13.38% |
8➔ | person-like rectangle | image (570).jpg | 400 x 600 | 391px | 97.75% | 111px | 18.5% | 18.08% |
9➔ | person-like rectangle | image (570).jpg | 400 x 600 | 361px | 90.25% | 126px | 21% | 18.95% |
10➔ | person rectangle | image (570).jpg | 400 x 600 | 329px | 82.25% | 121px | 20.17% | 16.59% |
License #
License is unknown for the Pedestrian Detection dataset.
Citation #
If you make use of the Pedestrian Detection data, please cite the following reference:
@InProceedings{10.1007/978-981-15-7031-5_103,
  author="Karthika, N. J. and Chandran, Saravanan",
  editor="Mallick, Pradeep Kumar and Meher, Preetisudha and Majumder, Alak and Das, Santos Kumar",
  title="Addressing the False Positives in Pedestrian Detection",
  booktitle="Electronic Systems and Intelligent Computing",
  year="2020",
  publisher="Springer Singapore",
  address="Singapore",
  pages="1083--1092",
  isbn="978-981-15-7031-5"
}
If you are happy with Dataset Ninja and use provided visualizations and tools in your work, please cite us:
@misc{ visualization-tools-for-pedestrian-detection-dataset,
  title = { Visualization Tools for Pedestrian Detection Dataset },
  type = { Computer Vision Tools },
  author = { Dataset Ninja },
  howpublished = { \url{ https://datasetninja.com/pedestrian-detection } },
  url = { https://datasetninja.com/pedestrian-detection },
  journal = { Dataset Ninja },
  publisher = { Dataset Ninja },
  year = { 2026 },
  month = { jul },
  note = { visited on 2026-07-24 },
}
Download #
Please visit dataset homepage to download the data.
Disclaimer #
Our gal from the legal dep told us we need to post this:
Dataset Ninja provides visualizations and statistics for some datasets that can be found online and can be downloaded by general audience. Dataset Ninja is not a dataset hosting platform and can only be used for informational purposes. The platform does not claim any rights for the original content, including images, videos, annotations and descriptions. Joint publishing is prohibited.
You take full responsibility when you use datasets presented at Dataset Ninja, as well as other information, including visualizations and statistics we provide. You are in charge of compliance with any dataset license and all other permissions. You are required to navigate datasets homepage and make sure that you can use it. In case of any questions, get in touch with us at hello@datasetninja.com.