
Introduction #
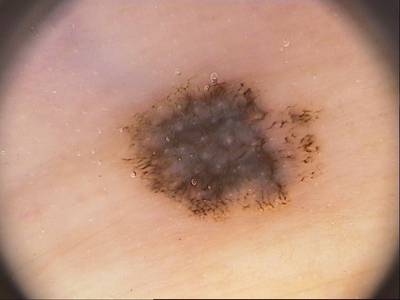
The PH2: A Dermoscopic Image Database for Research and Benchmarking dataset was developed for computer-aided diagnosis systems, specifically for the classification of dermoscopic images of melanoma. Its purpose is to facilitate comparative studies involving segmentation and classification algorithms. This dataset comprises a total of 200 dermoscopic images of melanocytic lesions with a vast amount of metainformation. It includes 80 common nevi, 80 atypical nevi, and 40 melanomas.
Within the PH² database, each image comes with medical annotations. These annotations include the medical segmentation of the lesion, clinical and histological diagnoses, and the evaluation of various dermoscopic criteria, such as colors, pigment network, dots/globules, streaks, regression areas, and blue-whitish veil. The dermoscopic images were captured at the Dermatology Service of Hospital Pedro Hispano in Matosinhos, Portugal. These images were consistently acquired under the same conditions using the Tuebinger Mole Analyzer system, with a magnification of 20x. They are 8-bit RGB color images with a resolution of 768x560 pixels.
The assessment of each parameter was performed by an expert dermatologist, according to the following parameters:
| Criterion | PH² Segmentation |
| Clinical Diagnosis | 0 - Common Nevus |
| 1 - Atypical Nevus | |
| 2 - Melanoma | Lesion Segmentation | Available as a binary mask (with the samsize of the original image). | Color Segmentation | Available as a binary mask (with the samsize of the original image) (If available). | Asymmetry | 0 - Fully Symmetry |
| 1 – Asymmetry in One Axis | |
| 2 - Fully Asymmetry | Pigment Networkstrong | AT - Atypical |
| T - Typical | Dots/Globules | A - Absent |
| AT - Atypical | |
| T - Typical | Streaks | A - Absent |
| P - Present | Regression Areasstrong | A - Absent |
| P - Present | Blue Whitish Veilstrong | A - Absent |
| P - Present | Colors | 1 - White |
| 2 - Red | |
| 3 - Light-Brown | |
| 4 - Dark-Brown | |
| 5 - Blue-Gray | |
| 6 - Black |
The rather small number of melanomas, compared with the other two types of melanocytic lesions, can be explained by two main reasons. First of all, the number of real cases of melanomas is actually much smaller than the other ones. In addition, as melanomas are usually not completely inserted in the image frame and present many image artifacts, they are not always suitable to be used as ground truth in the evaluation of CAD systems.
For each image in the database, the manual segmentation and the clinical diagnosis of the skin lesion as well as theidentification of other important dermoscopic criteria are available. These dermoscopic criteria include the assessment of the lesion asymmetry, and also the identification of colors in several differential structures, such as pigment network, dots, globules, streaks, regression areas, and blue-whitish veil.
The size of the PH² database (200 images) might seem small, particularly when compared with a traditional machine learning ground truth database, which may have hundreds of or thousands of annotated images. However, it is important to highlight that the annotation of dermoscopic images is not just a binary issue (benign or malign). The annotation of each image requires a large amount of time and effort since several dermoscopic features have to be assessed to perform the lesion diagnosis. Moreover, the skin lesion and the color classes present in each image have to be manually segmented by expert clinicians. Besides benchmarking computer vision/machine learning algorithms, a database like PH² can be also used for medical training. For instance, dermatologist trainees can test their skills by comparing their own diagnosis and evaluation with the ground truth available in the PH² database.
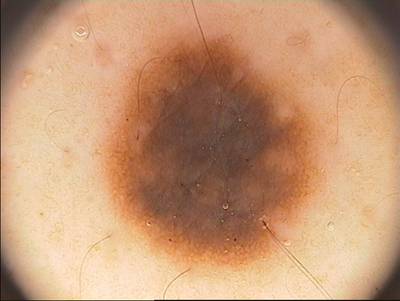
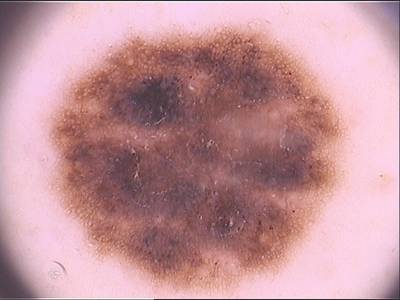
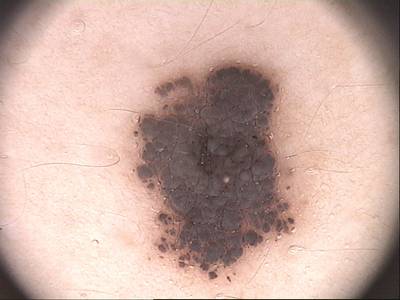
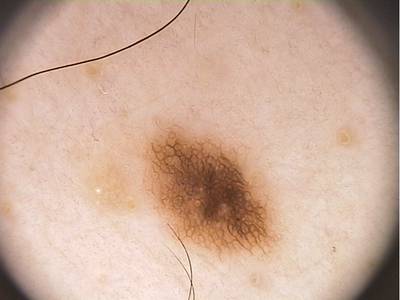
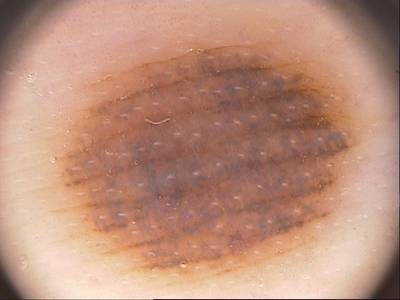
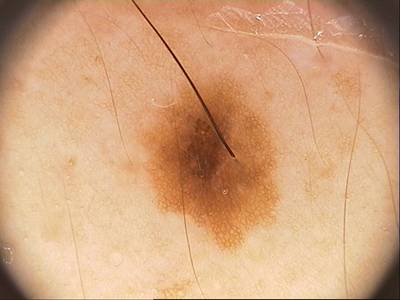
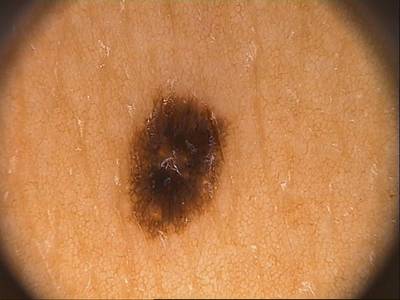
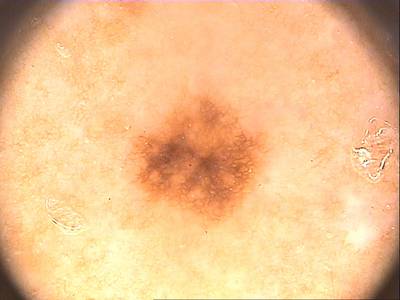
This image database contains a total of 200 dermoscopic images, containing 80 common nevi, 80 atypical nevi, and 40 melanomas. All dermoscopic images are either from the skin type II or III, according to the Fitzpatrick skintype classification scale. Therefore, the skin colors represented in the PH² database may vary from white to cream white. As illustrated in Fig.1, the images of the database were carefully selected taking into account their quality, resolution, and dermoscopic features. Every image is evaluated by an expert dermatologist with regard to the following parameters:
- Manual segmentation of the skin lesion
- Clinical and histological (when available) diagnosis
- Dermoscopic criteria (Asymmetry; Colors; Pigment net-work; Dots/Globules; Streaks; Regression areas; Blue-whitish veil)

Fig. 1: An illustrative collection of images from PH² database, including common nevi (1st row), atypical nevi(2nd row) and melanomas (3rd row)
Dermatologists performed the manual segmentation and annotation of the images using a customized annotation tool for dermoscopic images, called DerMAT. As an example, Fig.2 shows the manual segmentation and annotation of two regions of interest using the DerMAT software.

Fig. 2: DerMAT interface for the segmentation and labeling of multiple regions of interest.
Manual segmentation of the skin lesion
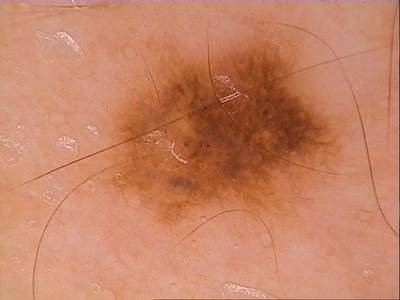
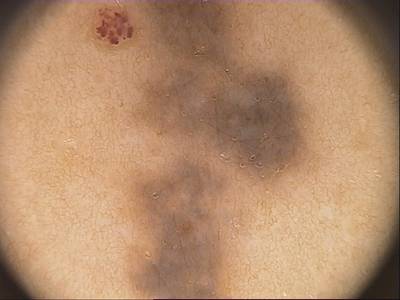
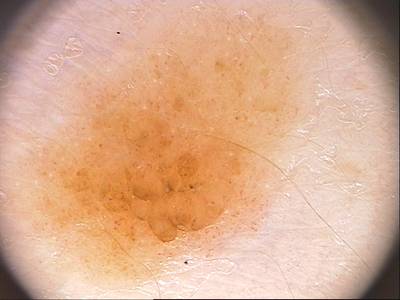
The manual segmentation of the skin lesion, performed by expert dermatologists, is essential information for the evaluation of the segmentation step of a CAD system. In this database, the manual segmentation of each image is available as a binary mask, in which pixels with an intensity value of 1 correspond to the segmented lesion, while pixels with a value of 0 correspond to the background. This binary mask has the same size as the original image and, hence, it can be easily used to extract the boundary coordinates of the lesion. Figure 3 presents examples of three dermoscopic images and the corresponding ground truth (manual) segmentations.

Fig. 3: Manual segmentation of three melanocytic lesions: common nevus (left), atypical nevus (middle), and melanoma(right).
Clinical diagnosis
The melanocytic lesions can be divided into two main groups concerning their nature: benign lesions (which include common and atypical nevus) and malignant lesions(or melanomas). Therefore, each image of the database isclassified into common nevus, atypical nevus, or melanoma (Fig.3). The histological diagnosis is only available for some of the images since the histological test is performed for those lesions considered highly suspicious by dermatologists.
Dermoscopic criteria
The set of dermoscopic features that is available in the PH² database corresponds to those features that the dermatologist of Hospital Pedro Hispano considers more relevant to performing a clinical diagnosis.
 Homepage
 Research Paper
Summary #
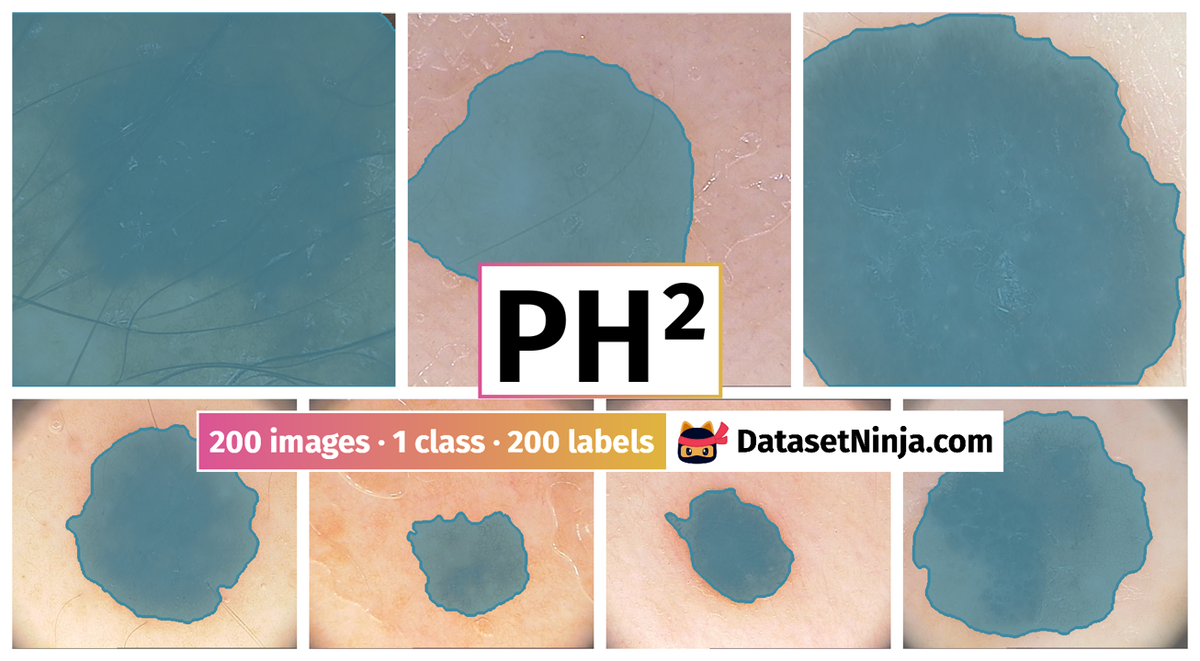
PH2: A Dermoscopic Image Database for Research and Benchmarking is a dataset for a semantic segmentation task. It is used in the medical industry.
The dataset consists of 200 images with 200 labeled objects belonging to 1 single class (lesion).
Images in the PH2 dataset have pixel-level semantic segmentation annotations. All images are labeled (i.e. with annotations). There are no pre-defined train/val/test splits in the dataset. Also Dataset includes histological_diagnosis, clinical_diagnosis, asymmetry, pigment_network, dots/globules, streaks, regression_areas,blue-whitish_veil and colors tags. The dataset was released in 2013 by the Universidade do Porto, Instituto Superior Técnico Lisboa, and The Dermatology Service of Hospital Pedro Hispano.
Explore #
PH2 dataset has 200 images. Click on one of the examples below or open "Explore" tool anytime you need to view dataset images with annotations. This tool has extended visualization capabilities like zoom, translation, objects table, custom filters and more. Hover the mouse over the images to hide or show annotations.


Class balance #
There are 1 annotation classes in the dataset. Find the general statistics and balances for every class in the table below. Click any row to preview images that have labels of the selected class. Sort by column to find the most rare or prevalent classes.

Class ㅤ | Images ㅤ | Objects ㅤ | Count on image average | Area on image average |
|---|---|---|---|---|
lesion➔ mask | 200 | 200 | 1 | 32.24% |
Images #
Explore every single image in the dataset with respect to the number of annotations of each class it has. Click a row to preview selected image. Sort by any column to find anomalies and edge cases. Use horizontal scroll if the table has many columns for a large number of classes in the dataset.
Object distribution #
Interactive heatmap chart for every class with object distribution shows how many images are in the dataset with a certain number of objects of a specific class. Users can click cell and see the list of all corresponding images.
Class sizes #
The table below gives various size properties of objects for every class. Click a row to see the image with annotations of the selected class. Sort columns to find classes with the smallest or largest objects or understand the size differences between classes.
Class | Object count | Avg area | Max area | Min area | Min height | Min height | Max height | Max height | Avg height | Avg height | Min width | Min width | Max width | Max width |
|---|---|---|---|---|---|---|---|---|---|---|---|---|---|---|
lesion mask | 200 | 32.24% | 98.31% | 3.14% | 121px | 21.01% | 576px | 100% | 405px | 70.49% | 129px | 16.78% | 768px | 100% |
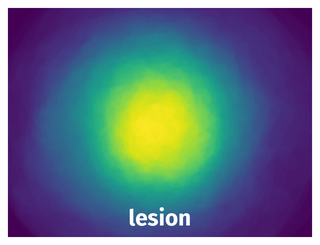
Spatial Heatmap #
The heatmaps below give the spatial distributions of all objects for every class. These visualizations provide insights into the most probable and rare object locations on the image. It helps analyze objects' placements in a dataset.
Objects #
Table contains all 200 objects. Click a row to preview an image with annotations, and use search or pagination to navigate. Sort columns to find outliers in the dataset.
Object ID ㅤ | Class ㅤ | Image name click row to open | Image size height x width | Height ㅤ | Height ㅤ | Width ㅤ | Width ㅤ | Area ㅤ |
|---|---|---|---|---|---|---|---|---|
1➔ | lesion mask | IMD009.bmp | 575 x 766 | 265px | 46.09% | 244px | 31.85% | 11.38% |
2➔ | lesion mask | IMD432.bmp | 576 x 767 | 357px | 61.98% | 405px | 52.8% | 20.76% |
3➔ | lesion mask | IMD430.bmp | 576 x 767 | 401px | 69.62% | 289px | 37.68% | 19.27% |
4➔ | lesion mask | IMD436.bmp | 576 x 767 | 535px | 92.88% | 651px | 84.88% | 55.33% |
5➔ | lesion mask | IMD404.bmp | 576 x 768 | 576px | 100% | 631px | 82.16% | 46.4% |
6➔ | lesion mask | IMD279.bmp | 576 x 767 | 254px | 44.1% | 302px | 39.37% | 10.9% |
7➔ | lesion mask | IMD210.bmp | 576 x 768 | 508px | 88.19% | 442px | 57.55% | 36.62% |
8➔ | lesion mask | IMD135.bmp | 576 x 767 | 552px | 95.83% | 531px | 69.23% | 48.31% |
9➔ | lesion mask | IMD384.bmp | 576 x 767 | 320px | 55.56% | 263px | 34.29% | 12.18% |
10➔ | lesion mask | IMD137.bmp | 576 x 767 | 298px | 51.74% | 267px | 34.81% | 12.97% |
License #
The data included in the PH² database can be used for research and educational purposes. It is important to note that redistribution and commercial use is not allowed. All publications that make use of this dataset must cite the following paper:
Teresa Mendonça, Pedro M. Ferreira, Jorge Marques, Andre R. S. Marcal, Jorge Rozeira.
PH² - A dermoscopic image database for research and benchmarking,
35th International Conference of the IEEE Engineering in Medicine and Biology Society, July 3-7, 2013, Osaka, Japan.
Citation #
If you make use of the PH² data, please cite the following reference:
@dataset{PH²,
  author={Teresa Mendonça and Pedro M. Ferreira and Jorge Marques and Andre R. S. Marcal and Jorge Rozeira},
  title={PH²: A Dermoscopic Image Database for Research and Benchmarking},
  year={2013},
  url={https://www.fc.up.pt/addi/ph2%20database.html}
}
If you are happy with Dataset Ninja and use provided visualizations and tools in your work, please cite us:
@misc{ visualization-tools-for-ph2-dataset,
  title = { Visualization Tools for PH2 Dataset },
  type = { Computer Vision Tools },
  author = { Dataset Ninja },
  howpublished = { \url{ https://datasetninja.com/ph2 } },
  url = { https://datasetninja.com/ph2 },
  journal = { Dataset Ninja },
  publisher = { Dataset Ninja },
  year = { 2026 },
  month = { aug },
  note = { visited on 2026-08-03 },
}
Download #
Please visit dataset homepage to download the data.
Disclaimer #
Our gal from the legal dep told us we need to post this:
Dataset Ninja provides visualizations and statistics for some datasets that can be found online and can be downloaded by general audience. Dataset Ninja is not a dataset hosting platform and can only be used for informational purposes. The platform does not claim any rights for the original content, including images, videos, annotations and descriptions. Joint publishing is prohibited.
You take full responsibility when you use datasets presented at Dataset Ninja, as well as other information, including visualizations and statistics we provide. You are in charge of compliance with any dataset license and all other permissions. You are required to navigate datasets homepage and make sure that you can use it. In case of any questions, get in touch with us at hello@datasetninja.com.