

Introduction #
The Piling Sheet Image Data dataset is designed for classifying and detecting objects on piling sheets. It’s organized into two classification algorithms: 1) 4-class classification: grass, metal_good, metal_bad and rock; 2) 6-class classification: grass, metal_good, metal_acceptable, metal_moderate and metal_bad and rock. Object detection techniques were applied to identify dimensional features (dim and ref) and estimate dimensions that provide insights into the piling sheet’s type.
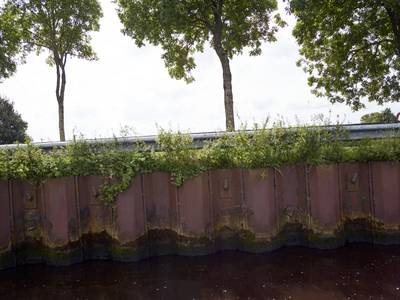
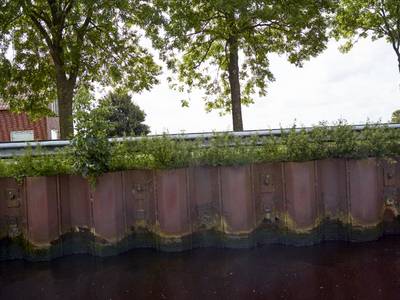
The classes for corrosion were based on Digigids. Grass and rock were included as there was a large amount of it in the raw data-set. See the image below for the application of Digigids classes on the piling sheet. 
In the four class dataset, they combined the classes as:
- Good. Combination of Good and Acceptable.
- Bad. Combination of Moderate and Bad.
After the assessment, the images that have been labeled with metal will be sent through an Object detection algorithm that was made using YOLOv4. This algorithm was trained to detect: the bumps of a piling sheet and a reference object. The reference object was something that was seen on most piling sheets in which we know the actual dimension. The horizontal distance between the bumps was calculated and using the reference object we converted the pixel distance into actual distance.
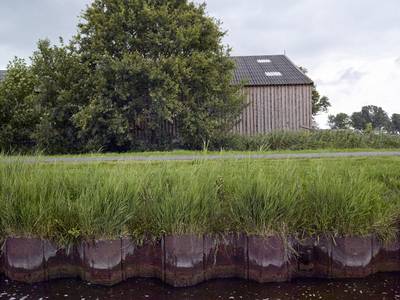
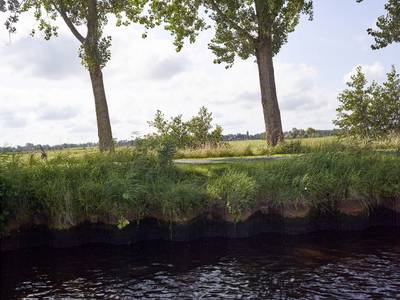
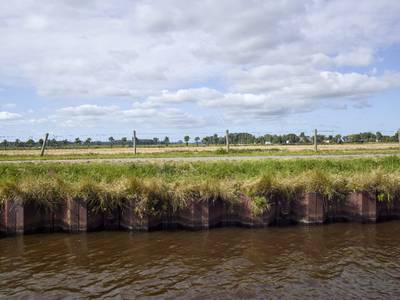
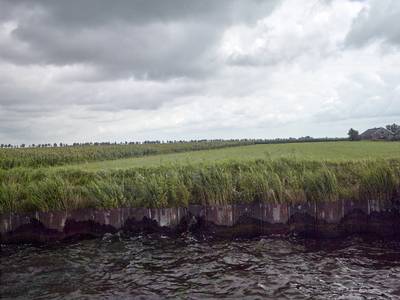
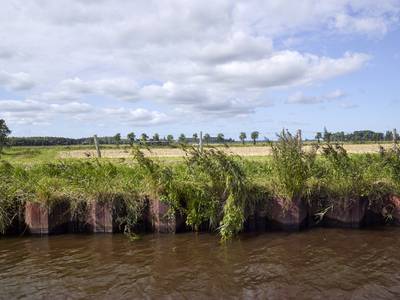
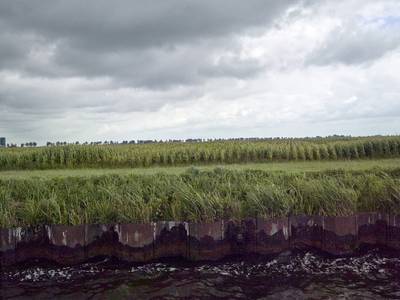
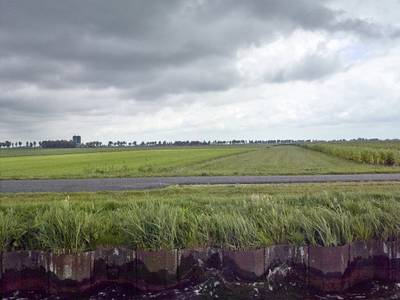
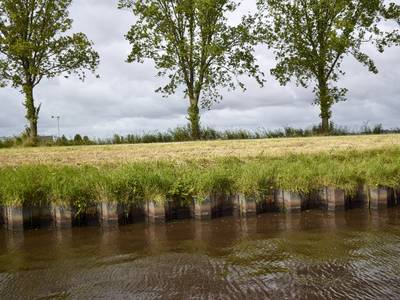
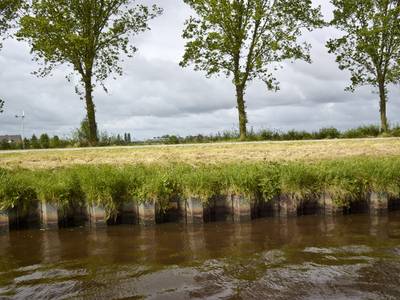
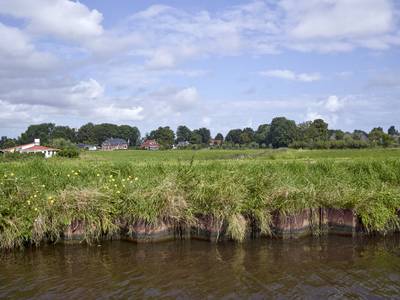
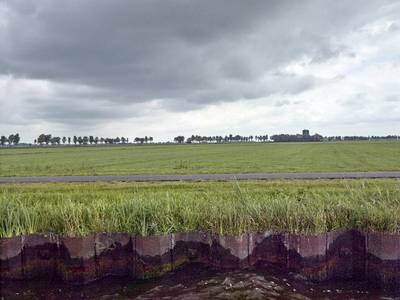
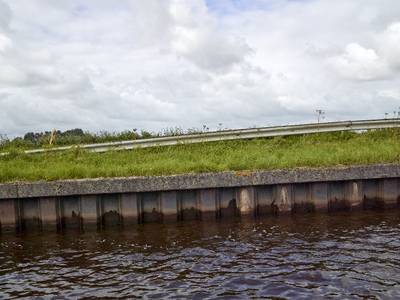
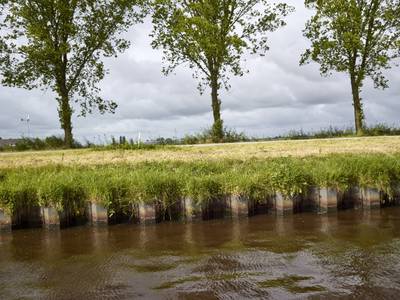
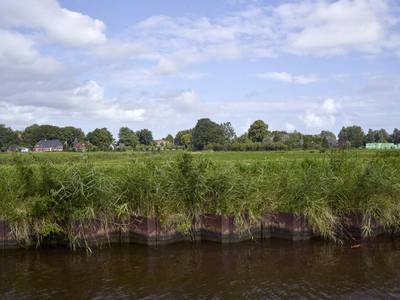
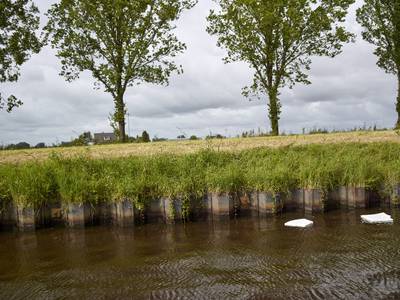
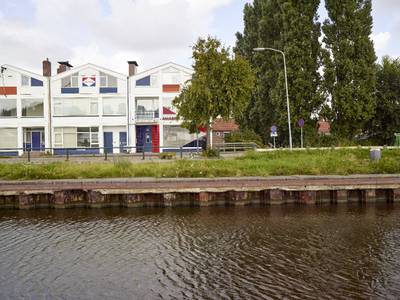
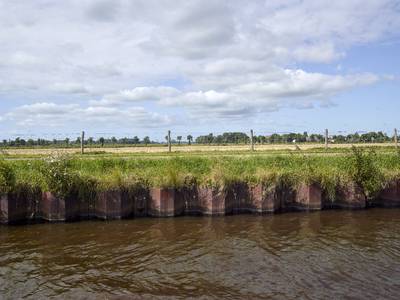
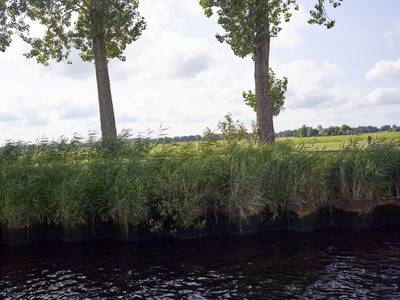
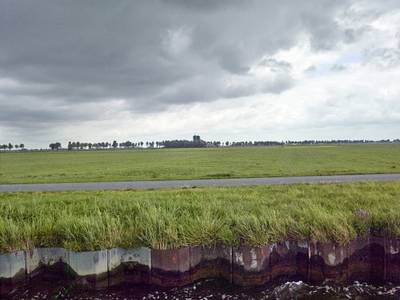
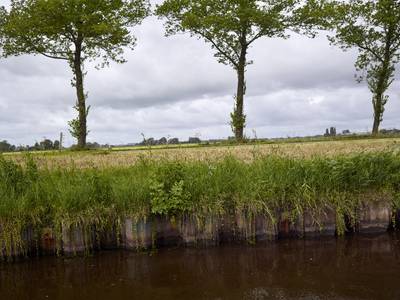
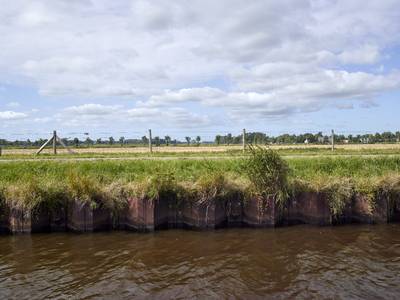
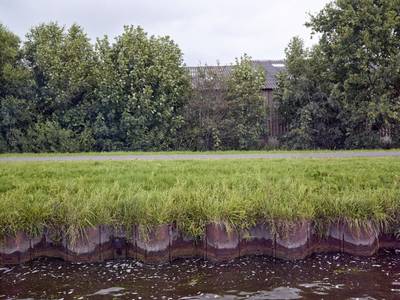
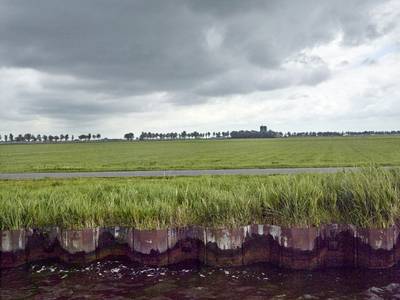
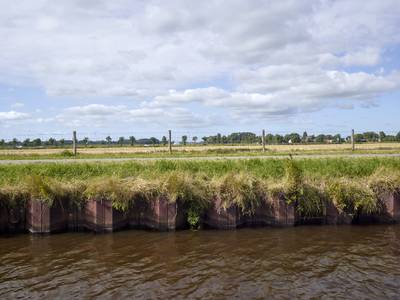
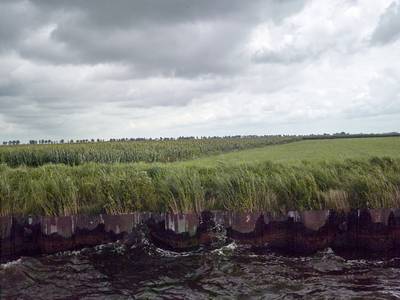
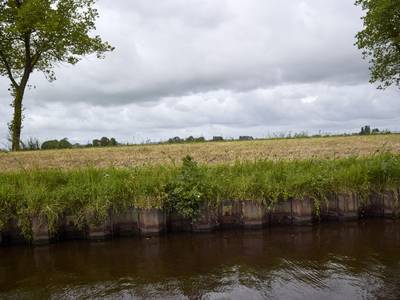
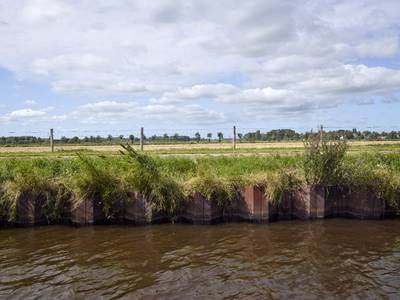
The data is part of a raw dataset from Witteveen+Bos N.V. and was remade to be used for image classification and object detection. It consists of high-resolution images of a water channel between Lemmer and Delfzijl in The Netherlands. This water channel is going to be wider and deeper so a larger class of ships can pass through. The classification datasets were made with the help of experts from Witteveen+Bos N.V. and the object detection dataset was made after they made clear which geometric information should be extracted from images.
In general, the four-class dataset has around 600 images per class and the six-class dataset has around 300 images per class. The class metal_bad, in the 6 class dataset, has around 150 images and more were not available. The object detection data contains the annotation files. The annotation file was created with LabelImg. There is a separate model test data in which inference was done. The model test set contains 100 images that have all the classes, but are all stored in a folder to simulate unlabeled images in a folder.
 Homepage
 Research Paper
Summary #
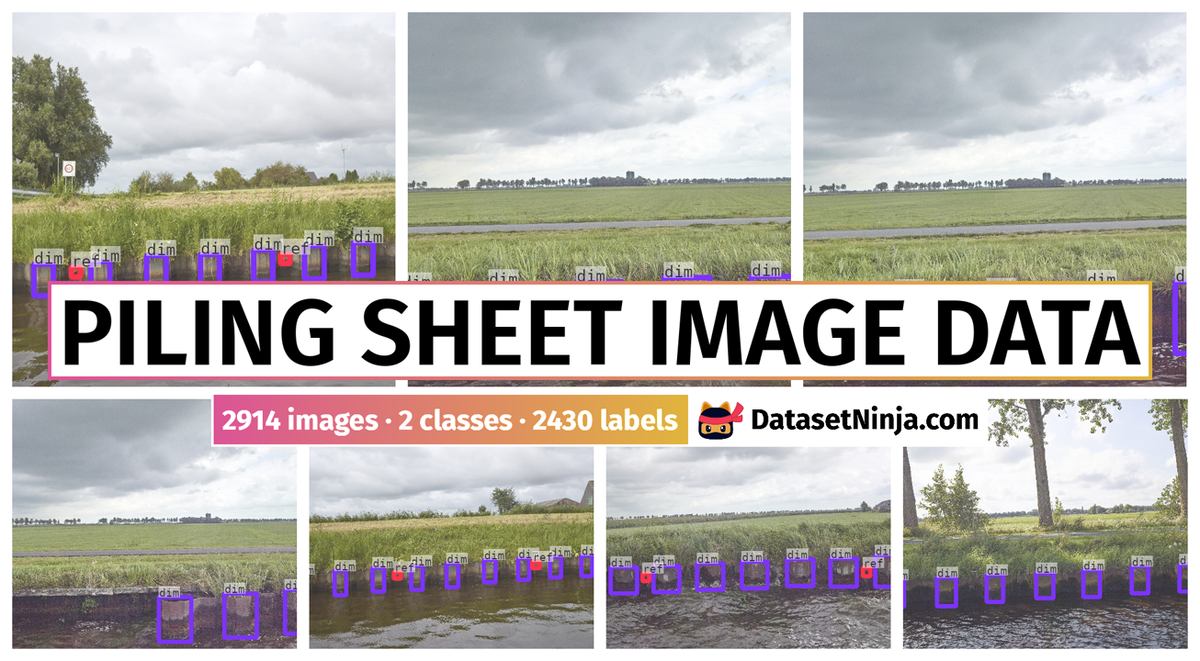
Piling Sheet Image Data 2022 is a dataset for object detection and classification tasks. Possible applications of the dataset could be in the construction industry.
The dataset consists of 2914 images with 2430 labeled objects belonging to 2 different classes including dim and ref.
Images in the Piling Sheet Image Data dataset have bounding box annotations. There are 2563 (88% of the total) unlabeled images (i.e. without annotations). There are 4 splits in the dataset: classification (2463 images), object detection train (245 images), object detection val (106 images), and test (100 images). Alternatively, the dataset could be split into 4 classification set classes: 4-rock (632 images), 4-metal_bad (619 images), 4-metal_good (608 images), and 4-grass (593 images), or into 6 classification set classes (alternative): 6-rock (344 images), 6-grass (330 images), 6-metal_good (326 images), 6-metal_moderate (311 images), 6-metal_acceptable (284 images), and 6-metal_bad (156 images). The dataset was released in 2022 by the Delft University of Technology, Netherlands and Witteveen+Bos, Netherlands.
Explore #
Piling Sheet Image Data dataset has 2914 images. Click on one of the examples below or open "Explore" tool anytime you need to view dataset images with annotations. This tool has extended visualization capabilities like zoom, translation, objects table, custom filters and more. Hover the mouse over the images to hide or show annotations.


Class balance #
There are 2 annotation classes in the dataset. Find the general statistics and balances for every class in the table below. Click any row to preview images that have labels of the selected class. Sort by column to find the most rare or prevalent classes.

Class ㅤ | Images ㅤ | Objects ㅤ | Count on image average | Area on image average |
|---|---|---|---|---|
dim➔ rectangle | 350 | 2107 | 6.02 | 5.59% |
ref➔ rectangle | 190 | 323 | 1.7 | 0.2% |
Co-occurrence matrix #
Co-occurrence matrix is an extremely valuable tool that shows you the images for every pair of classes: how many images have objects of both classes at the same time. If you click any cell, you will see those images. We added the tooltip with an explanation for every cell for your convenience, just hover the mouse over a cell to preview the description.
Images #
Explore every single image in the dataset with respect to the number of annotations of each class it has. Click a row to preview selected image. Sort by any column to find anomalies and edge cases. Use horizontal scroll if the table has many columns for a large number of classes in the dataset.
Object distribution #
Interactive heatmap chart for every class with object distribution shows how many images are in the dataset with a certain number of objects of a specific class. Users can click cell and see the list of all corresponding images.
Class sizes #
The table below gives various size properties of objects for every class. Click a row to see the image with annotations of the selected class. Sort columns to find classes with the smallest or largest objects or understand the size differences between classes.
Class | Object count | Avg area | Max area | Min area | Min height | Min height | Max height | Max height | Avg height | Avg height | Min width | Min width | Max width | Max width |
|---|---|---|---|---|---|---|---|---|---|---|---|---|---|---|
dim rectangle | 2107 | 0.93% | 2.77% | 0.17% | 51px | 5.3% | 302px | 31.36% | 126px | 13.03% | 36px | 2.81% | 193px | 15.05% |
ref rectangle | 323 | 0.12% | 1.56% | 0.05% | 24px | 2.49% | 142px | 14.75% | 38px | 3.93% | 21px | 1.64% | 136px | 10.61% |
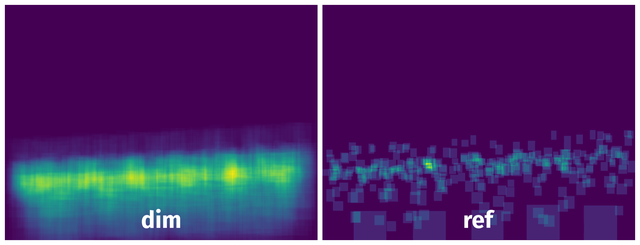
Spatial Heatmap #
The heatmaps below give the spatial distributions of all objects for every class. These visualizations provide insights into the most probable and rare object locations on the image. It helps analyze objects' placements in a dataset.
Objects #
Table contains all 2430 objects. Click a row to preview an image with annotations, and use search or pagination to navigate. Sort columns to find outliers in the dataset.
Object ID ㅤ | Class ㅤ | Image name click row to open | Image size height x width | Height ㅤ | Height ㅤ | Width ㅤ | Width ㅤ | Area ㅤ |
|---|---|---|---|---|---|---|---|---|
1➔ | dim rectangle | HighRes_11906.jpg | 963 x 1282 | 258px | 26.79% | 73px | 5.69% | 1.53% |
2➔ | dim rectangle | HighRes_11906.jpg | 963 x 1282 | 258px | 26.79% | 73px | 5.69% | 1.53% |
3➔ | dim rectangle | HighRes_11906.jpg | 963 x 1282 | 257px | 26.69% | 74px | 5.77% | 1.54% |
4➔ | dim rectangle | HighRes_11906.jpg | 963 x 1282 | 257px | 26.69% | 74px | 5.77% | 1.54% |
5➔ | dim rectangle | HighRes_11906.jpg | 963 x 1282 | 262px | 27.21% | 72px | 5.62% | 1.53% |
6➔ | dim rectangle | HighRes_11906.jpg | 963 x 1282 | 258px | 26.79% | 74px | 5.77% | 1.55% |
7➔ | dim rectangle | HighRes_11906.jpg | 963 x 1282 | 258px | 26.79% | 73px | 5.69% | 1.53% |
8➔ | ref rectangle | HighRes_11906.jpg | 963 x 1282 | 39px | 4.05% | 23px | 1.79% | 0.07% |
9➔ | dim rectangle | HighRes_00720.jpg | 963 x 1282 | 147px | 15.26% | 169px | 13.18% | 2.01% |
10➔ | dim rectangle | HighRes_00720.jpg | 963 x 1282 | 148px | 15.37% | 169px | 13.18% | 2.03% |
License #
Citation #
If you make use of the Piling Sheet Image Data data, please cite the following reference:
@article{Maskam2022,
  author = "Richie Maskam and A. (Alireza) Amiri-Simkooei and Sander van Nederveen and Mohammad Fotouhi and Maarten Visser",
  title = "{Data underlying the student thesis: Automated monitoring of corrosion on piling sheets}",
  year = "2022",
  month = "10",
  url = "https://data.4tu.nl/articles/dataset/  Data_underlying_the_student_thesis_Automated_monitoring_of_corrosion_on_piling_sheets/21387930",
  doi = "10.4121/21387930.v1"
}
If you are happy with Dataset Ninja and use provided visualizations and tools in your work, please cite us:
@misc{ visualization-tools-for-piling-sheet-image-data-dataset,
  title = { Visualization Tools for Piling Sheet Image Data Dataset },
  type = { Computer Vision Tools },
  author = { Dataset Ninja },
  howpublished = { \url{ https://datasetninja.com/piling-sheet-image-data } },
  url = { https://datasetninja.com/piling-sheet-image-data },
  journal = { Dataset Ninja },
  publisher = { Dataset Ninja },
  year = { 2026 },
  month = { jul },
  note = { visited on 2026-07-22 },
}
Download #
Dataset Piling Sheet Image Data can be downloaded in Supervisely format:
As an alternative, it can be downloaded with dataset-tools package:
pip install --upgrade dataset-tools
… using following python code:
import dataset_tools as dtools

dtools.download(dataset='Piling Sheet Image Data', dst_dir='~/dataset-ninja/')
Make sure not to overlook the python code example available on the Supervisely Developer Portal. It will give you a clear idea of how to effortlessly work with the downloaded dataset.
The data in original format can be downloaded here.
Disclaimer #
Our gal from the legal dep told us we need to post this:
Dataset Ninja provides visualizations and statistics for some datasets that can be found online and can be downloaded by general audience. Dataset Ninja is not a dataset hosting platform and can only be used for informational purposes. The platform does not claim any rights for the original content, including images, videos, annotations and descriptions. Joint publishing is prohibited.
You take full responsibility when you use datasets presented at Dataset Ninja, as well as other information, including visualizations and statistics we provide. You are in charge of compliance with any dataset license and all other permissions. You are required to navigate datasets homepage and make sure that you can use it. In case of any questions, get in touch with us at hello@datasetninja.com.