

Introduction #
The authors of the Plant Detection and Counting dataset emphasize the importance of accurately measuring agronomic traits, particularly plant density at emergence, which plays a crucial role in crop yield for plants like maize, sugar beet, and sunflower. They highlight that this trait is influenced by seeding density, emergence rate, and planting pattern, impacting plant competition and weed growth. Furthermore, the authors note that plant density assessment is valuable in both research experiments and farming decisions, despite being indirectly influenced by factors like seeding density, seed vigor, and emergence conditions. The research compares the performance of handcrafted (HC) methods, which rely on prior knowledge of planting patterns, with deep learning (DL) techniques, specifically the Faster Region with Convolutional Neural Network (Faster RCNN) model. DL methods, particularly for maize and sunflower crops, generally outperform HC methods, but performance varies due to factors like image quality, illumination, development stage, background complexity, and weed infestation. A hybrid approach (HY) combining HC and DL improves results, especially in cases of high weed infestation. Additionally, supplementing the DL training dataset with images matching testing conditions greatly enhances overall performance, with plant density estimation having a relative RMSE below 5% for all crops.
The authors utilized a dataset from maize, sugar beet, and sunflower experiments conducted between 2016 and 2019 at diverse experimental sites in France. These sites had varying agronomic conditions, conventional tillage practices, and soil types, including clay, brunisolic, and limestone, affecting surface characteristics and soil color. Each site had multiple microplots representing different genotypes, with 3 to 12 microplots selected to yield around 600 plants. Some sites were surveyed multiple times, providing a broader range of crop development stages during image acquisition. For maize, the authors had 51 microplots from 9 acquisition sessions with varying microplot size, row spacing (0.3-1.1 m), and plant density (5.1-11.2 plant/m²). Sugar beet had 60 microplots from 9 sessions with minor variations in microplot attributes, while sunflower featured 78 microplots from 9 sessions with substantial variability in microplot characteristics.
The authors employed Unmanned Aerial Vehicles (UAVs) equipped with three different RGB cameras: the Sony Alpha 5100 and Sony Alpha 6000, both with a resolution of 6024×4024 pixels, and the Zenmuse X7 (DJI) for the Epoisses site in 2019, with a resolution of 6016 x 4008 pixels. These cameras were stabilized on a two-axis gimbal to maintain a nadir view during flight and were set to a speed priority of 1/1250 s to reduce motion blur. Aperture and ISO settings were automatically adjusted, and the cameras were triggered at a 1Hz interval to capture RGB images in JPG format. Flight altitudes varied between 20 to 50 meters to achieve a ground sampling distance (GSD) ranging from 2 mm to 5 mm per pixel. The flight trajectory was planned to ensure more than 70% overlap between images along both lateral and longitudinal tracks. Ground control points were strategically placed in the field and their coordinates were measured using real-time kinematic GPS, ensuring centimeter-level accuracy in positioning.
The authors utilized Agisoft Photoscan Professional software for image alignment and employed a structure from motion algorithm to determine camera positions and orientations. They followed a pipeline described by Jin et al. to extract microplot portions from each image, using a georeferenced plot map to avoid distortions seen in orthomosaics. The sharpest extract containing the entire microplot was selected for labeling, with around 600 plants labeled per session, resulting in a total of 16,247 labeled plants. Images were rescaled to a consistent GSD of 2.5 mm, and labeling was performed using the coco-annotator tool, involving six different operators with a review process. The plant development stage, weed infestation level, and image blurriness were also assessed for each session.
 Homepage
 Research Paper
Summary #
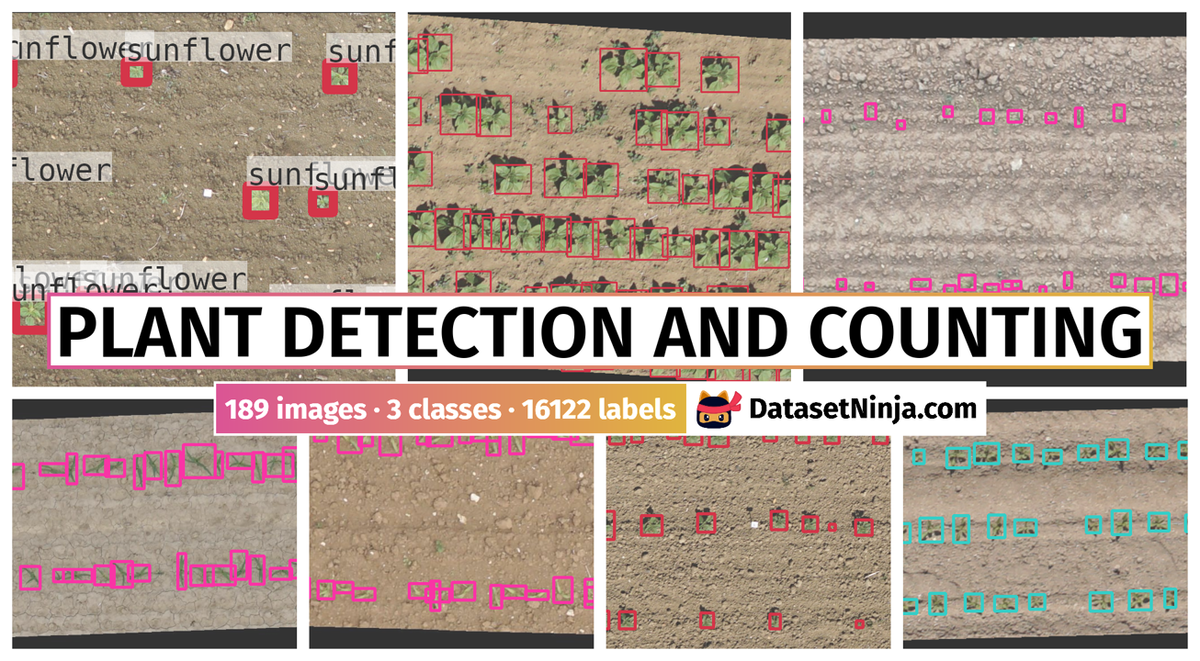
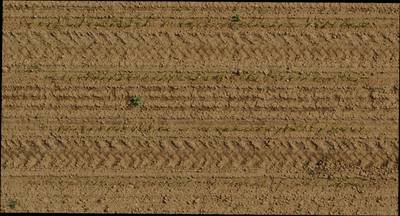
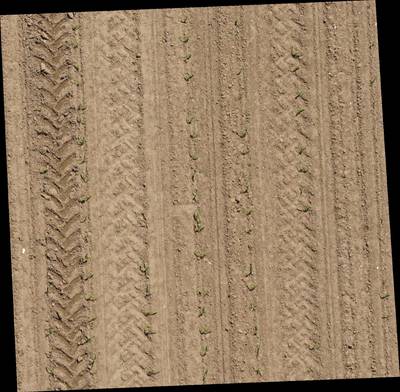
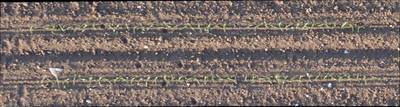
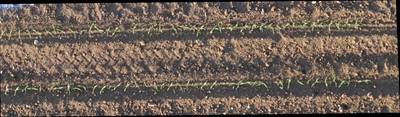
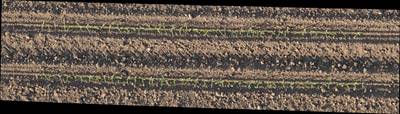
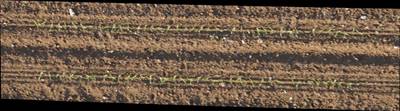
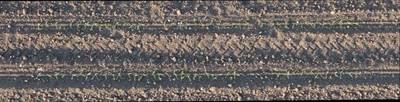
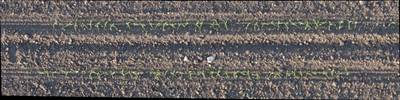
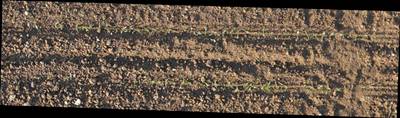
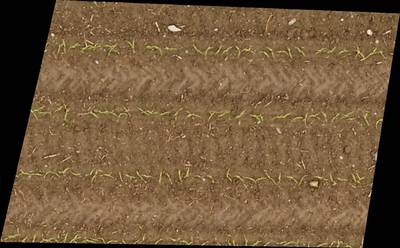
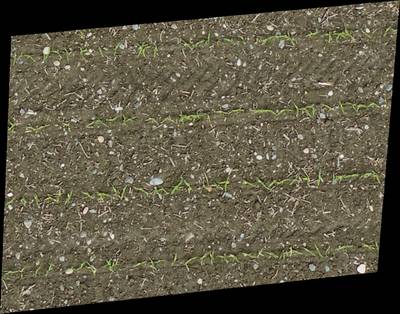
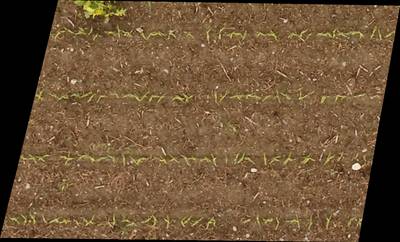
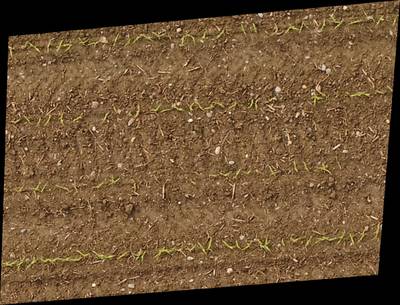
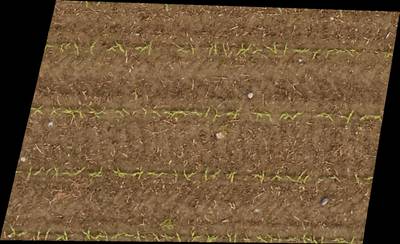
Plant Detection and Counting from High-resolution Rgb Images Acquired from UAVs is a dataset for an object detection task. It is used in the agricultural industry.
The dataset consists of 189 images with 16122 labeled objects belonging to 3 different classes including sunflower, sugarbeet, and maize.
Images in the Plant Detection and Counting dataset have bounding box annotations. All images are labeled (i.e. with annotations). There are no pre-defined train/val/test splits in the dataset. The dataset was released in 2021 by the INRAe, France, Arvalis, France, ITB, France, and Hiphen, France.
Explore #
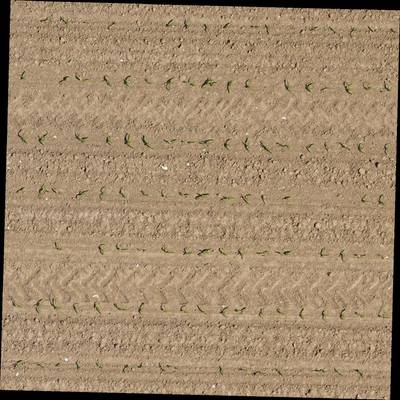
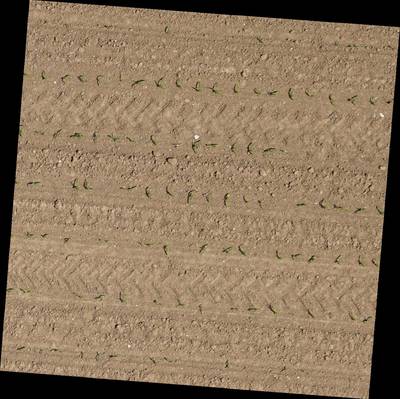
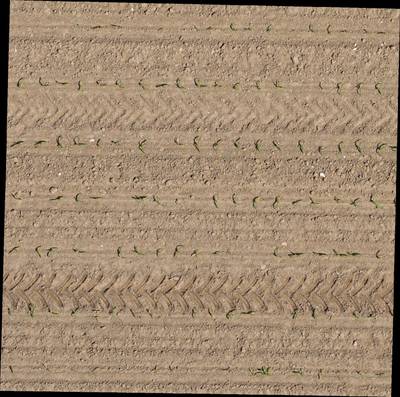
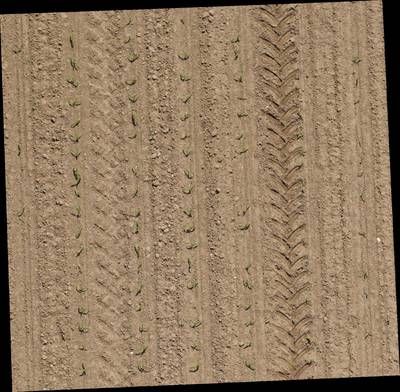
Plant Detection and Counting dataset has 189 images. Click on one of the examples below or open "Explore" tool anytime you need to view dataset images with annotations. This tool has extended visualization capabilities like zoom, translation, objects table, custom filters and more. Hover the mouse over the images to hide or show annotations.


Class balance #
There are 3 annotation classes in the dataset. Find the general statistics and balances for every class in the table below. Click any row to preview images that have labels of the selected class. Sort by column to find the most rare or prevalent classes.

Class ㅤ | Images ㅤ | Objects ㅤ | Count on image average | Area on image average |
|---|---|---|---|---|
sunflower➔ rectangle | 78 | 5218 | 66.9 | 13.35% |
sugarbeet➔ rectangle | 60 | 5647 | 94.12 | 19.36% |
maize➔ rectangle | 51 | 5257 | 103.08 | 9.84% |
Co-occurrence matrix #
Co-occurrence matrix is an extremely valuable tool that shows you the images for every pair of classes: how many images have objects of both classes at the same time. If you click any cell, you will see those images. We added the tooltip with an explanation for every cell for your convenience, just hover the mouse over a cell to preview the description.
Images #
Explore every single image in the dataset with respect to the number of annotations of each class it has. Click a row to preview selected image. Sort by any column to find anomalies and edge cases. Use horizontal scroll if the table has many columns for a large number of classes in the dataset.
Class sizes #
The table below gives various size properties of objects for every class. Click a row to see the image with annotations of the selected class. Sort columns to find classes with the smallest or largest objects or understand the size differences between classes.
Class | Object count | Avg area | Max area | Min area | Min height | Min height | Max height | Max height | Avg height | Avg height | Min width | Min width | Max width | Max width |
|---|---|---|---|---|---|---|---|---|---|---|---|---|---|---|
sugarbeet rectangle | 5647 | 0.22% | 1.15% | 0.01% | 17px | 1.85% | 373px | 44.99% | 64px | 8.27% | 16px | 0.56% | 143px | 6% |
maize rectangle | 5257 | 0.1% | 0.7% | 0% | 7px | 0.41% | 156px | 26.93% | 49px | 6.03% | 8px | 0.27% | 155px | 6.89% |
sunflower rectangle | 5218 | 0.21% | 1.46% | 0% | 10px | 0.85% | 260px | 22.36% | 82px | 7.12% | 10px | 0.29% | 280px | 10.36% |
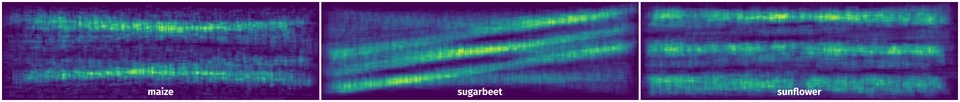
Spatial Heatmap #
The heatmaps below give the spatial distributions of all objects for every class. These visualizations provide insights into the most probable and rare object locations on the image. It helps analyze objects' placements in a dataset.
Objects #
Table contains all 16122 objects. Click a row to preview an image with annotations, and use search or pagination to navigate. Sort columns to find outliers in the dataset.
Object ID ㅤ | Class ㅤ | Image name click row to open | Image size height x width | Height ㅤ | Height ㅤ | Width ㅤ | Width ㅤ | Area ㅤ |
|---|---|---|---|---|---|---|---|---|
1➔ | sunflower rectangle | DSC01549.png | 1074 x 4166 | 134px | 12.48% | 126px | 3.02% | 0.38% |
2➔ | sunflower rectangle | DSC01549.png | 1074 x 4166 | 82px | 7.64% | 74px | 1.78% | 0.14% |
3➔ | sunflower rectangle | DSC01549.png | 1074 x 4166 | 119px | 11.08% | 106px | 2.54% | 0.28% |
4➔ | sunflower rectangle | DSC01549.png | 1074 x 4166 | 151px | 14.06% | 142px | 3.41% | 0.48% |
5➔ | sunflower rectangle | DSC01549.png | 1074 x 4166 | 56px | 5.21% | 46px | 1.1% | 0.06% |
6➔ | sunflower rectangle | DSC01549.png | 1074 x 4166 | 114px | 10.61% | 140px | 3.36% | 0.36% |
7➔ | sunflower rectangle | DSC01549.png | 1074 x 4166 | 171px | 15.92% | 147px | 3.53% | 0.56% |
8➔ | sunflower rectangle | DSC01549.png | 1074 x 4166 | 211px | 19.65% | 170px | 4.08% | 0.8% |
9➔ | sunflower rectangle | DSC01549.png | 1074 x 4166 | 163px | 15.18% | 94px | 2.26% | 0.34% |
10➔ | sunflower rectangle | DSC01549.png | 1074 x 4166 | 205px | 19.09% | 219px | 5.26% | 1% |
License #
Plant detection and counting from high-resolution RGB images acquired from UAVs is under CC BY 4.0 license.
Citation #
If you make use of the Plant Detection and Counting data, please cite the following reference:
@misc{david_etienne_2021_4890370,
  author       = {DAVID, Etienne},
  title        = {{Plant detection and counting from high-resolution
                   RGB images acquired from UAVs: comparison between
                   deep-learning and handcrafted methods with
                   application to maize, sugar beet, and sunflower
                   crops}},
  month        = jun,
  year         = 2021,
  publisher    = {Zenodo},
  version      = 1,
  doi          = {10.1101/2021.04.27.441631},
  url          = {https://doi.org/10.1101/2021.04.27.441631}
}
If you are happy with Dataset Ninja and use provided visualizations and tools in your work, please cite us:
@misc{ visualization-tools-for-plant-detection-and-counting-dataset,
  title = { Visualization Tools for Plant Detection and Counting Dataset },
  type = { Computer Vision Tools },
  author = { Dataset Ninja },
  howpublished = { \url{ https://datasetninja.com/plant-detection-and-counting } },
  url = { https://datasetninja.com/plant-detection-and-counting },
  journal = { Dataset Ninja },
  publisher = { Dataset Ninja },
  year = { 2026 },
  month = { jul },
  note = { visited on 2026-07-16 },
}
Download #
Dataset Plant Detection and Counting can be downloaded in Supervisely format:
As an alternative, it can be downloaded with dataset-tools package:
pip install --upgrade dataset-tools
… using following python code:
import dataset_tools as dtools

dtools.download(dataset='Plant Detection and Counting', dst_dir='~/dataset-ninja/')
Make sure not to overlook the python code example available on the Supervisely Developer Portal. It will give you a clear idea of how to effortlessly work with the downloaded dataset.
The data in original format can be downloaded here.
Disclaimer #
Our gal from the legal dep told us we need to post this:
Dataset Ninja provides visualizations and statistics for some datasets that can be found online and can be downloaded by general audience. Dataset Ninja is not a dataset hosting platform and can only be used for informational purposes. The platform does not claim any rights for the original content, including images, videos, annotations and descriptions. Joint publishing is prohibited.
You take full responsibility when you use datasets presented at Dataset Ninja, as well as other information, including visualizations and statistics we provide. You are in charge of compliance with any dataset license and all other permissions. You are required to navigate datasets homepage and make sure that you can use it. In case of any questions, get in touch with us at hello@datasetninja.com.