

Introduction #
The authors of the PlantDoc: A Dataset for Visual Plant Disease Detection recognized the importance of training models with real-life images to account for the complexities of the real world. In light of this, they decided to create a dataset for accurate plant disease detection in the farm setting by downloading images from Google Images and Ecosia. Collecting large-scale plant disease data through fieldwork would have required significant effort, so they gathered approximately 20,900 images making the final dataset having a total of 27 classes spanning over 13 species with 2,598 images. Numbers in the claimed and the actual dataset differ.
To ensure the quality and relevance of the collected images, four users filtered the images based on their metadata from the websites and guidelines provided on APSNet. The American Phytopathological Society (APS) had compiled a list of peer-reviewed literature corresponding to each plant disease, which the authors referred to in their classification process. Several important factors, such as colour, area, and density of the diseased part, as well as the shape of the species, were considered during the classification process. Inappropriate and duplicate images across classes were removed from the downloaded dataset.
To reduce labeling errors, every image was checked by two individuals following the guidelines. To ensure sufficient training samples, classes with less than 50 images were removed, resulting in a final dataset with 27 classes spanning over 13 species, comprising 2,598 images. Note, that this number of images (taken from the research paper) slightly differs from the actual one on the DatasetNinja (2482 images).
For the object detection task, which required exact bounding regions containing the leaf in each image, the authors used the LabelImg tool to create bounding boxes around the leaves. In cases where the image contained multiple leaves or a combination of diseased and healthy leaves, all the leaves were labeled explicitly with their respective classes. The authors took care to ensure that the entire leaf was encompassed within the bounding box, and that the area of the bounding box was not smaller than approximately 1/8th of the image size. After labeling, the information about the coordinates of the boxes and their respective class labels was stored separately in an XML file corresponding to each image.
 Homepage
 Research Paper
Summary #
PlantDoc: A Dataset for Visual Plant Disease Detection is a dataset for an object detection task. It is used in the agricultural research.
The dataset consists of 2482 images with 8595 labeled objects belonging to 29 different classes including Corn leaf blight, Tomato Septoria leaf spot, Squash Powdery mildew leaf, and other: Raspberry leaf, Potato leaf early blight, Corn rust leaf, Tomato leaf late blight, Peach leaf, Blueberry leaf, Tomato leaf bacterial spot, Potato leaf late blight, Strawberry leaf, Apple Scab Leaf, Apple leaf, Apple rust leaf, Tomato Early blight leaf, Tomato mold leaf, Tomato leaf yellow virus, Tomato leaf, grape leaf, Corn Gray leaf spot, Bell_pepper leaf spot, Soyabean leaf, grape leaf black rot, Bell_pepper leaf, Cherry leaf, Tomato leaf mosaic virus, Potato leaf, and Tomato two spotted spider mites leaf.
Images in the PlantDoc dataset have bounding box annotations. All images are labeled (i.e. with annotations). There are 2 splits in the dataset: train (2251 images) and test (231 images). The dataset was released in 2019 by the Indian Institute of Technology Gandhinagar.
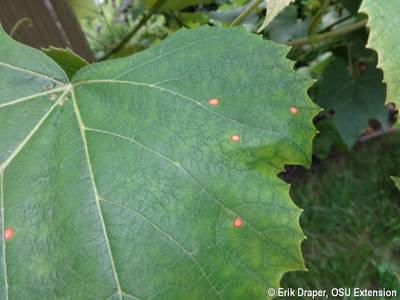
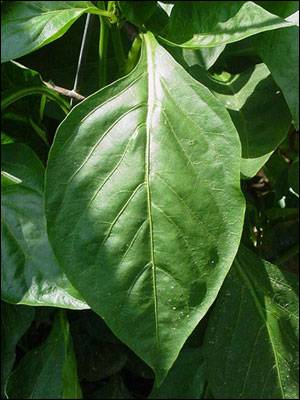
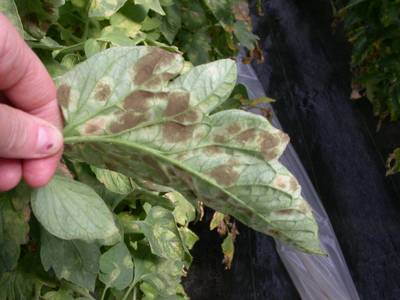
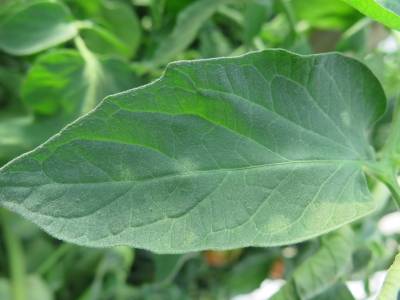
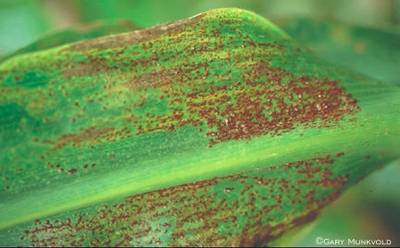
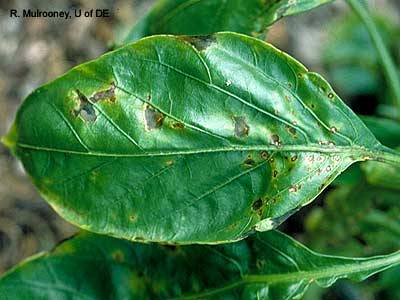
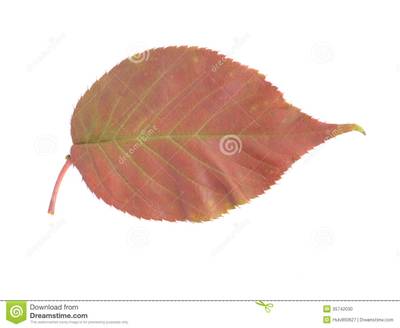
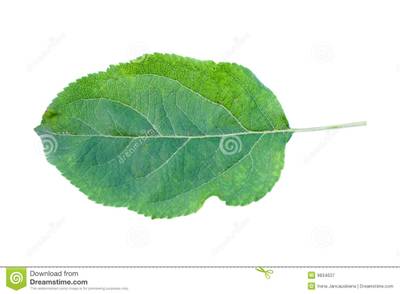
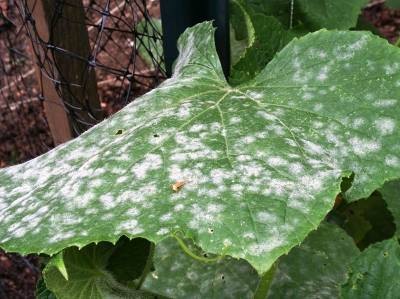
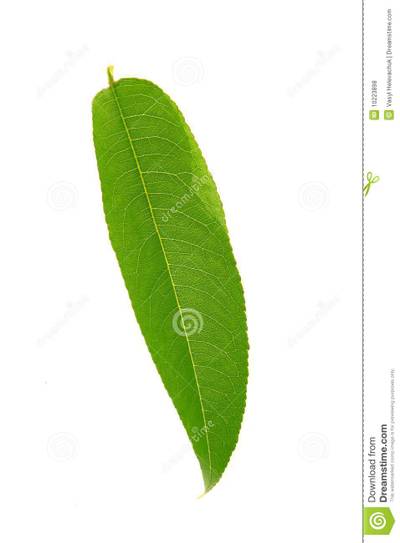
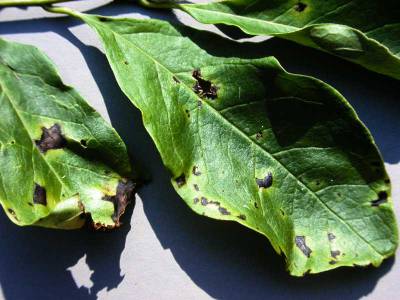
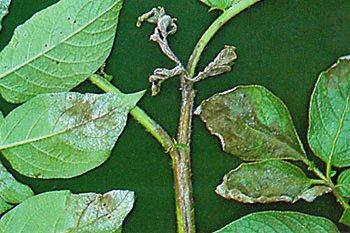
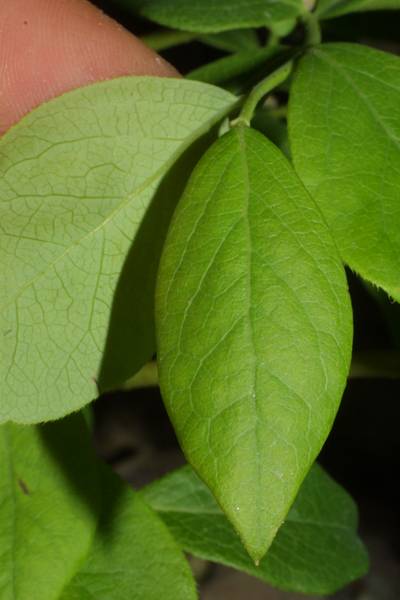
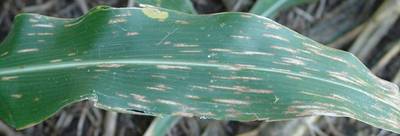
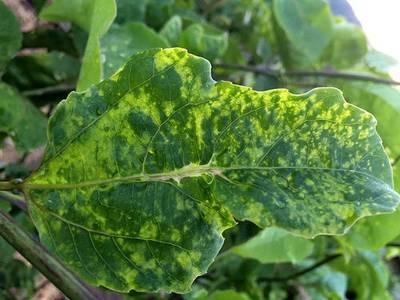
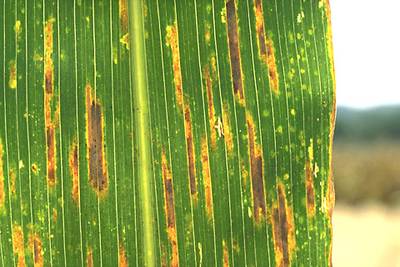
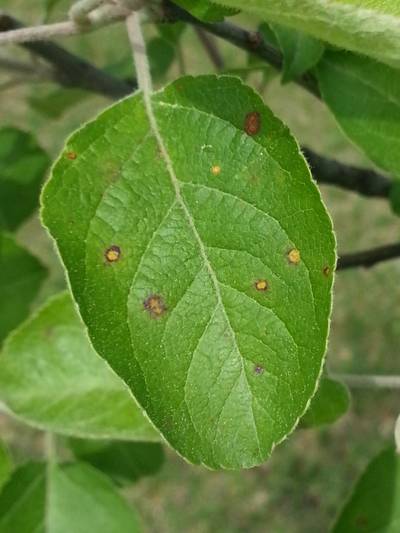
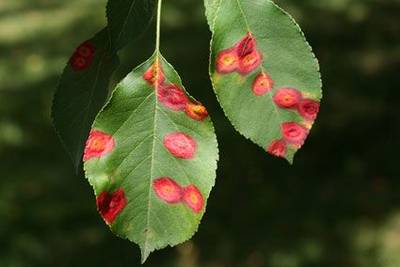
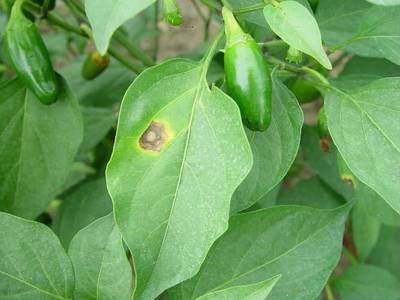
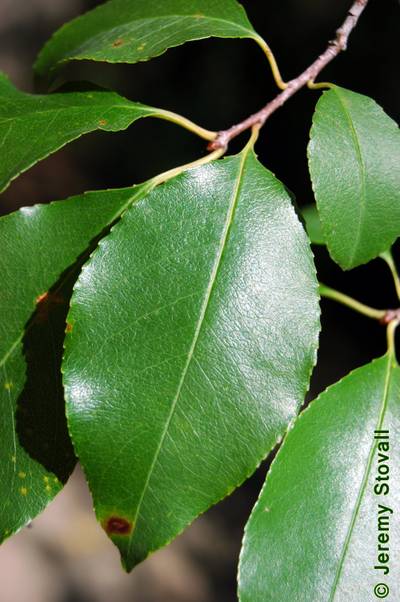
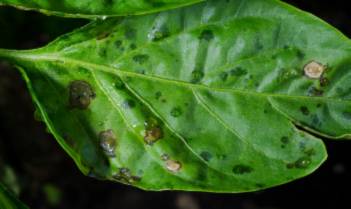
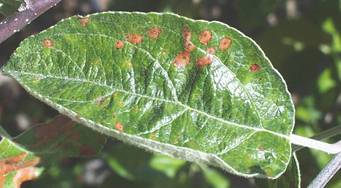
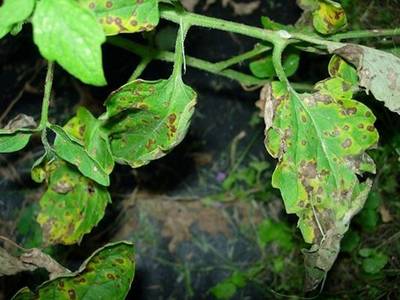
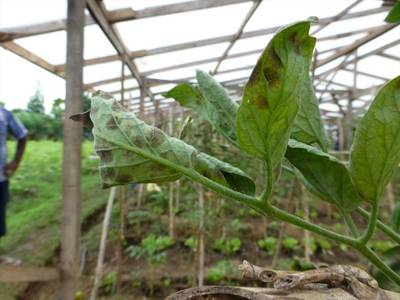
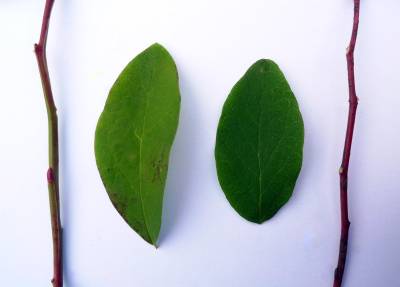
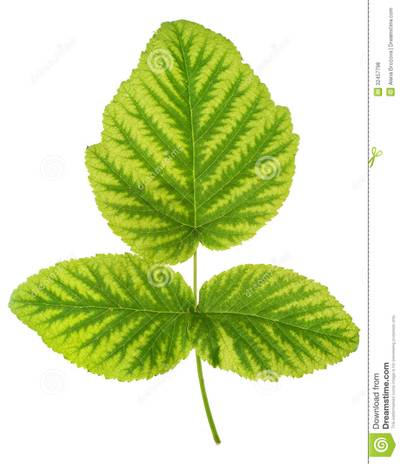
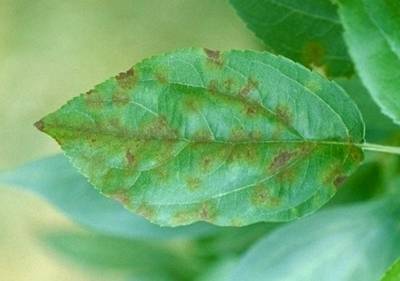
Here is a visualized example for randomly selected sample classes:
Explore #
PlantDoc dataset has 2482 images. Click on one of the examples below or open "Explore" tool anytime you need to view dataset images with annotations. This tool has extended visualization capabilities like zoom, translation, objects table, custom filters and more. Hover the mouse over the images to hide or show annotations.


Class balance #
There are 29 annotation classes in the dataset. Find the general statistics and balances for every class in the table below. Click any row to preview images that have labels of the selected class. Sort by column to find the most rare or prevalent classes.

Class ㅤ | Images ㅤ | Objects ㅤ | Count on image average | Area on image average |
|---|---|---|---|---|
Corn leaf blight➔ rectangle | 186 | 357 | 1.92 | 67.51% |
Tomato Septoria leaf spot➔ rectangle | 148 | 415 | 2.8 | 53.39% |
Squash Powdery mildew leaf➔ rectangle | 128 | 250 | 1.95 | 68.57% |
Raspberry leaf➔ rectangle | 118 | 553 | 4.69 | 40.47% |
Potato leaf early blight➔ rectangle | 114 | 321 | 2.82 | 57.51% |
Corn rust leaf➔ rectangle | 112 | 123 | 1.1 | 77.88% |
Tomato leaf late blight➔ rectangle | 111 | 220 | 1.98 | 58.87% |
Peach leaf➔ rectangle | 110 | 608 | 5.53 | 33.98% |
Blueberry leaf➔ rectangle | 110 | 777 | 7.06 | 41.41% |
Tomato leaf bacterial spot➔ rectangle | 108 | 260 | 2.41 | 52.13% |
Co-occurrence matrix #
Co-occurrence matrix is an extremely valuable tool that shows you the images for every pair of classes: how many images have objects of both classes at the same time. If you click any cell, you will see those images. We added the tooltip with an explanation for every cell for your convenience, just hover the mouse over a cell to preview the description.
Images #
Explore every single image in the dataset with respect to the number of annotations of each class it has. Click a row to preview selected image. Sort by any column to find anomalies and edge cases. Use horizontal scroll if the table has many columns for a large number of classes in the dataset.
Object distribution #
Interactive heatmap chart for every class with object distribution shows how many images are in the dataset with a certain number of objects of a specific class. Users can click cell and see the list of all corresponding images.
Class sizes #
The table below gives various size properties of objects for every class. Click a row to see the image with annotations of the selected class. Sort columns to find classes with the smallest or largest objects or understand the size differences between classes.
Class | Object count | Avg area | Max area | Min area | Min height | Min height | Max height | Max height | Avg height | Avg height | Min width | Min width | Max width | Max width |
|---|---|---|---|---|---|---|---|---|---|---|---|---|---|---|
Tomato leaf yellow virus rectangle | 818 | 2.45% | 18.61% | 0.06% | 14px | 2.25% | 1315px | 63.13% | 121px | 15.66% | 11px | 1.07% | 1237px | 78.26% |
Blueberry leaf rectangle | 777 | 6.38% | 86.63% | 0.28% | 34px | 6.54% | 1681px | 97.34% | 264px | 24.73% | 43px | 3.72% | 1889px | 94.4% |
Peach leaf rectangle | 608 | 7.07% | 69.05% | 0.23% | 15px | 3% | 2908px | 99.87% | 340px | 27.41% | 19px | 3.03% | 1724px | 92.46% |
Raspberry leaf rectangle | 553 | 9.28% | 98.65% | 0.54% | 41px | 6.17% | 2490px | 99.33% | 306px | 29.87% | 47px | 4.79% | 3422px | 99.92% |
Strawberry leaf rectangle | 470 | 10.1% | 72.02% | 0.67% | 55px | 6.83% | 1673px | 98.08% | 356px | 32.06% | 52px | 6.02% | 1929px | 97.36% |
Tomato Septoria leaf spot rectangle | 415 | 19.96% | 97.35% | 0.95% | 31px | 8.81% | 1557px | 99.26% | 316px | 43.57% | 17px | 7.05% | 2475px | 99.33% |
Tomato leaf rectangle | 391 | 6.31% | 95.21% | 0.41% | 24px | 4.63% | 2345px | 97.9% | 311px | 23.72% | 24px | 2.97% | 2591px | 99.96% |
Corn leaf blight rectangle | 357 | 37.07% | 96.61% | 0.15% | 3px | 1.05% | 5129px | 99.93% | 509px | 62.87% | 43px | 5.4% | 4588px | 99.95% |
Potato leaf early blight rectangle | 321 | 21.23% | 99.49% | 0.3% | 30px | 4.63% | 2334px | 99.83% | 308px | 43.3% | 26px | 4.11% | 2999px | 99.89% |
Bell_pepper leaf rectangle | 315 | 7.83% | 66.19% | 0.59% | 41px | 6.47% | 1774px | 91.07% | 246px | 26.93% | 46px | 4.49% | 1495px | 86.19% |
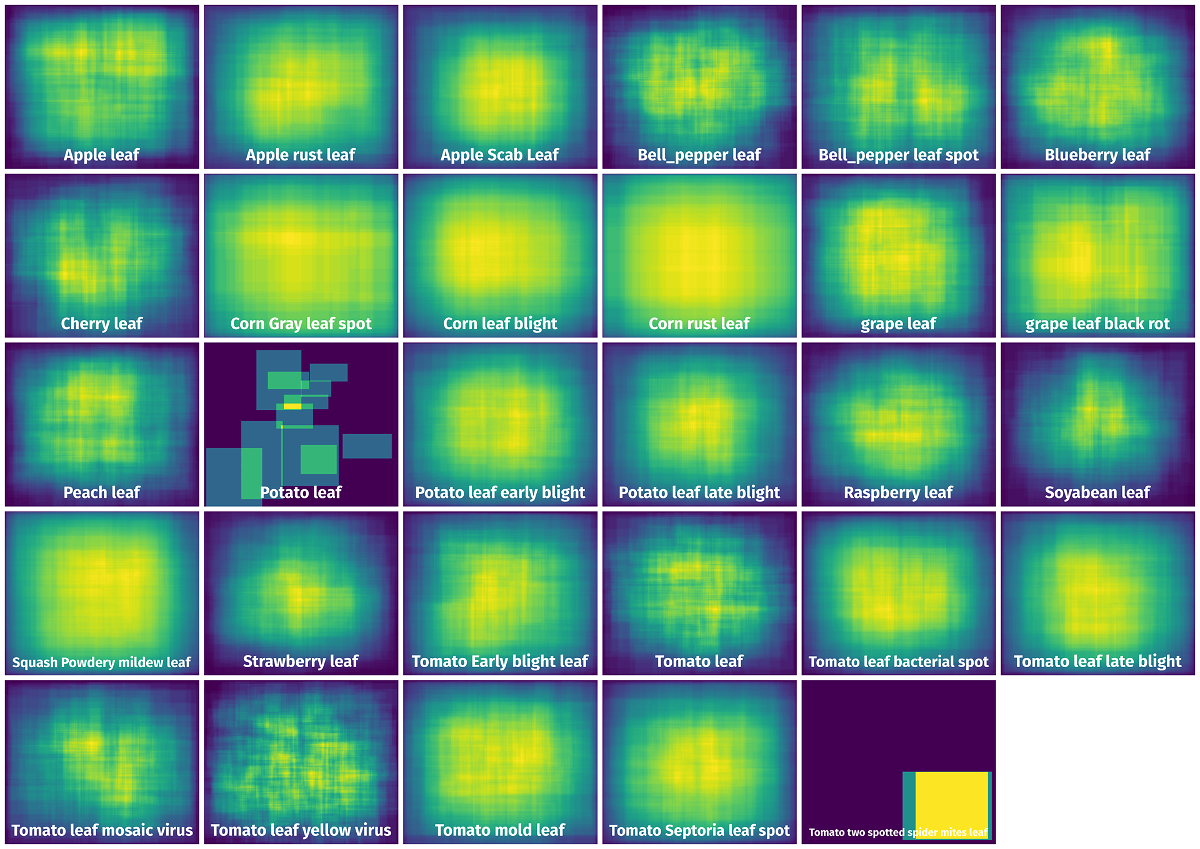
Spatial Heatmap #
The heatmaps below give the spatial distributions of all objects for every class. These visualizations provide insights into the most probable and rare object locations on the image. It helps analyze objects' placements in a dataset.
Objects #
Table contains all 8595 objects. Click a row to preview an image with annotations, and use search or pagination to navigate. Sort columns to find outliers in the dataset.
Object ID ㅤ | Class ㅤ | Image name click row to open | Image size height x width | Height ㅤ | Height ㅤ | Width ㅤ | Width ㅤ | Area ㅤ |
|---|---|---|---|---|---|---|---|---|
1➔ | Tomato Septoria leaf spot rectangle | 7-17-Photo3_Septoria-MARY.jpg | 359 x 450 | 120px | 33.43% | 50px | 11.11% | 3.71% |
2➔ | Tomato Septoria leaf spot rectangle | 7-17-Photo3_Septoria-MARY.jpg | 359 x 450 | 279px | 77.72% | 92px | 20.44% | 15.89% |
3➔ | Tomato Septoria leaf spot rectangle | 7-17-Photo3_Septoria-MARY.jpg | 359 x 450 | 156px | 43.45% | 61px | 13.56% | 5.89% |
4➔ | Tomato Septoria leaf spot rectangle | 7-17-Photo3_Septoria-MARY.jpg | 359 x 450 | 309px | 86.07% | 210px | 46.67% | 40.17% |
5➔ | Apple Scab Leaf rectangle | 816.jpg | 275 x 330 | 192px | 69.82% | 113px | 34.24% | 23.91% |
6➔ | Apple Scab Leaf rectangle | 816.jpg | 275 x 330 | 189px | 68.73% | 104px | 31.52% | 21.66% |
7➔ | Tomato Early blight leaf rectangle | tomato_early-blight_01_zoom.jpg | 378 x 257 | 196px | 51.85% | 105px | 40.86% | 21.18% |
8➔ | Tomato Early blight leaf rectangle | tomato_early-blight_01_zoom.jpg | 378 x 257 | 195px | 51.59% | 84px | 32.68% | 16.86% |
9➔ | Tomato Early blight leaf rectangle | tomato_early-blight_01_zoom.jpg | 378 x 257 | 176px | 46.56% | 100px | 38.91% | 18.12% |
10➔ | grape leaf black rot rectangle | 03gb.jpg | 302 x 479 | 269px | 89.07% | 295px | 61.59% | 54.86% |
License #
Citation #
If you make use of the PlantDOC data, please cite the following reference:
@inproceedings{10.1145/3371158.3371196,
  author = {Singh, Davinder and Jain, Naman and Jain, Pranjali and Kayal, Pratik and Kumawat, Sudhakar and Batra, Nipun},
  title = {PlantDoc: A Dataset for Visual Plant Disease Detection},
  year = {2020},
  isbn = {9781450377386},
  publisher = {Association for Computing Machinery},
  address = {New York, NY, USA},
  url = {https://doi.org/10.1145/3371158.3371196},
  doi = {10.1145/3371158.3371196},
  booktitle = {Proceedings of the 7th ACM IKDD CoDS and 25th COMAD},
  pages = {249–253},
  numpages = {5},
  keywords = {Deep Learning, Object Detection, Image Classification},
  location = {Hyderabad, India},
  series = {CoDS COMAD 2020}
}
If you are happy with Dataset Ninja and use provided visualizations and tools in your work, please cite us:
@misc{ visualization-tools-for-plantdoc-dataset,
  title = { Visualization Tools for PlantDoc Dataset },
  type = { Computer Vision Tools },
  author = { Dataset Ninja },
  howpublished = { \url{ https://datasetninja.com/plantdoc } },
  url = { https://datasetninja.com/plantdoc },
  journal = { Dataset Ninja },
  publisher = { Dataset Ninja },
  year = { 2026 },
  month = { jul },
  note = { visited on 2026-07-15 },
}
Download #
Dataset PlantDoc can be downloaded in Supervisely format:
As an alternative, it can be downloaded with dataset-tools package:
pip install --upgrade dataset-tools
… using following python code:
import dataset_tools as dtools

dtools.download(dataset='PlantDoc', dst_dir='~/dataset-ninja/')
Make sure not to overlook the python code example available on the Supervisely Developer Portal. It will give you a clear idea of how to effortlessly work with the downloaded dataset.
The data in original format can be downloaded here.
Disclaimer #
Our gal from the legal dep told us we need to post this:
Dataset Ninja provides visualizations and statistics for some datasets that can be found online and can be downloaded by general audience. Dataset Ninja is not a dataset hosting platform and can only be used for informational purposes. The platform does not claim any rights for the original content, including images, videos, annotations and descriptions. Joint publishing is prohibited.
You take full responsibility when you use datasets presented at Dataset Ninja, as well as other information, including visualizations and statistics we provide. You are in charge of compliance with any dataset license and all other permissions. You are required to navigate datasets homepage and make sure that you can use it. In case of any questions, get in touch with us at hello@datasetninja.com.