Introduction #
The authors of the PLD-UAV: Power Line Detection in UAV dataset emphasize the significance of power line detection within an automated UAV-based electricity inspection system. This detection is pivotal for real-time motion planning and navigation along power lines. They address the limitations of previous methods, often reliant on traditional filters and gradients, which may falter in accurately capturing power lines amidst noisy backgrounds. To tackle this challenge, the authors have devised a precise power line detection approach leveraging convolutional and structured features. Initially, a convolutional neural network is employed to generate hierarchical responses from each layer. This method harnesses multiscale and structured prior information to execute both accurate and efficient detection.
The context of power line detection is underscored by its vital role in inspecting and maintaining power lines, crucial for ensuring their reliability and safety. Traditional inspection methods, often involving skilled linemen, are not only time-consuming but also perilous. Consequently, the development of an automated UAV-based inspection system bears the potential to save time, money, and mitigate dangerous incidents. Among the core modules of this system, power line detection stands out as pivotal, aiding in autonomous navigation by accurately identifying and locating power lines.
| Dataset | Train | Test | Size | maxDist |
|---|---|---|---|---|
| PLDU | 453 | 120 | 540X360 | 0.0075 |
| PLDM | 237 | 50 | 540X360 | 0.0075 |
maxDist is a maximal tolerance for edge localization in evaluation.
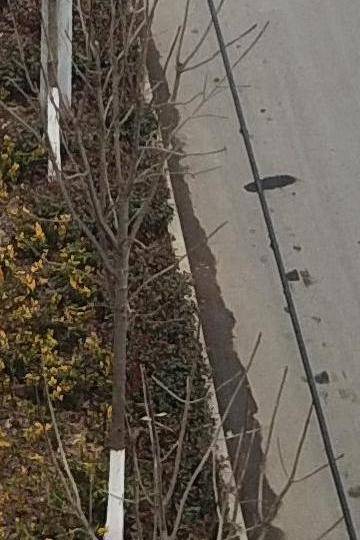
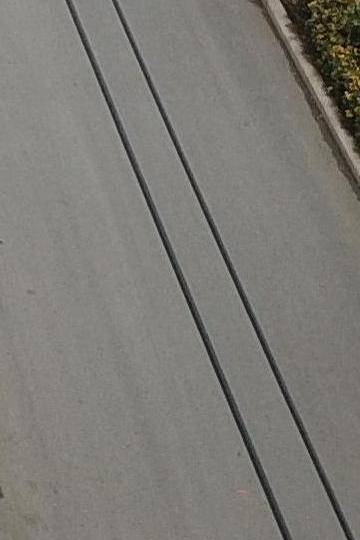
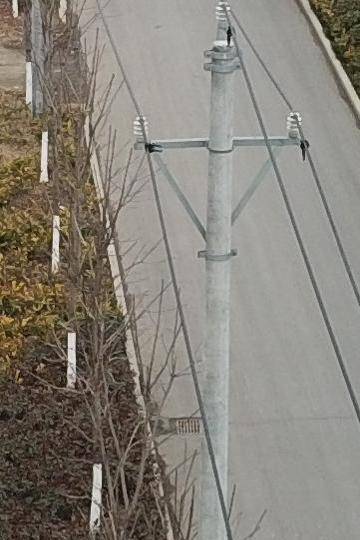
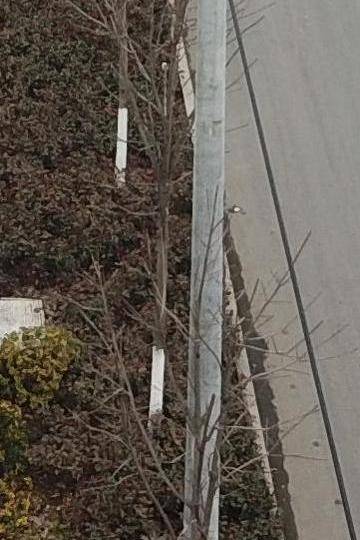
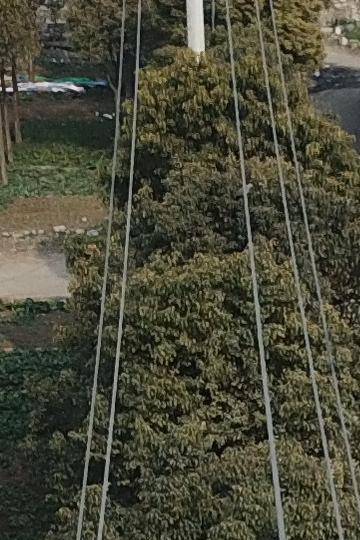
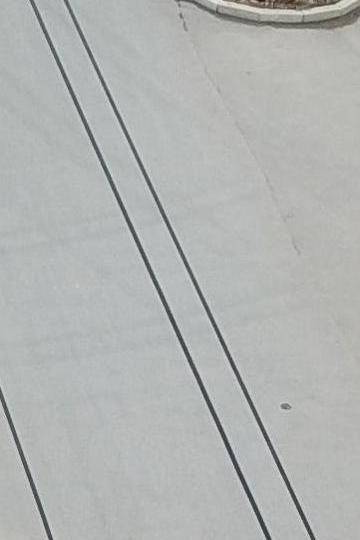
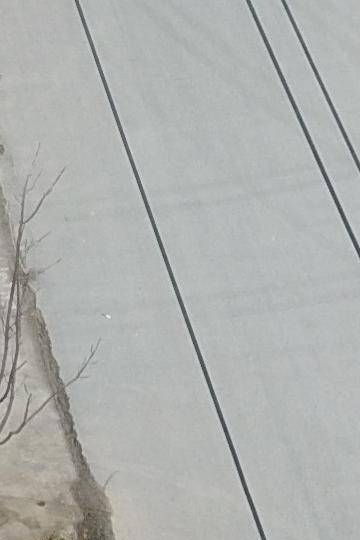
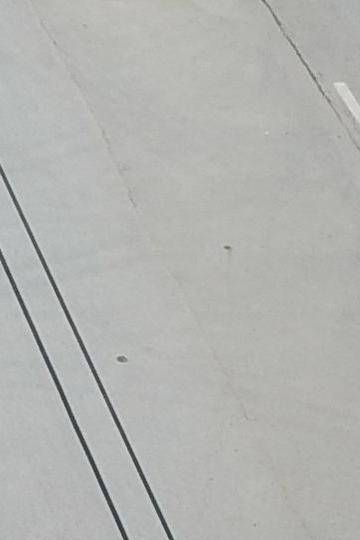
The paucity of large public datasets with pixel-wise annotations has hindered the development of learning-based methods for power line detection. Previous methods often built upon traditional edge detectors and were evaluated on a limited number of images. Learning-based approaches struggled due to the lack of well-annotated datasets for training and testing. In an effort to address this issue, the authors have contributed by releasing two power line detection datasets: the Power Line Dataset of Urban Scenes (PLDU) and the Power Line Dataset of Mountain Scenes (PLDM). These datasets feature diverse sample images, as shown in Figures 4 and 5. PLDM, in particular, exhibits thinner power lines, attributed to the longer shooting distance, with backgrounds primarily comprising leaves and grasses. PLDU dataset images were captured with a UAV hovering at altitudes within ten meters above the power lines, whereas PLDM dataset images were acquired from distances exceeding thirty meters. The misalignment between manually labeled ground truth and actual boundaries is acknowledged, and a parameter called maxDist.
Data augmentation, recognized as a valuable technique for enhancing edge learning performance, was applied. The authors rotated images by 45 degrees, followed by image flips at each angle. Additionally, multiscale images, achieved by resizing training images to scales of 0.5 and 1.5, were employed during training. Consequently, the augmented training set expanded to 48 times its original size.
Notably, the distinctive aspect of these datasets lies in their real-world origin, captured via UAVs, rather than relying on synthetic data. Prior experiments have demonstrated that training solely on synthetic data falls short of achieving the performance of models fine-tuned on real-world datasets. Furthermore, the datasets encompass a diverse range of power line orientations, positions, lengths, widths, and backgrounds, making them valuable for developing learning-based methods for precise power line detection. While the PLDM dataset is relatively small for deep learning approaches, the authors primarily employ the PLDU dataset as the main dataset for evaluation.
Summary #
PLD-UAV: Power Line Detection in UAV is a dataset for instance segmentation, semantic segmentation, and object detection tasks. It is used in the energy industry, and in the drone inspection domain.
The dataset consists of 11210 images with 240553 labeled objects belonging to 1 single class (power_line).
Images in the PLD-UAV dataset have pixel-level instance segmentation annotations. Due to the nature of the instance segmentation task, it can be automatically transformed into a semantic segmentation (only one mask for every class) or object detection (bounding boxes for every object) tasks. There are 8 (0% of the total) unlabeled images (i.e. without annotations). There are 4 splits in the dataset: PLDU-train (7248 images), PLDM-train (3792 images), PLDU-test (120 images), and PLDM-test (50 images). Additionally, aug tag characterizes the degree of an augmentation. Also, every image is grouped by its image_id. Explore them in supervisely labeling tool. The dataset was released in 2019 by the Wuhan University, China and LIESMARS, China.

Explore #
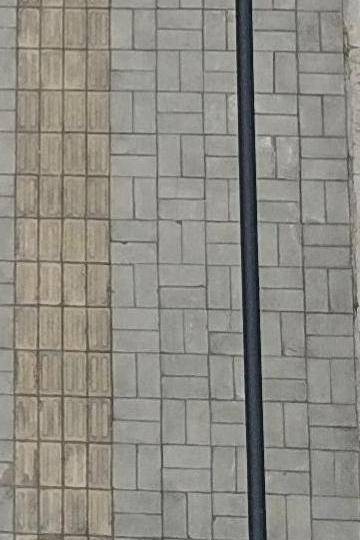
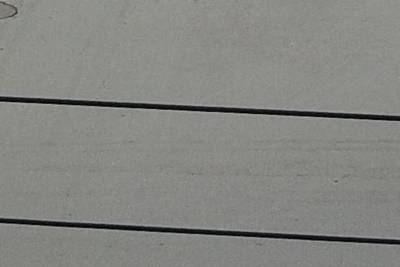
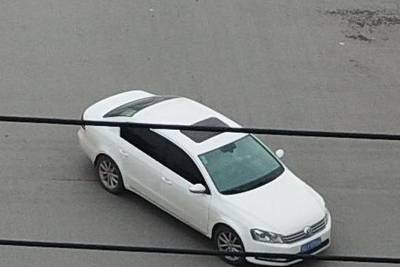
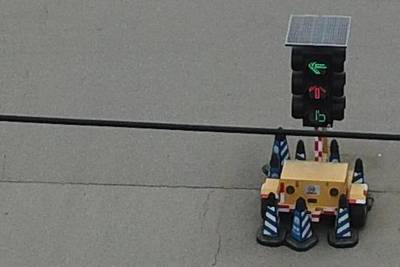
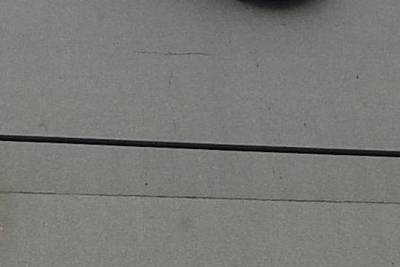
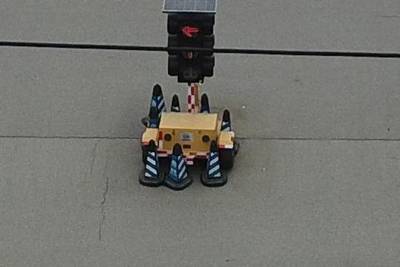
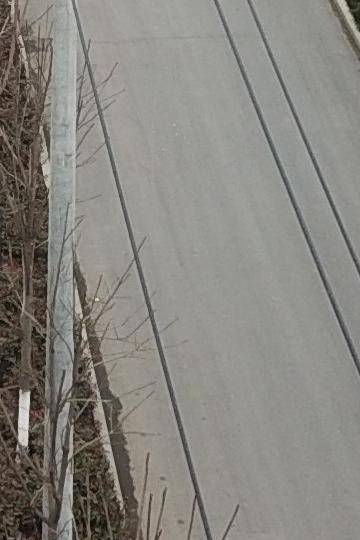
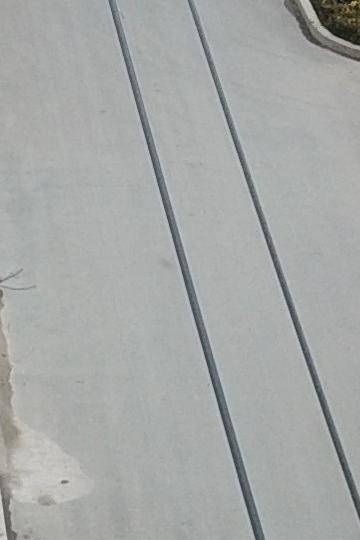
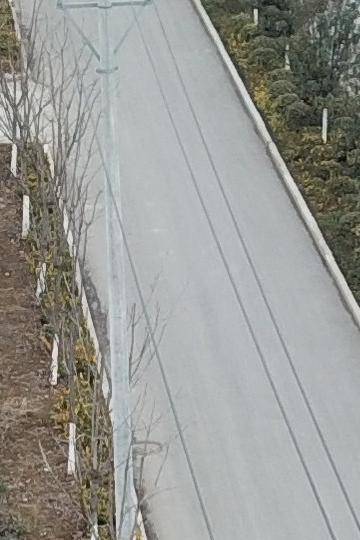
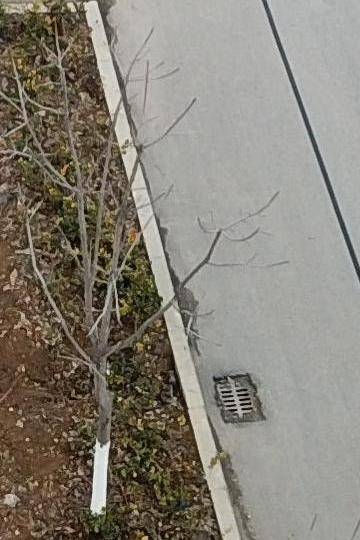
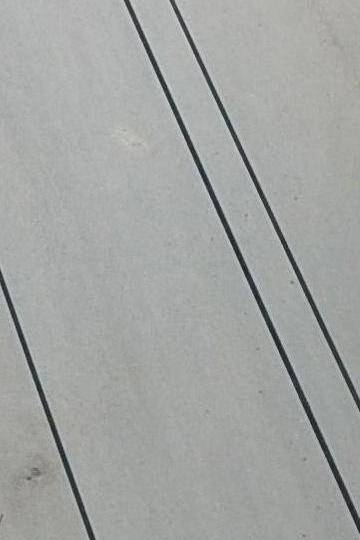
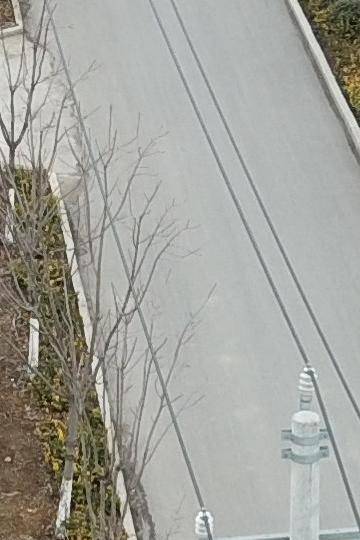
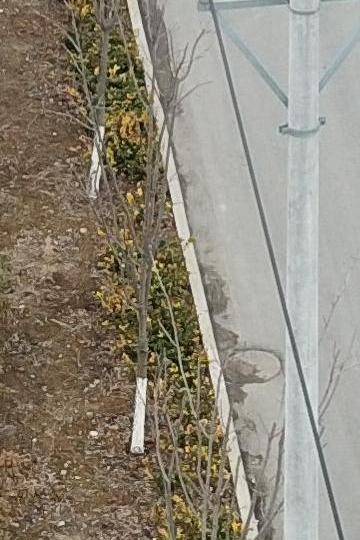
PLD-UAV dataset has 11210 images. Click on one of the examples below or open "Explore" tool anytime you need to view dataset images with annotations. This tool has extended visualization capabilities like zoom, translation, objects table, custom filters and more. Hover the mouse over the images to hide or show annotations.





























Class balance #
There are 1 annotation classes in the dataset. Find the general statistics and balances for every class in the table below. Click any row to preview images that have labels of the selected class. Sort by column to find the most rare or prevalent classes.
Class ㅤ | Images ㅤ | Objects ㅤ | Count on image average | Area on image average |
|---|---|---|---|---|
power_line➔ mask | 11202 | 240553 | 21.47 | 0.86% |
Images #
Explore every single image in the dataset with respect to the number of annotations of each class it has. Click a row to preview selected image. Sort by any column to find anomalies and edge cases. Use horizontal scroll if the table has many columns for a large number of classes in the dataset.
Class sizes #
The table below gives various size properties of objects for every class. Click a row to see the image with annotations of the selected class. Sort columns to find classes with the smallest or largest objects or understand the size differences between classes.
Class | Object count | Avg area | Max area | Min area | Min height | Min height | Max height | Max height | Avg height | Avg height | Min width | Min width | Max width | Max width |
|---|---|---|---|---|---|---|---|---|---|---|---|---|---|---|
power_line mask | 240553 | 0.04% | 2.03% | 0% | 1px | 0.19% | 540px | 100% | 34px | 7.29% | 1px | 0.19% | 540px | 100% |
Spatial Heatmap #
The heatmaps below give the spatial distributions of all objects for every class. These visualizations provide insights into the most probable and rare object locations on the image. It helps analyze objects' placements in a dataset.

Objects #
Table contains all 99671 objects. Click a row to preview an image with annotations, and use search or pagination to navigate. Sort columns to find outliers in the dataset.
Object ID ㅤ | Class ㅤ | Image name click row to open | Image size height x width | Height ㅤ | Height ㅤ | Width ㅤ | Width ㅤ | Area ㅤ |
|---|---|---|---|---|---|---|---|---|
1➔ | power_line mask | 180.0_1_542.jpg | 540 x 360 | 540px | 100% | 47px | 13.06% | 0.56% |
2➔ | power_line mask | 180.0_1_542.jpg | 540 x 360 | 539px | 99.81% | 28px | 7.78% | 0.56% |
3➔ | power_line mask | 180.0_1_542.jpg | 540 x 360 | 540px | 100% | 14px | 3.89% | 0.56% |
4➔ | power_line mask | 90.0_1_90.jpg | 540 x 360 | 61px | 11.3% | 359px | 99.72% | 0.37% |
5➔ | power_line mask | 90.0_1_90.jpg | 540 x 360 | 53px | 9.81% | 359px | 99.72% | 0.37% |
6➔ | power_line mask | 315.0_0_28.jpg | 540 x 360 | 18px | 3.33% | 13px | 3.61% | 0.01% |
7➔ | power_line mask | 315.0_0_28.jpg | 540 x 360 | 32px | 5.93% | 21px | 5.83% | 0.02% |
8➔ | power_line mask | 315.0_0_28.jpg | 540 x 360 | 33px | 6.11% | 22px | 6.11% | 0.02% |
9➔ | power_line mask | 315.0_0_28.jpg | 540 x 360 | 9px | 1.67% | 6px | 1.67% | 0.01% |
10➔ | power_line mask | 315.0_0_28.jpg | 540 x 360 | 15px | 2.78% | 12px | 3.33% | 0.01% |
License #
Citation #
If you make use of the PLD-UAV data, please cite the following reference:
@dataset{PLD-UAV,
  author={Heng Zhang and Wen Yang and Huai Yu and Haijian Zhang and Gui-Song Xia},
  title={PLD-UAV: Power Line Detection in UAV},
  year={2019},
  url={https://snorkerheng.github.io/PLD-UAV/}
}
If you are happy with Dataset Ninja and use provided visualizations and tools in your work, please cite us:
@misc{ visualization-tools-for-pld-uav-dataset,
  title = { Visualization Tools for PLD-UAV Dataset },
  type = { Computer Vision Tools },
  author = { Dataset Ninja },
  howpublished = { \url{ https://datasetninja.com/pld-uav } },
  url = { https://datasetninja.com/pld-uav },
  journal = { Dataset Ninja },
  publisher = { Dataset Ninja },
  year = { 2026 },
  month = { feb },
  note = { visited on 2026-02-15 },
}
Download #
Dataset PLD-UAV can be downloaded in Supervisely format:
As an alternative, it can be downloaded with dataset-tools package:
pip install --upgrade dataset-tools
… using following python code:
import dataset_tools as dtools

dtools.download(dataset='PLD-UAV', dst_dir='~/dataset-ninja/')
Make sure not to overlook the python code example available on the Supervisely Developer Portal. It will give you a clear idea of how to effortlessly work with the downloaded dataset.
The data in original format can be downloaded here:
Disclaimer #
Our gal from the legal dep told us we need to post this:
Dataset Ninja provides visualizations and statistics for some datasets that can be found online and can be downloaded by general audience. Dataset Ninja is not a dataset hosting platform and can only be used for informational purposes. The platform does not claim any rights for the original content, including images, videos, annotations and descriptions. Joint publishing is prohibited.
You take full responsibility when you use datasets presented at Dataset Ninja, as well as other information, including visualizations and statistics we provide. You are in charge of compliance with any dataset license and all other permissions. You are required to navigate datasets homepage and make sure that you can use it. In case of any questions, get in touch with us at hello@datasetninja.com.


