

Introduction #
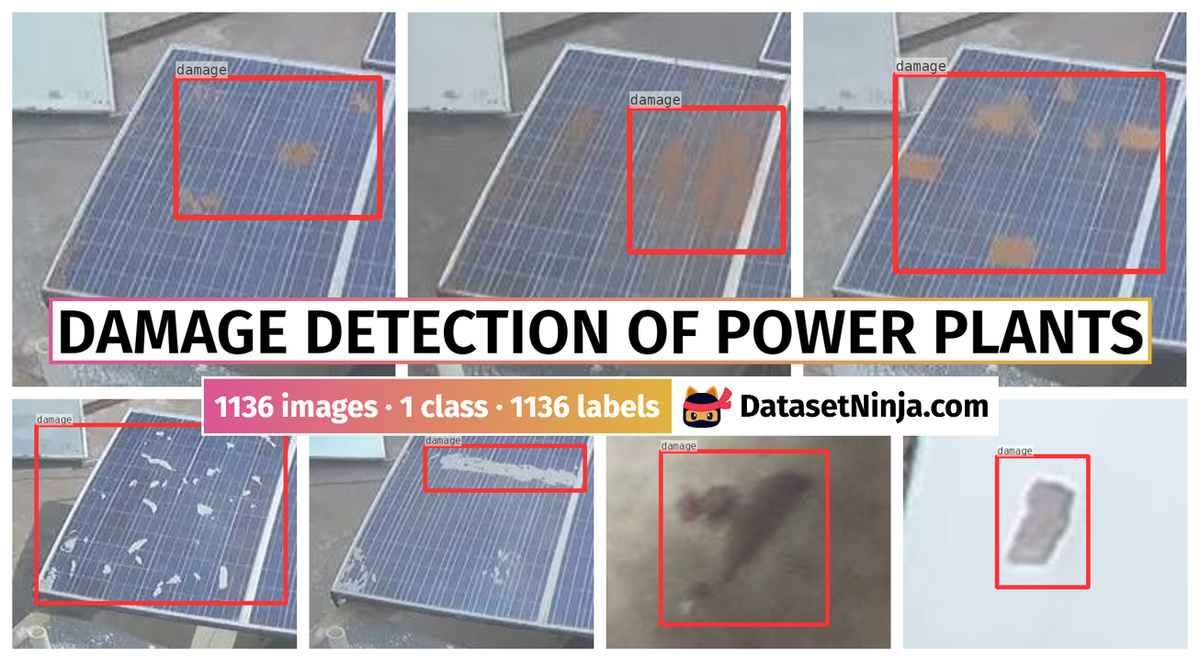
The Damage Detection of Power Plants dataset comprises expert-annotated damages on various types of power plant images, including Wind Turbine Optical Images, Solar Panel Optical Images (Small), Solar Panel Optical Images (Large), and Solar Panel Infrared Images. The authors of the dataset are interested in exploring image-based monitoring as a promising and cost-effective solution for large-scale renewable plants. They aim to automate the detection of damages in power installations using drone-acquired images. However, they face challenges such as size and scale variations, variations in light conditions, and the rarity of some damage types, which can make automated detection difficult, particularly for machine learning methods that rely on a large number of examples.
To evaluate their approach, the authors utilized four different datasets, including Solar Panel Optical Images (Large) obtained with a DJI Mavic Pro drone, Wind Turbine Optical Images captured by professional drone operators in DTU wind energy facilities, Solar Panel Optical Images (Small) from the work of Mehta et al. (2018), and Solar Panel Infrared Images produced by Alfaro-Mejía et al. (2019). They mixed these datasets to evaluate the performance of deep learning-based object detection models for damage detection across different origins and image sensing modalities.
The Wind Turbine Optical Images dataset consists of 431 images, covering various types of surface damages on wind turbine blades, such as erosion, cracks, oil leakage, and damaged lightning receptors.
The Solar Panel Optical Images (Small) dataset contains 516 images, focusing on the effects of soiling on power production for control PV panels.
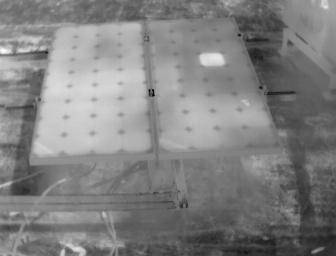
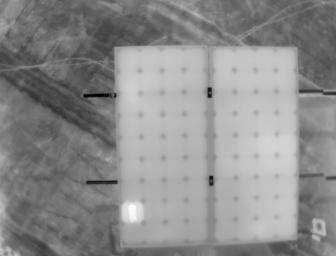
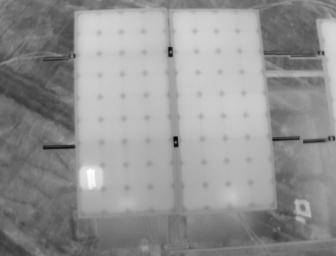
The Solar Panel Optical Images (Large) dataset includes 122 high-resolution long shots of PV panels covered by dust.
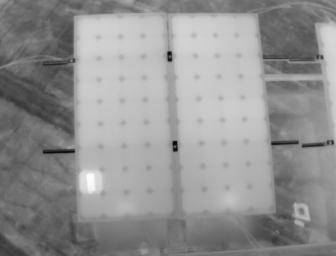
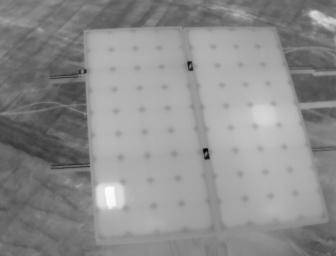
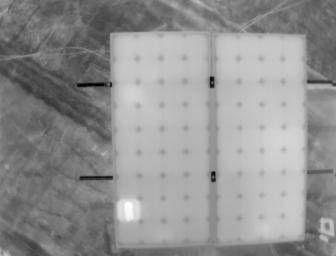
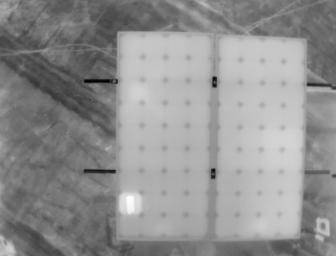
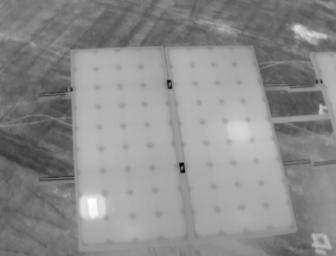
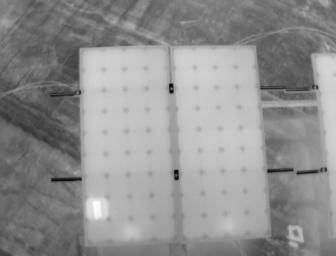
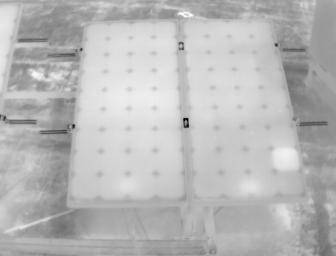
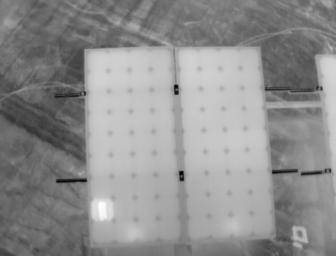
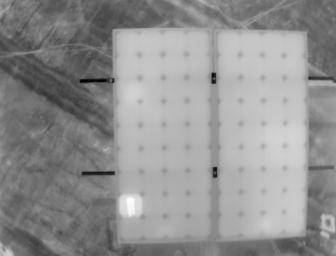
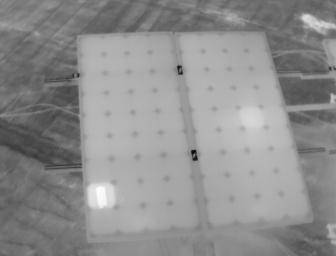
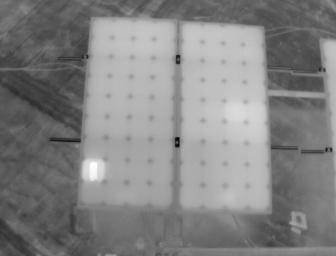
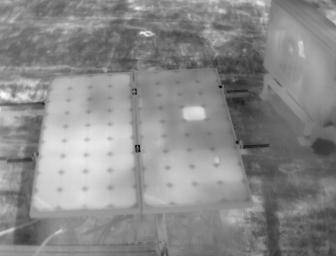
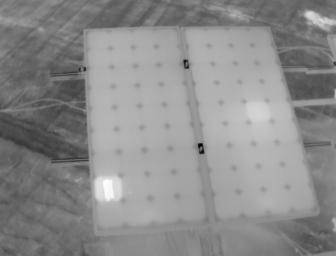
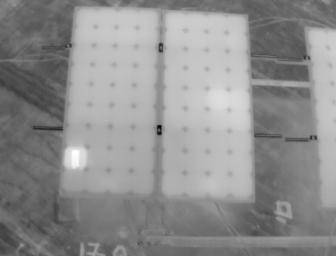
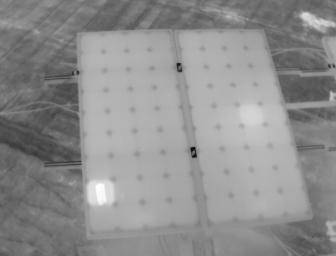
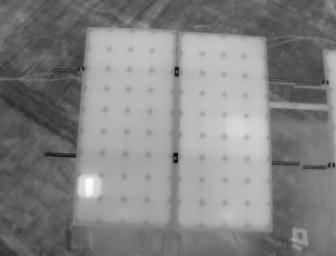
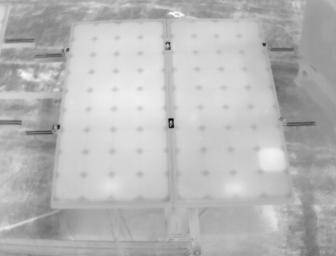
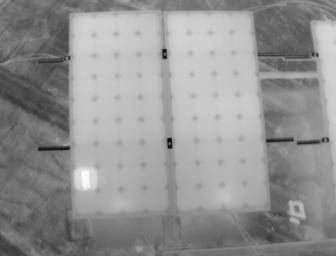
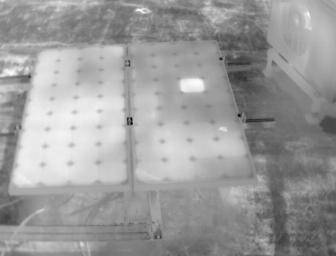
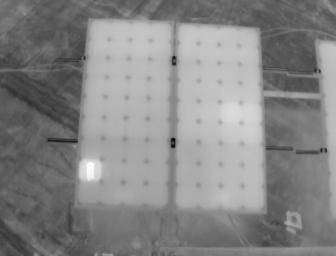
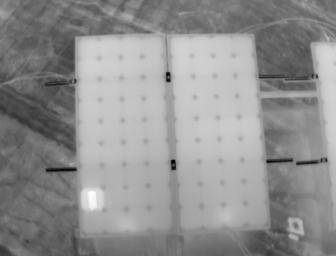
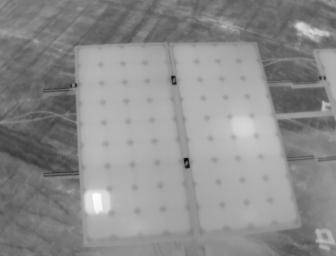
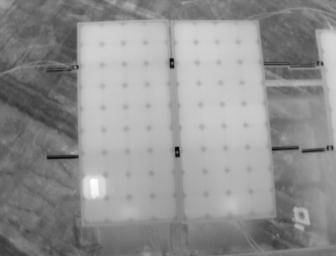
The Solar Panel Infrared Images dataset comprises 67 grayscale images acquired using a Zenmuse XT IR camera with a DJI Matrice 100 drone, annotated for snail trails and hot spot failures.
| Image set | Image type | Captured object | Acquisition by | Resolution | Color | N | Ref. |
|---|---|---|---|---|---|---|---|
| Wind turbine optical images | Optical | Wind turbine | Drone | 100 × 100–1844 × 1281 | Yes | 431 | Shihavuddin et al. (2019) |
| Solar panel optical images (small) | Optical | PV panel | Drone | 192 × 192 | Yes | 516 | Mehta et al. (2018). |
| Solar panel optical images (large) | Optical | PV panel | Drone | 3264 × 1836 | Yes | 122 | Original data |
| Solar panel infrared images | Infrared | PV panel | Handhold | 336 × 256 | No | 67 | Alfaro-Mejía et al. (2019) |
The dataset is a valuable resource for studying and developing damage detection models across different power plant types and image modalities.
 Homepage
 Research Paper
Summary #
Replication Data for Remote Damage Detection of Power Plants Using Deep Learning Based Drone Image Analysis is a dataset for an object detection task. It is used in the drone inspection and damage detection domains, and in the engineering research. Possible applications of the dataset could be in the energy industry.
The dataset consists of 1136 images with 1136 labeled objects belonging to 1 single class (damage).
Images in the Damage Detection of Power Plants dataset have bounding box annotations. All images are labeled (i.e. with annotations). There are no pre-defined train/val/test splits in the dataset. Alternatively, the dataset could be split into 4 image-sets: solar_small (516 images), wind (431 images), solar_large (122 images), and solar_small_IR (67 images). The dataset was released in 2020 by the Green University of Bangladesh and University of Liberal Arts Bangladesh.
Explore #
Damage Detection of Power Plants dataset has 1136 images. Click on one of the examples below or open "Explore" tool anytime you need to view dataset images with annotations. This tool has extended visualization capabilities like zoom, translation, objects table, custom filters and more. Hover the mouse over the images to hide or show annotations.


Class balance #
There are 1 annotation classes in the dataset. Find the general statistics and balances for every class in the table below. Click any row to preview images that have labels of the selected class. Sort by column to find the most rare or prevalent classes.

Class ㅤ | Images ㅤ | Objects ㅤ | Count on image average | Area on image average |
|---|---|---|---|---|
damage➔ rectangle | 1136 | 1136 | 1 | 27.69% |
Images #
Explore every single image in the dataset with respect to the number of annotations of each class it has. Click a row to preview selected image. Sort by any column to find anomalies and edge cases. Use horizontal scroll if the table has many columns for a large number of classes in the dataset.
Object distribution #
Interactive heatmap chart for every class with object distribution shows how many images are in the dataset with a certain number of objects of a specific class. Users can click cell and see the list of all corresponding images.
Class sizes #
The table below gives various size properties of objects for every class. Click a row to see the image with annotations of the selected class. Sort columns to find classes with the smallest or largest objects or understand the size differences between classes.
Class | Object count | Avg area | Max area | Min area | Min height | Min height | Max height | Max height | Avg height | Avg height | Min width | Min width | Max width | Max width |
|---|---|---|---|---|---|---|---|---|---|---|---|---|---|---|
damage rectangle | 1136 | 27.69% | 95.62% | 0.44% | 11px | 6.25% | 1603px | 98.56% | 150px | 45.41% | 9px | 6.25% | 2500px | 99.25% |
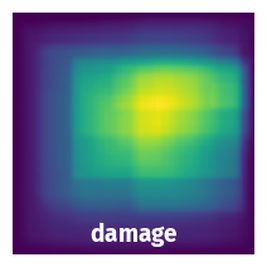
Spatial Heatmap #
The heatmaps below give the spatial distributions of all objects for every class. These visualizations provide insights into the most probable and rare object locations on the image. It helps analyze objects' placements in a dataset.
Objects #
Table contains all 1136 objects. Click a row to preview an image with annotations, and use search or pagination to navigate. Sort columns to find outliers in the dataset.
Object ID ㅤ | Class ㅤ | Image name click row to open | Image size height x width | Height ㅤ | Height ㅤ | Width ㅤ | Width ㅤ | Area ㅤ |
|---|---|---|---|---|---|---|---|---|
1➔ | damage rectangle | IMG_20180217_121011.jpg | 1836 x 3264 | 489px | 26.63% | 2216px | 67.89% | 18.08% |
2➔ | damage rectangle | 112c7ba7-fefa-4434-8cf2-d0c1eaad7613.jpg | 157 x 151 | 116px | 73.89% | 117px | 77.48% | 57.25% |
3➔ | damage rectangle | 6e28c1f5-a44e-42d9-9d11-21ed70b6ba6c.jpg | 131 x 126 | 117px | 89.31% | 117px | 92.86% | 82.93% |
4➔ | damage rectangle | solar_Wed_Jun_28_13__3__17_2017_L_0.6050058915_I_0.728866666667.jpg | 192 x 192 | 114px | 59.38% | 88px | 45.83% | 27.21% |
5➔ | damage rectangle | solar_Fri_Jun_16_13__18__18_2017_L_0.344390860207_I_0.509043137255 - Copy.jpg | 192 x 192 | 21px | 10.94% | 25px | 13.02% | 1.42% |
6➔ | damage rectangle | 0f9b1904-983f-4bec-bc8d-5a264ddf70f4.jpg | 152 x 177 | 91px | 59.87% | 102px | 57.63% | 34.5% |
7➔ | damage rectangle | cbf2d308-3271-40b7-84e3-7b9866570ec6.jpg | 675 x 843 | 430px | 63.7% | 429px | 50.89% | 32.42% |
8➔ | damage rectangle | IMG_20180217_120338.jpg | 1836 x 3264 | 560px | 30.5% | 1594px | 48.84% | 14.9% |
9➔ | damage rectangle | solar_Thu_Jun_22_16__25__9_2017_L_0.878451984457_I_0.226070588235.jpg | 192 x 192 | 58px | 30.21% | 141px | 73.44% | 22.18% |
10➔ | damage rectangle | solar_Fri_Jun_16_10__3__8_2017_L_0.896333497345_I_0.231133333333.jpg | 192 x 192 | 97px | 50.52% | 133px | 69.27% | 35% |
License #
Citation #
If you make use of the Damage Detection of Power Plants data, please cite the following reference:
@data{DVN/GFYPQW_2020,
    author = {Shihavuddin, ASM and Mohammad Rifat Ahmmad Rashid and Xiao Chen and Md Hasan Maruf and Mohammad Asif UL Haq and Muhammad Abul Hasan and Ahmed Al Mansur},
    publisher = {Harvard Dataverse},
    title = {{Replication Data for Remote Damage Detection of Power Plants using Deep Learning based drone image analysis}},
    year = {2020},
    version = {V1},
    doi = {10.7910/DVN/GFYPQW},
    url = {https://doi.org/10.7910/DVN/GFYPQW}
}
If you are happy with Dataset Ninja and use provided visualizations and tools in your work, please cite us:
@misc{ visualization-tools-for-power-plants-damage-detection-dataset,
  title = { Visualization Tools for Damage Detection of Power Plants Dataset },
  type = { Computer Vision Tools },
  author = { Dataset Ninja },
  howpublished = { \url{ https://datasetninja.com/power-plants-damage-detection } },
  url = { https://datasetninja.com/power-plants-damage-detection },
  journal = { Dataset Ninja },
  publisher = { Dataset Ninja },
  year = { 2026 },
  month = { jul },
  note = { visited on 2026-07-30 },
}
Download #
Dataset Damage Detection of Power Plants can be downloaded in Supervisely format:
As an alternative, it can be downloaded with dataset-tools package:
pip install --upgrade dataset-tools
… using following python code:
import dataset_tools as dtools

dtools.download(dataset='Damage Detection of Power Plants', dst_dir='~/dataset-ninja/')
Make sure not to overlook the python code example available on the Supervisely Developer Portal. It will give you a clear idea of how to effortlessly work with the downloaded dataset.
The data in original format can be downloaded here:
Disclaimer #
Our gal from the legal dep told us we need to post this:
Dataset Ninja provides visualizations and statistics for some datasets that can be found online and can be downloaded by general audience. Dataset Ninja is not a dataset hosting platform and can only be used for informational purposes. The platform does not claim any rights for the original content, including images, videos, annotations and descriptions. Joint publishing is prohibited.
You take full responsibility when you use datasets presented at Dataset Ninja, as well as other information, including visualizations and statistics we provide. You are in charge of compliance with any dataset license and all other permissions. You are required to navigate datasets homepage and make sure that you can use it. In case of any questions, get in touch with us at hello@datasetninja.com.