

Introduction #
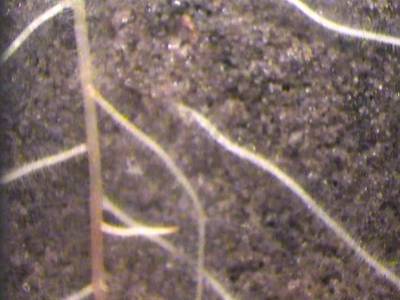
The PRMI: Plant Root Minirhizotron Imagery dataset features over 72,000 RGB root images, encompassing six distinct plant species: cotton, papaya, peanut, sesame, sunflower, and switchgrass. These images cover a wide range of conditions, including varying root ages, structures, soil types, and depths beneath the soil surface. All images come with image-level labels indicating the presence or absence of roots, facilitating weakly supervised learning for root segmentation tasks. Additionally, more than 63,000 images have been manually annotated with pixel-level binary masks, serving as ground truth data for supervised learning in semantic segmentation tasks. The primary objective of introducing this dataset is to streamline the automatic segmentation of plant roots and advance RSA research through deep learning and other image analysis techniques.
In the authors’ study, a comprehensive dataset of plant root images obtained through Minirhizotron (MR) technology is introduced and meticulously curated. This dataset proves invaluable for understanding a plant’s root system architecture (RSA), a critical aspect of various plant science domains, including sustainability and climate adaptation. MR technology offers a non-destructive approach to phenotyping RSA by capturing root imagery over time, and the accurate segmentation of roots from the soil in MR imagery is vital for RSA analysis.
The authors underscore the pivotal role of plant root systems in supporting natural ecosystems, adapting to climate variations, and ensuring sustainable plant production. Phenotyping RSA is crucial for understanding these systems and advancing various aspects of plant science research.
They emphasize the challenges associated with below-ground field-based plant root phenotyping, highlighting that traditional methods like soil coring and “shovelomics” are destructive, labor-intensive, time-consuming, and unsuitable for real-time or longitudinal studies. In contrast, MR technology, wherein transparent tubes are installed in the soil to capture root images over time, offers a non-destructive and high-resolution alternative. MR imagery provides insights into root system development and changes in root characteristics over their life cycle, such as color, diameter, angle, and length changes.
Precise root segmentation from soil backgrounds in MR imagery is a crucial step for effectively utilizing MR technology for RSA analysis. Manual annotation of MR images, wherein users trace individual roots, is a tedious and time-consuming task. This annotation process is a significant bottleneck in large-scale RSA studies. Due to the complexity of plant RSA, biological variability, and environmental influences, a substantial amount of data is required to draw statistically sound conclusions. Therefore, efficient algorithms for high-throughput automatic root segmentation are essential.
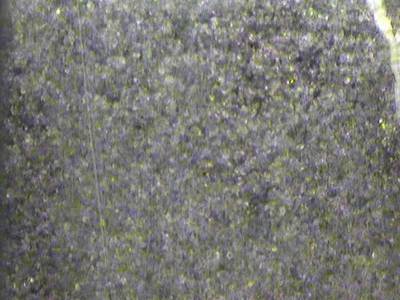
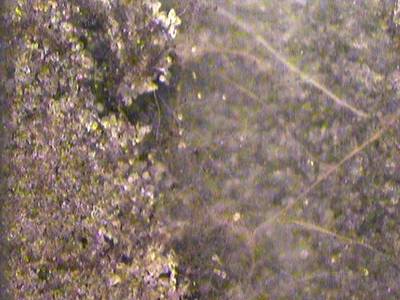
The PRMI dataset, curated by the authors, features MR-captured root images across various plant species. Each species’ dataset includes images from multiple plants and MR tubes, captured at different depths, times, and under diverse soil and environmental conditions. Notably, images related to a specific species may capture the same root portions at different stages of growth, size, shape, and color. Despite all images being captured using MR technology, variations exist in the technology’s specifics for each sub-collection, such as camera types, image resolutions, DPI, and color profiles. Some images exclusively contain plant roots, while others solely depict soil and background.
Each MR image in this dataset is complemented by image-level annotations. Additionally, over 63,000 images are paired with pixel-level annotations, comprising segmentation masks indicating whether each pixel corresponds to a root or soil. Pixel-level annotation methods vary for different species: for cotton, papaya, peanut, sesame, and sunflower, the WinRHIZO Tron software is used, while for switchgrass, annotations are based on superpixels generated by the SLIC algorithm or refined using pre-trained U-net models.
The dataset’s careful curation allows for various types of analysis, including weakly supervised learning for root segmentation tasks. Meta-data for each MR image, including crop species, collection details, tube numbers, depth, and sensor DPI, is recorded in JSON format, providing a comprehensive understanding of the dataset’s characteristics.
To ensure balanced data distribution among train, val, and test sets while avoiding overlap between them, the authors divided the data based on MR tubes. For most species, 60% of tubes were allocated to training, 20% to validation, and the remaining 20% to testing. For switchgrass, all images with manually generated ground-truth masks were placed in the test set, ensuring test set accuracy. The training set included images with image-level annotations to support weakly supervised segmentation.
| Species | DPI | Size | Num of locations | Num of tubes | Num of root images | Num of non-root images | Train | Val | Test | Total |
|---|---|---|---|---|---|---|---|---|---|---|
| Cotton | 150 | 736×552 | 1 | 12 | 918 | 1494 | 1271 | 564 | 577 | 2412 |
| Papaya | 150 | 736×552 | 2 | 6 | 487 | 59 | 282 | 131 | 133 | 546 |
| Peanut | 120 | 640×480 | 1 | 32 | 8508 | 8534 | 10087 | 3413 | 3542 | 17042 |
| Peanut | 150 | 736×552 | 2 | 24 | 11147 | 8478 | 11485 | 3347 | 4793 | 19625 |
| Sesame | 120 | 640×480 | 4 | 11 | 1460 | 700 | 1438 | 318 | 404 | 2160 |
| Sesame | 150 | 736×552 | 2 | 24 | 7923 | 6423 | 8637 | 2625 | 3084 | 14346 |
| Sunflower | 120 | 640×480 | 1 | 16 | 1646 | 2254 | 2211 | 722 | 967 | 3900 |
| Switchgrass | 300 | 510×720 | 3 | 72 | 3465 | 9072 | 11272∗ | 665 | 600 | 12537 |
∗2647 images in the training set have pixel-level annotation and the remaining 8625 images only have image-level annotation.
Researchers can further customize dataset splits based on attributes such as dates, depths, and locations for specific research questions. The inclusion of image-level labels with meta-data facilitates dataset sorting and splitting based on different criteria.
 Homepage
 Research Paper
 Zenodo
Summary #
PRMI: Plant Root Minirhizotron Imagery is a dataset for instance segmentation, semantic segmentation, object detection, and weakly supervised learning tasks. It is used in the agricultural industry.
The dataset consists of 72567 images with 114676 labeled objects belonging to 1 single class (root).
Images in the PRMI dataset have pixel-level instance segmentation annotations. Due to the nature of the instance segmentation task, it can be automatically transformed into a semantic segmentation (only one mask for every class) or object detection (bounding boxes for every object) tasks. There are 37052 (51% of the total) unlabeled images (i.e. without annotations). There are 3 splits in the dataset: train (46682 images), test (14100 images), and val (11785 images). Alternatively, the dataset could be split into 6 species: peanut (36667 images), sesame (16506 images), switchgrass (3912 images), sunflower (3900 images), cotton (2412 images), and papaya (546 images). Additionally, every image preserves information about its DPI. The dataset was released in 2022 by the US-FR joint research group.
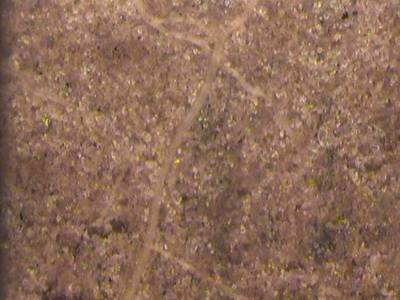
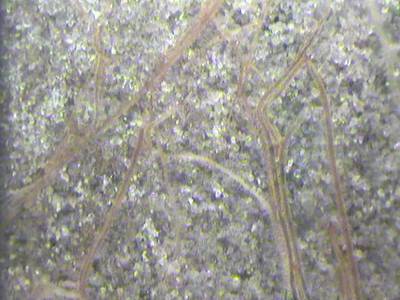
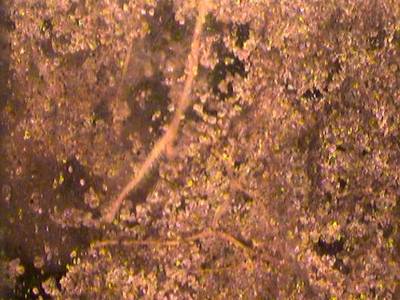
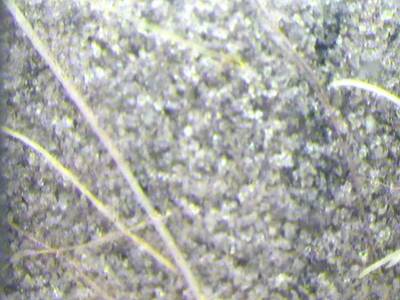
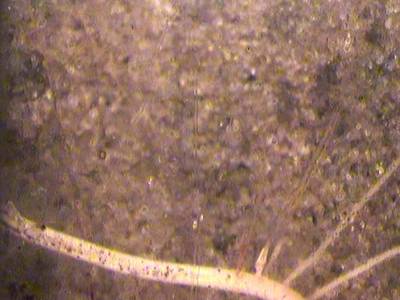
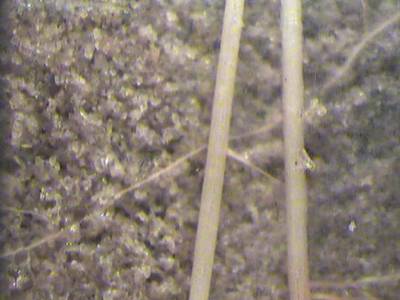
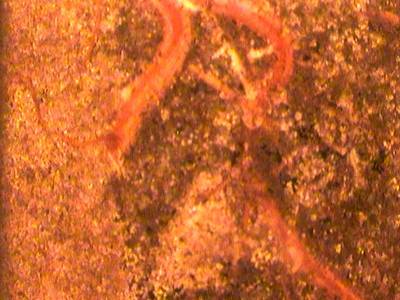
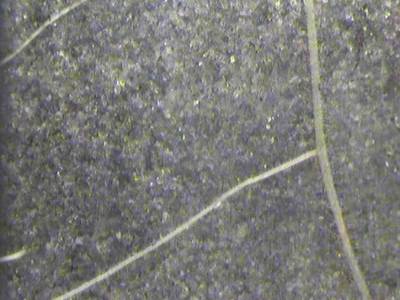
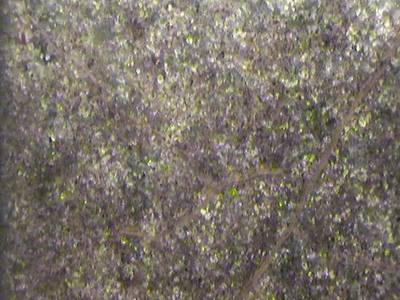
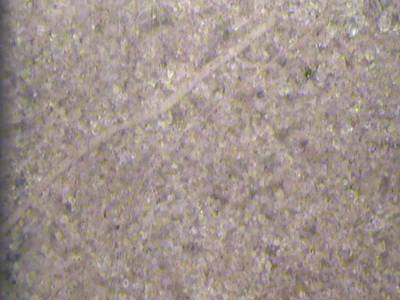
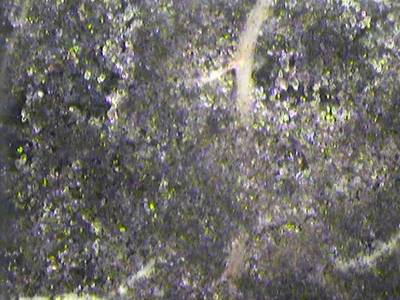
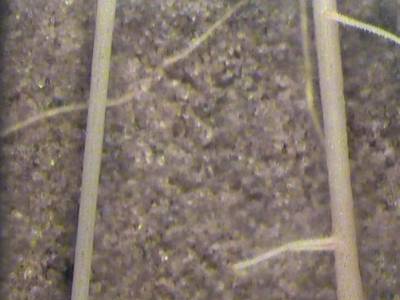
Here is the visualized example grid with animated annotations:
Explore #
PRMI dataset has 72567 images. Click on one of the examples below or open "Explore" tool anytime you need to view dataset images with annotations. This tool has extended visualization capabilities like zoom, translation, objects table, custom filters and more. Hover the mouse over the images to hide or show annotations.


Class balance #
There are 1 annotation classes in the dataset. Find the general statistics and balances for every class in the table below. Click any row to preview images that have labels of the selected class. Sort by column to find the most rare or prevalent classes.

Class ㅤ | Images ㅤ | Objects ㅤ | Count on image average | Area on image average |
|---|---|---|---|---|
root➔ mask | 35515 | 114676 | 3.23 | 3.33% |
Images #
Explore every single image in the dataset with respect to the number of annotations of each class it has. Click a row to preview selected image. Sort by any column to find anomalies and edge cases. Use horizontal scroll if the table has many columns for a large number of classes in the dataset.
Object distribution #
Interactive heatmap chart for every class with object distribution shows how many images are in the dataset with a certain number of objects of a specific class. Users can click cell and see the list of all corresponding images.
Class sizes #
The table below gives various size properties of objects for every class. Click a row to see the image with annotations of the selected class. Sort columns to find classes with the smallest or largest objects or understand the size differences between classes.
Class | Object count | Avg area | Max area | Min area | Min height | Min height | Max height | Max height | Avg height | Avg height | Min width | Min width | Max width | Max width |
|---|---|---|---|---|---|---|---|---|---|---|---|---|---|---|
root mask | 114676 | 1.03% | 63.98% | 0% | 1px | 0.14% | 720px | 100% | 148px | 27.61% | 1px | 0.14% | 736px | 100% |
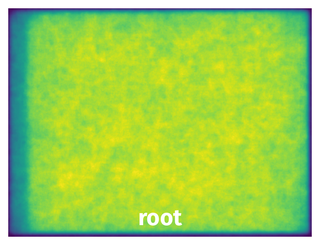
Spatial Heatmap #
The heatmaps below give the spatial distributions of all objects for every class. These visualizations provide insights into the most probable and rare object locations on the image. It helps analyze objects' placements in a dataset.
Objects #
Table contains all 100315 objects. Click a row to preview an image with annotations, and use search or pagination to navigate. Sort columns to find outliers in the dataset.
Object ID ㅤ | Class ㅤ | Image name click row to open | Image size height x width | Height ㅤ | Height ㅤ | Width ㅤ | Width ㅤ | Area ㅤ |
|---|---|---|---|---|---|---|---|---|
1➔ | root mask | Peanut_T024_L051_2017.07.13_103521_EED_DPI120.jpg | 480 x 640 | 262px | 54.58% | 261px | 40.78% | 1.85% |
2➔ | root mask | Papaya_T101_L014_2013.09.20_120654_CIV_DPI150.jpg | 552 x 736 | 72px | 13.04% | 26px | 3.53% | 0.41% |
3➔ | root mask | Papaya_T101_L014_2013.09.20_120654_CIV_DPI150.jpg | 552 x 736 | 548px | 99.28% | 371px | 50.41% | 9.8% |
4➔ | root mask | Papaya_T101_L014_2013.09.20_120654_CIV_DPI150.jpg | 552 x 736 | 332px | 60.14% | 240px | 32.61% | 3.69% |
5➔ | root mask | Papaya_T101_L014_2013.09.20_120654_CIV_DPI150.jpg | 552 x 736 | 46px | 8.33% | 37px | 5.03% | 0.14% |
6➔ | root mask | Papaya_T101_L014_2013.09.20_120654_CIV_DPI150.jpg | 552 x 736 | 136px | 24.64% | 212px | 28.8% | 1.1% |
7➔ | root mask | Papaya_T101_L014_2013.09.20_120654_CIV_DPI150.jpg | 552 x 736 | 15px | 2.72% | 7px | 0.95% | 0.01% |
8➔ | root mask | Papaya_T101_L014_2013.09.20_120654_CIV_DPI150.jpg | 552 x 736 | 60px | 10.87% | 93px | 12.64% | 0.34% |
9➔ | root mask | Papaya_T101_L014_2013.09.20_120654_CIV_DPI150.jpg | 552 x 736 | 371px | 67.21% | 183px | 24.86% | 1.33% |
10➔ | root mask | Papaya_T101_L014_2013.09.20_120654_CIV_DPI150.jpg | 552 x 736 | 235px | 42.57% | 270px | 36.68% | 4.75% |
License #
PRMI: A Dataset of Minirhizotron Images for Diverse Plant Root Study is under CC0 1.0 license.
Citation #
If you make use of the PRMI data, please cite the following reference:
@misc{xu2022prmi,
  title={PRMI: A Dataset of Minirhizotron Images for Diverse Plant Root Study},
  author={Weihuang Xu and Guohao Yu and Yiming Cui and Romain Gloaguen and Alina Zare and Jason Bonnette
and Joel Reyes-Cabrera and Ashish Rajurkar and Diane Rowland and Roser Matamala and Julie D. Jastrow
and Thomas E. Juenger and Felix B. Fritschi},
  year={2022},
  eprint={2201.08002},
  archivePrefix={arXiv},
  primaryClass={cs.CV}
}
If you are happy with Dataset Ninja and use provided visualizations and tools in your work, please cite us:
@misc{ visualization-tools-for-prmi-dataset,
  title = { Visualization Tools for PRMI Dataset },
  type = { Computer Vision Tools },
  author = { Dataset Ninja },
  howpublished = { \url{ https://datasetninja.com/prmi } },
  url = { https://datasetninja.com/prmi },
  journal = { Dataset Ninja },
  publisher = { Dataset Ninja },
  year = { 2026 },
  month = { jul },
  note = { visited on 2026-07-18 },
}
Download #
Dataset PRMI can be downloaded in Supervisely format:
As an alternative, it can be downloaded with dataset-tools package:
pip install --upgrade dataset-tools
… using following python code:
import dataset_tools as dtools

dtools.download(dataset='PRMI', dst_dir='~/dataset-ninja/')
Make sure not to overlook the python code example available on the Supervisely Developer Portal. It will give you a clear idea of how to effortlessly work with the downloaded dataset.
The data in original format can be downloaded here:
Disclaimer #
Our gal from the legal dep told us we need to post this:
Dataset Ninja provides visualizations and statistics for some datasets that can be found online and can be downloaded by general audience. Dataset Ninja is not a dataset hosting platform and can only be used for informational purposes. The platform does not claim any rights for the original content, including images, videos, annotations and descriptions. Joint publishing is prohibited.
You take full responsibility when you use datasets presented at Dataset Ninja, as well as other information, including visualizations and statistics we provide. You are in charge of compliance with any dataset license and all other permissions. You are required to navigate datasets homepage and make sure that you can use it. In case of any questions, get in touch with us at hello@datasetninja.com.