

Introduction #
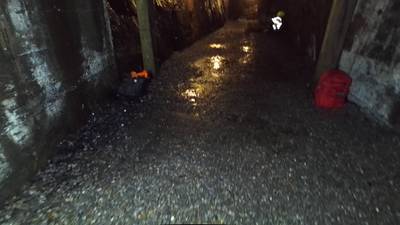
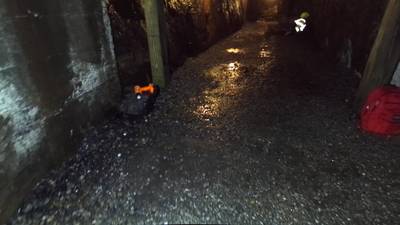
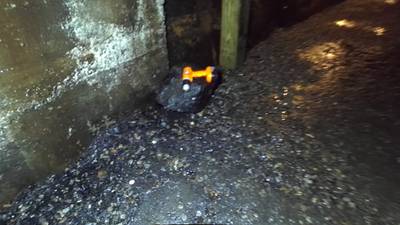
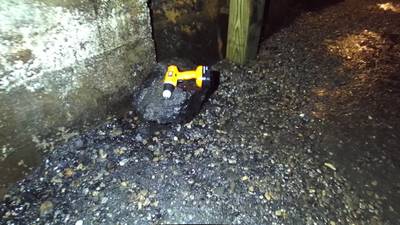
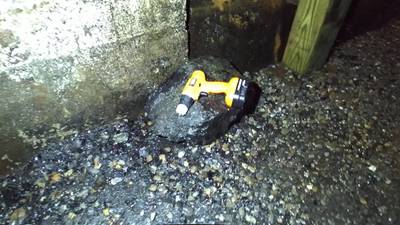
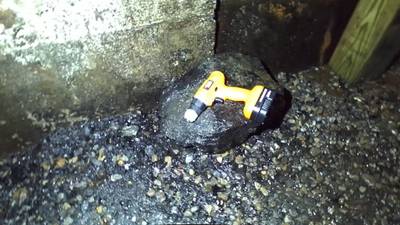
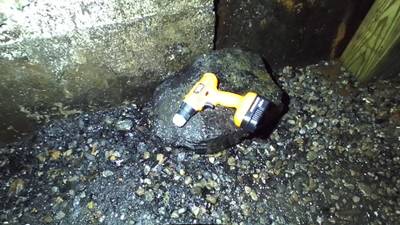
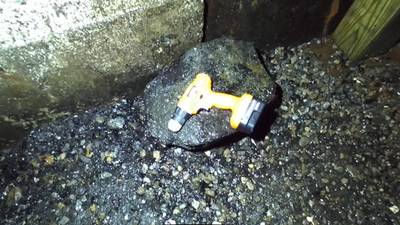
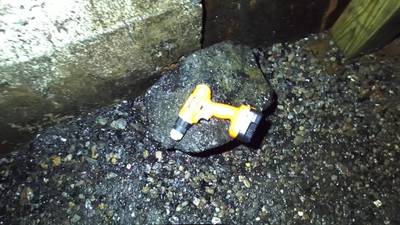
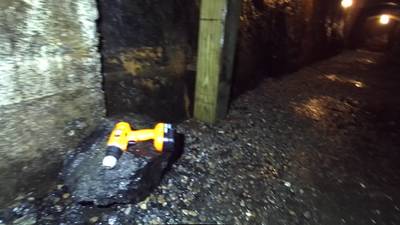
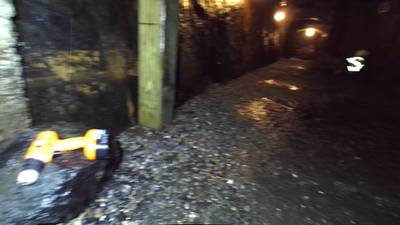
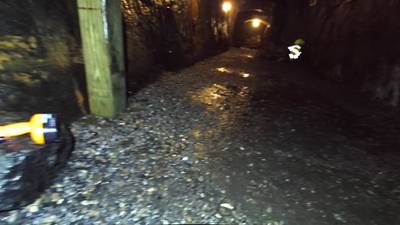
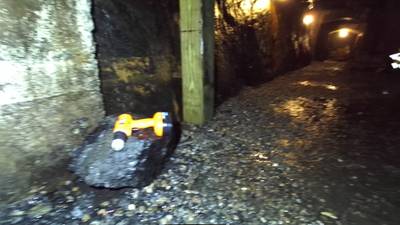
The authors introduce a PST900 RGB-T: Penn Subterranean Thermal 900 RGB-Thermal Dataset of 894 aligned pairs of RGB and Thermal images (+ depth images) with per-pixel human annotations of 4 visible artifacts: fire extinguisher, backpack, hand drill, rescue randy, driven by the requirements of the DARPA Subterranean Challenge. The sensor head includes a Stereolabs ZED Mini stereo camera and a FLIR Boson 320 camera, and a calibration procedure is designed to obtain camera intrinsics and system extrinsics. The dataset is collected from various environments, including the Number 9 Coal Mine in Lansford, PA, cluttered indoor and outdoor spaces. In addition to the RGB-Thermal data, a larger set of similarly annotated RGB-only data is provided.
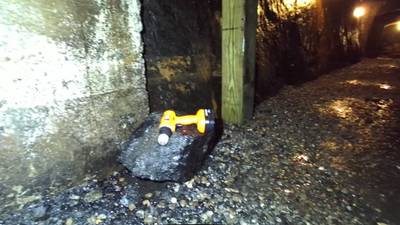
Left - Quadruped mobile robot platform for data collection; sensor head includes a Stereolabs Zed Mini Stereo RGB camera, FLIR Boson 320 and an active illumintation setup. Right - example RGB and Thermal imagery, with a human annotated segmentation label at the bottom.
In their work, the authors propose long-wave infrared (LWIR) imagery as a viable supporting modality for semantic segmentation using learning-based techniques. They address the issue of RGB-thermal camera calibration by introducing a passive calibration target and procedure that is both portable and easy to use.
The first row contains example RGB image data captured from the Stereolabs Zed Mini camera. The second row contains aligned thermal imagery (visualized in 8-bit color) captured from the FLIR Boson camera. The last row contains human annotated per-pixel labels for each of the four classes.
The ability to parse raw imagery and ascertain pixel-wise and region-wise semantic information is desirable for environment perception enabling advanced robot autonomy. Semantic segmentation is a major subject of robotics research with applications ranging from medicine and agriculture to autonomous vehicles. Convolutional neural networks (CNNs) have been popularly applied to image classification tasks, demonstrating significant improvements over classical methods. Recently, the focus has shifted to semantic segmentation from RGB imagery, driven by the growth in autonomous vehicle research.
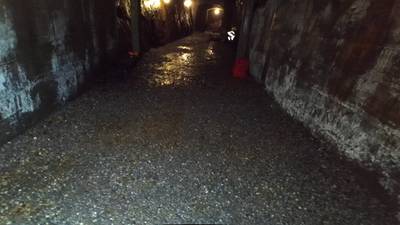
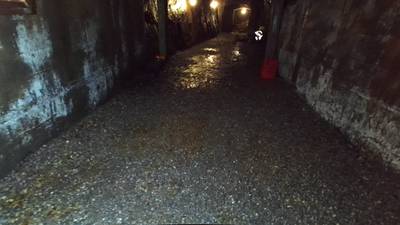
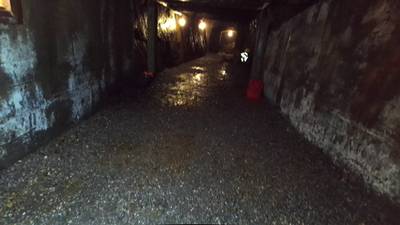
The authors highlight the increasing accessibility of thermal cameras, once primarily used by the military, and propose their usage in challenging environments, particularly those with visibility and illumination limitations, such as underground tunnels, mines, and caves. They argue that long-wave infrared spectrum information can enhance segmentation accuracy in such environments, especially since it is not dependent on visible spectrum illumination. The authors demonstrate that the fusion of thermal information improves the segmentation of objects without distinct thermal signatures.
The authors acknowledge that collecting large amounts of RGB data and obtaining accurate per-pixel human annotations is more feasible than doing so for calibrated and aligned RGB-Thermal data. They design a network with an independent RGB stream that can be trained without thermal data and introduce the thermal modality to improve the results. The proposed sequential, dual stream architecture draws influence from ResNet-18, UNet, and ERFNet, demonstrating efficiency, flexibility, and accuracy on their dataset.
 Homepage
 Research Paper
Summary #
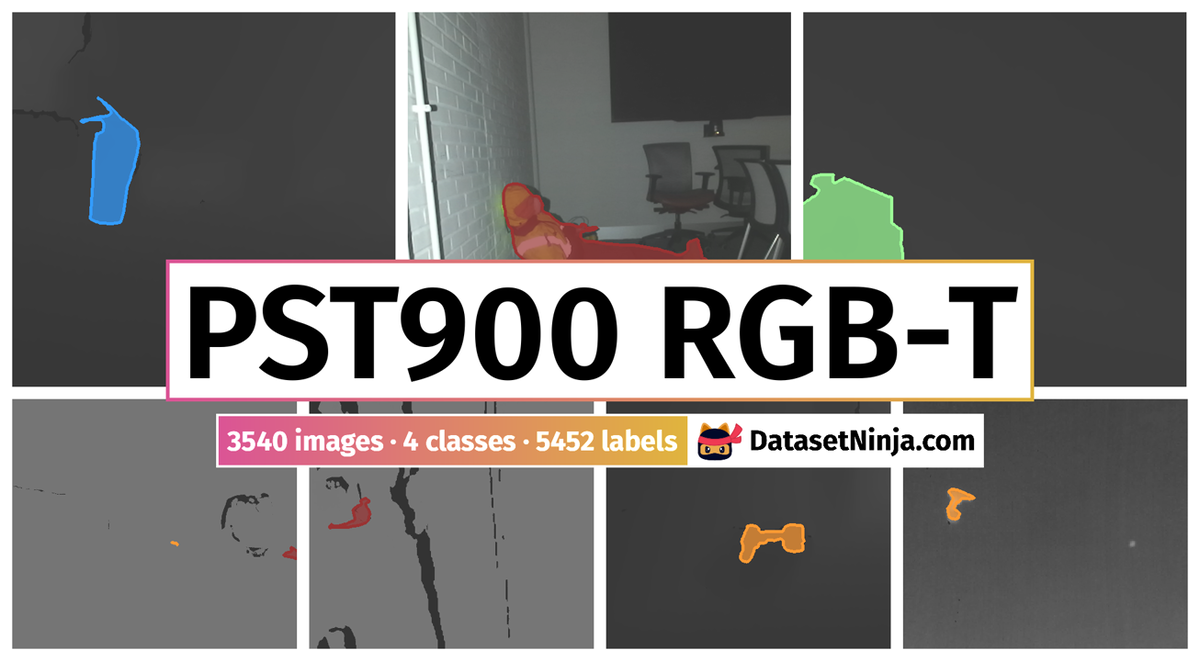
PST900 RGB-T: Penn Subterranean Thermal 900 RGB-Thermal Dataset is a dataset for instance segmentation, semantic segmentation, and object detection tasks. It is used in the robotics industry.
The dataset consists of 3540 images with 5452 labeled objects belonging to 4 different classes including backpack, rescue randy, hand drill, and other: fire extinguisher.
Images in the PST900 RGB-T dataset have pixel-level instance segmentation annotations. Due to the nature of the instance segmentation task, it can be automatically transformed into a semantic segmentation (only one mask for every class) or object detection (bounding boxes for every object) tasks. There are 516 (15% of the total) unlabeled images (i.e. without annotations). There are 2 splits in the dataset: train (2388 images) and test (1152 images). Every quartet of images (RGB, depth, thermal, and thermal_raw) has im_id tag. The dataset was released in 2020 by the University of Pennsylvania, USA.
Explore #
PST900 RGB-T dataset has 3540 images. Click on one of the examples below or open "Explore" tool anytime you need to view dataset images with annotations. This tool has extended visualization capabilities like zoom, translation, objects table, custom filters and more. Hover the mouse over the images to hide or show annotations.


Class balance #
There are 4 annotation classes in the dataset. Find the general statistics and balances for every class in the table below. Click any row to preview images that have labels of the selected class. Sort by column to find the most rare or prevalent classes.

Class ㅤ | Images ㅤ | Objects ㅤ | Count on image average | Area on image average |
|---|---|---|---|---|
backpack➔ mask | 1676 | 1692 | 1.01 | 2.55% |
rescue randy➔ mask | 1380 | 1480 | 1.07 | 3.52% |
hand drill➔ mask | 1208 | 1224 | 1.01 | 0.52% |
fire extinguisher➔ mask | 1024 | 1056 | 1.03 | 0.99% |
Co-occurrence matrix #
Co-occurrence matrix is an extremely valuable tool that shows you the images for every pair of classes: how many images have objects of both classes at the same time. If you click any cell, you will see those images. We added the tooltip with an explanation for every cell for your convenience, just hover the mouse over a cell to preview the description.
Images #
Explore every single image in the dataset with respect to the number of annotations of each class it has. Click a row to preview selected image. Sort by any column to find anomalies and edge cases. Use horizontal scroll if the table has many columns for a large number of classes in the dataset.
Object distribution #
Interactive heatmap chart for every class with object distribution shows how many images are in the dataset with a certain number of objects of a specific class. Users can click cell and see the list of all corresponding images.
Class sizes #
The table below gives various size properties of objects for every class. Click a row to see the image with annotations of the selected class. Sort columns to find classes with the smallest or largest objects or understand the size differences between classes.
Class | Object count | Avg area | Max area | Min area | Min height | Min height | Max height | Max height | Avg height | Avg height | Min width | Min width | Max width | Max width |
|---|---|---|---|---|---|---|---|---|---|---|---|---|---|---|
backpack mask | 1692 | 2.53% | 22.74% | 0% | 6px | 0.83% | 650px | 90.28% | 166px | 22.99% | 4px | 0.31% | 528px | 41.25% |
rescue randy mask | 1480 | 3.29% | 23.36% | 0% | 7px | 0.97% | 646px | 89.72% | 172px | 23.83% | 6px | 0.47% | 894px | 69.84% |
hand drill mask | 1224 | 0.52% | 5.48% | 0% | 7px | 0.97% | 348px | 48.33% | 77px | 10.74% | 5px | 0.39% | 336px | 26.25% |
fire extinguisher mask | 1056 | 0.96% | 11.82% | 0% | 4px | 0.56% | 592px | 82.22% | 133px | 18.54% | 4px | 0.31% | 351px | 27.42% |
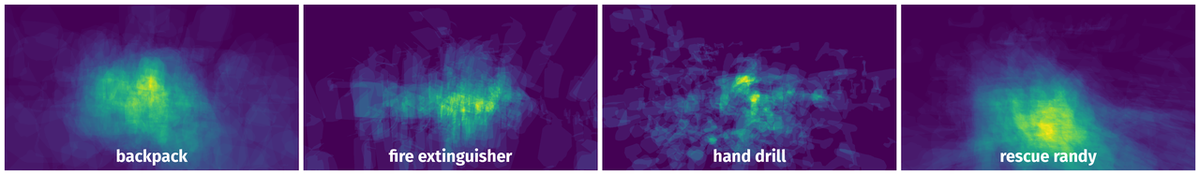
Spatial Heatmap #
The heatmaps below give the spatial distributions of all objects for every class. These visualizations provide insights into the most probable and rare object locations on the image. It helps analyze objects' placements in a dataset.
Objects #
Table contains all 5452 objects. Click a row to preview an image with annotations, and use search or pagination to navigate. Sort columns to find outliers in the dataset.
Object ID ㅤ | Class ㅤ | Image name click row to open | Image size height x width | Height ㅤ | Height ㅤ | Width ㅤ | Width ㅤ | Area ㅤ |
|---|---|---|---|---|---|---|---|---|
1➔ | fire extinguisher mask | rgb_62_bag25_rect_rgb_frame0000001607.png | 720 x 1280 | 40px | 5.56% | 21px | 1.64% | 0.08% |
2➔ | backpack mask | rgb_62_bag25_rect_rgb_frame0000001607.png | 720 x 1280 | 58px | 8.06% | 36px | 2.81% | 0.16% |
3➔ | fire extinguisher mask | thermal_61_bag24_rect_rgb_frame0000001411.png | 720 x 1280 | 181px | 25.14% | 113px | 8.83% | 1.15% |
4➔ | backpack mask | thermal_61_bag24_rect_rgb_frame0000001411.png | 720 x 1280 | 96px | 13.33% | 140px | 10.94% | 0.95% |
5➔ | hand drill mask | thermal_61_bag24_rect_rgb_frame0000001411.png | 720 x 1280 | 69px | 9.58% | 82px | 6.41% | 0.32% |
6➔ | hand drill mask | thermal_58_bag21_rect_rgb_frame0000000850.png | 720 x 1280 | 190px | 26.39% | 287px | 22.42% | 2.66% |
7➔ | hand drill mask | thermal_raw_58_bag21_rect_rgb_frame0000001125.png | 720 x 1280 | 109px | 15.14% | 145px | 11.33% | 0.85% |
8➔ | backpack mask | rgb_59_bag22_rect_rgb_frame0000001186.png | 720 x 1280 | 351px | 48.75% | 316px | 24.69% | 9.68% |
9➔ | hand drill mask | rgb_62_bag25_rect_rgb_frame0000000657.png | 720 x 1280 | 30px | 4.17% | 43px | 3.36% | 0.04% |
10➔ | rescue randy mask | rgb_62_bag25_rect_rgb_frame0000000657.png | 720 x 1280 | 132px | 18.33% | 360px | 28.12% | 1.91% |
License #
PST900 RGB-T: Penn Subterranean Thermal 900 RGB-Thermal Dataset is under GNU GPL 3.0 license.
Citation #
If you make use of the PST900 RGB-T data, please cite the following reference:
@misc{shivakumar2019pst900,
  title={PST900: RGB-Thermal Calibration, Dataset and Segmentation Network},
  author={Shreyas S. Shivakumar and Neil Rodrigues and Alex Zhou and Ian D. Miller and Vijay Kumar and Camillo J. Taylor},
  year={2019},
  eprint={1909.10980},
  archivePrefix={arXiv},
  primaryClass={cs.CV}
}
If you are happy with Dataset Ninja and use provided visualizations and tools in your work, please cite us:
@misc{ visualization-tools-for-pst900-rgbt-dataset,
  title = { Visualization Tools for PST900 RGB-T Dataset },
  type = { Computer Vision Tools },
  author = { Dataset Ninja },
  howpublished = { \url{ https://datasetninja.com/pst900-rgbt } },
  url = { https://datasetninja.com/pst900-rgbt },
  journal = { Dataset Ninja },
  publisher = { Dataset Ninja },
  year = { 2026 },
  month = { jul },
  note = { visited on 2026-07-16 },
}
Download #
Dataset PST900 RGB-T can be downloaded in Supervisely format:
As an alternative, it can be downloaded with dataset-tools package:
pip install --upgrade dataset-tools
… using following python code:
import dataset_tools as dtools

dtools.download(dataset='PST900 RGB-T', dst_dir='~/dataset-ninja/')
Make sure not to overlook the python code example available on the Supervisely Developer Portal. It will give you a clear idea of how to effortlessly work with the downloaded dataset.
The data in original format can be downloaded here.
Disclaimer #
Our gal from the legal dep told us we need to post this:
Dataset Ninja provides visualizations and statistics for some datasets that can be found online and can be downloaded by general audience. Dataset Ninja is not a dataset hosting platform and can only be used for informational purposes. The platform does not claim any rights for the original content, including images, videos, annotations and descriptions. Joint publishing is prohibited.
You take full responsibility when you use datasets presented at Dataset Ninja, as well as other information, including visualizations and statistics we provide. You are in charge of compliance with any dataset license and all other permissions. You are required to navigate datasets homepage and make sure that you can use it. In case of any questions, get in touch with us at hello@datasetninja.com.