

Introduction #
This is a Detection part of Microsoft PubTables-1M dataset, which is designed to address the limitations for table structure inference and extraction from unstructured documents. It comprises nearly one million tables extracted from scientific articles, offering support for multiple input modalities. Crucially, it includes detailed header and location information for table structures, enhancing its utility for diverse modeling approaches. The dataset not only quantifies improvements in training performance but also provides a more reliable estimate of model performance during evaluation for table structure recognition.
Motivation
A table serves as a compact, structured representation for data storage and communication. However, the challenge arises when the logical structure of a presented table does not explicitly align with its visual representation, hindering data utilization in documents.
Table extraction (TE) task involves three subtasks: table detection (TD), table structure recognition (TSR), and functional analysis (FA). These tasks are particularly challenging due to the varied formats, styles, and layouts encountered in presented tables. The shift from traditional rule-based methods to deep learning has been notable, yet manual annotation for TSR remains arduous.
Illustration of the three subtasks of table extraction addressed by the PubTables-1M dataset.
Challenges with crowdsourced markup annotations
Crowdsourcing has been employed to construct larger datasets, using documents from numerous authors. However, repurposing annotations for TE poses challenges related to completeness, consistency, quality, and explicitness of information. Markup lacks spatial coordinates for cells and relies on implicit cues, limiting potential modeling approaches and quality control for annotation correctness.
A critical issue in crowdsourced markup annotations is oversegmentation, where a spanning cell in a header is erroneously split into multiple grid cells. This introduces inconsistencies in the logical interpretation of a table, violating the assumption of a single correct ground truth. Oversegmented annotations lead to contradictory feedback during training and an underestimated model performance during evaluation.
PubTables-1M data source selection
To build PubTables-1M, the authors chose the PMCOA corpus, comprising millions of scientific articles in PDF and XML formats. Each table’s content and structure are annotated using standard HTML tags in the XML document, providing a rich source of annotated tables.
Annotation verification and canonicalization
Given that the PMCOA corpus was not intended for TE ground truth, the authors undertook a multi-step process to enhance data quality and consistency. This involved inferring missing annotation information, verifying text annotation quality, and addressing oversegmentation issues through a novel canonicalization procedure (see the full algorithm in the paper).
Quality control measures
Automated checks were implemented to ensure data quality. Tables with overlapping rows or columns, as these likely indicated errors, were discarded. Text annotation quality was ensured by comparing text from XML annotations with extracted text from PDFs. Additionally, tables with more than 100 objects were considered outliers and removed.
Dataset statistics and splits
PubTables-1M stands out as the first dataset to verify annotations at the cell level, ensuring measurable assurance of consistency in ground truth. The dataset includes 947,642 tables for TSR, with 52.7% classified as complex. Canonicalization adjusted annotations for 34.7% of all tables, or 65.8% of complex tables.
Comparisons with other datasets highlight PubTables-1M’s diversity, complexity, and a significant reduction in oversegmentation. The dataset was split randomly into train, val, and test sets, providing a comprehensive resource for advancing table extraction research.
 Homepage
 Research Paper
 GitHub
Summary #
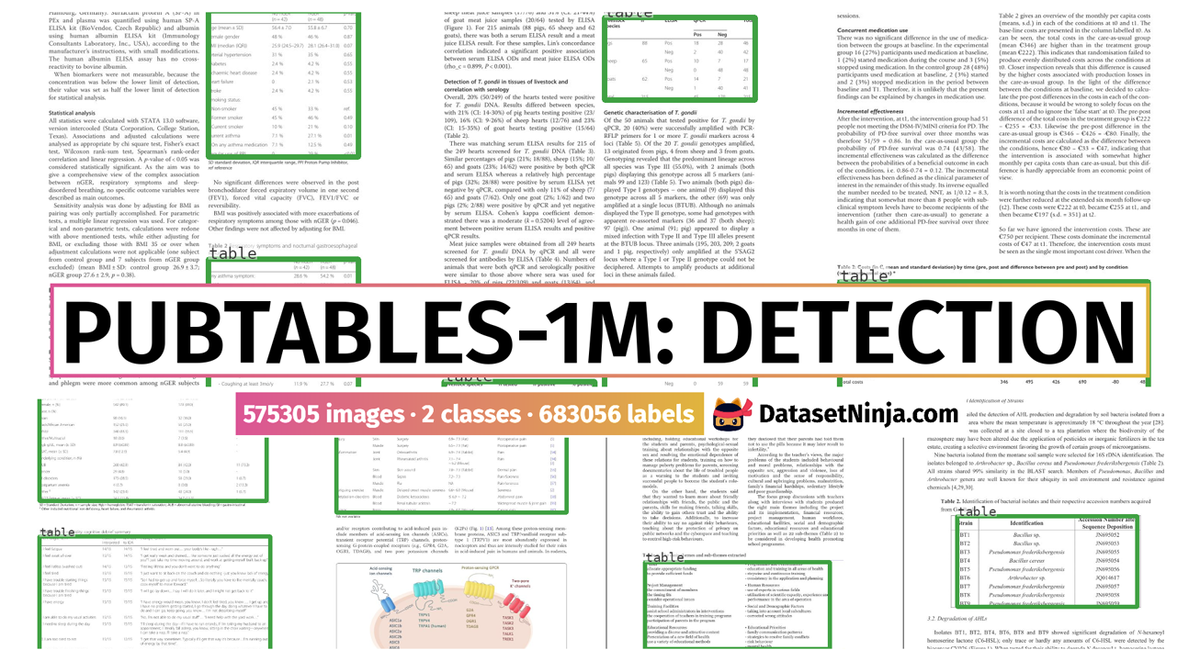
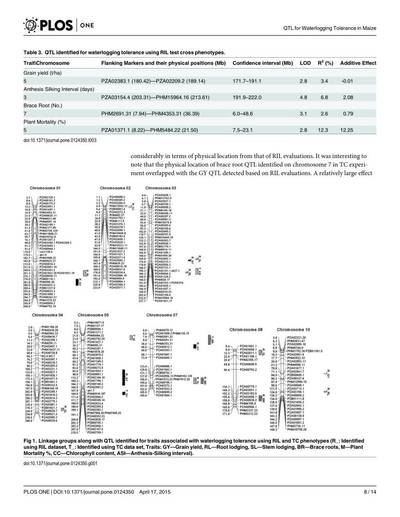
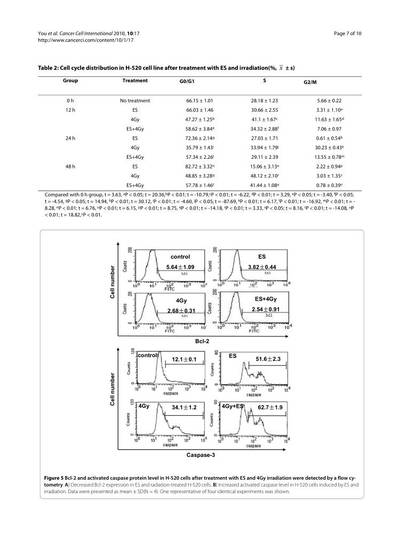
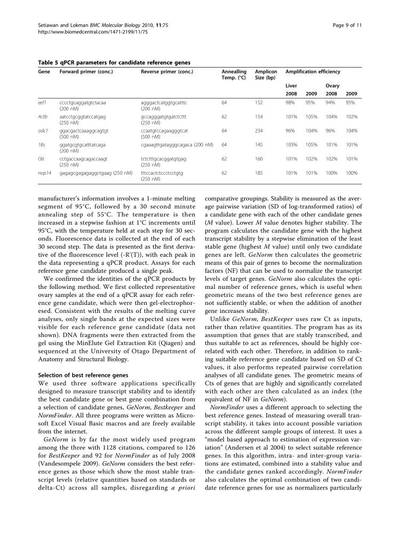
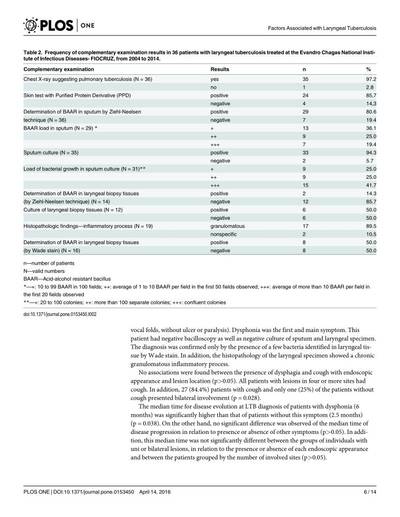
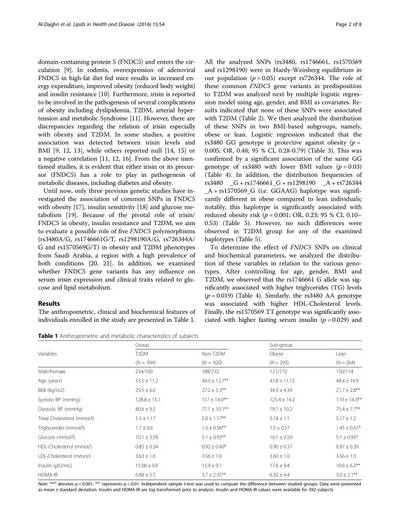
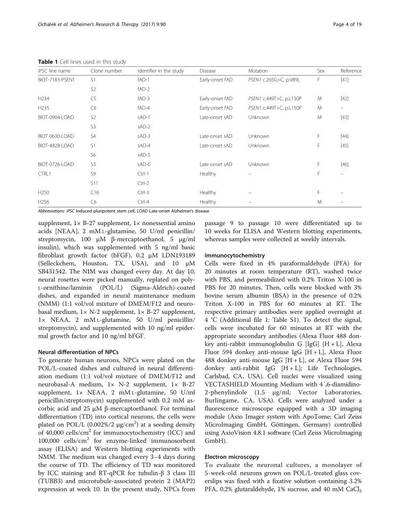
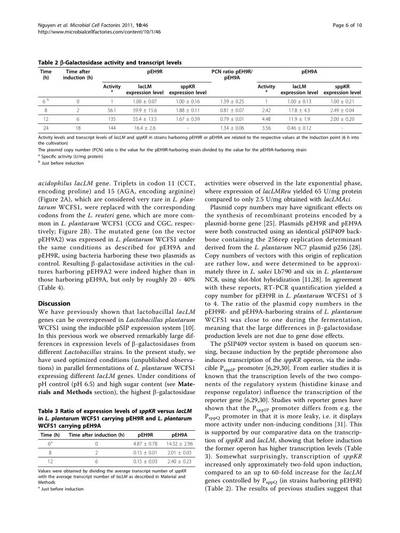
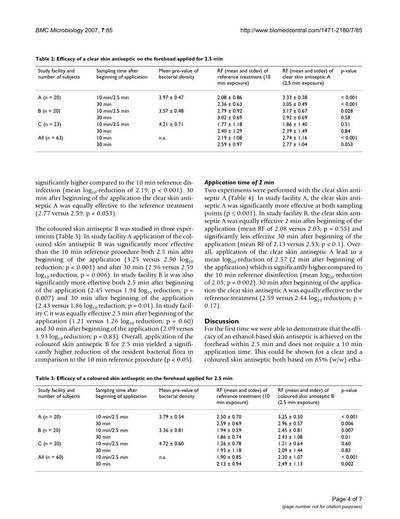
PubTables-1M: Towards Comprehensive Table Extraction from Unstructured Documents (Detection) is a dataset for an object detection task. It is used in the optical character recognition (OCR) domain.
The dataset consists of 575305 images with 683056 labeled objects belonging to 2 different classes including table and table rotated.
Images in the PubTables-1M: Detection dataset have bounding box annotations. All images are labeled (i.e. with annotations). There are 3 splits in the dataset: train (460589 images), val (57591 images), and test (57125 images). Additionally, every table has information tags: pose, truncted, difficult, and occluded. The dataset was released in 2022 by the Microsoft, USA.
Explore #
PubTables-1M: Detection dataset has 575305 images. Click on one of the examples below or open "Explore" tool anytime you need to view dataset images with annotations. This tool has extended visualization capabilities like zoom, translation, objects table, custom filters and more. Hover the mouse over the images to hide or show annotations.


Class balance #
There are 2 annotation classes in the dataset. Find the general statistics and balances for every class in the table below. Click any row to preview images that have labels of the selected class. Sort by column to find the most rare or prevalent classes.

Class ㅤ | Images ㅤ | Objects ㅤ | Count on image average | Area on image average |
|---|---|---|---|---|
table➔ rectangle | 570862 | 678526 | 1.19 | 19.4% |
table rotated➔ rectangle | 4488 | 4530 | 1.01 | 34.33% |
Co-occurrence matrix #
Co-occurrence matrix is an extremely valuable tool that shows you the images for every pair of classes: how many images have objects of both classes at the same time. If you click any cell, you will see those images. We added the tooltip with an explanation for every cell for your convenience, just hover the mouse over a cell to preview the description.
Images #
Explore every single image in the dataset with respect to the number of annotations of each class it has. Click a row to preview selected image. Sort by any column to find anomalies and edge cases. Use horizontal scroll if the table has many columns for a large number of classes in the dataset.
Object distribution #
Interactive heatmap chart for every class with object distribution shows how many images are in the dataset with a certain number of objects of a specific class. Users can click cell and see the list of all corresponding images.
Class sizes #
The table below gives various size properties of objects for every class. Click a row to see the image with annotations of the selected class. Sort columns to find classes with the smallest or largest objects or understand the size differences between classes.
Class | Object count | Avg area | Max area | Min area | Min height | Min height | Max height | Max height | Avg height | Avg height | Min width | Min width | Max width | Max width |
|---|---|---|---|---|---|---|---|---|---|---|---|---|---|---|
table rectangle | 678526 | 16.33% | 77.04% | 0.21% | 9px | 0.9% | 879px | 87.9% | 242px | 24.3% | 63px | 8.91% | 963px | 96.3% |
table rotated rectangle | 4530 | 34.01% | 73.67% | 1.72% | 196px | 19.6% | 912px | 91.2% | 809px | 80.87% | 32px | 4.14% | 677px | 87.6% |
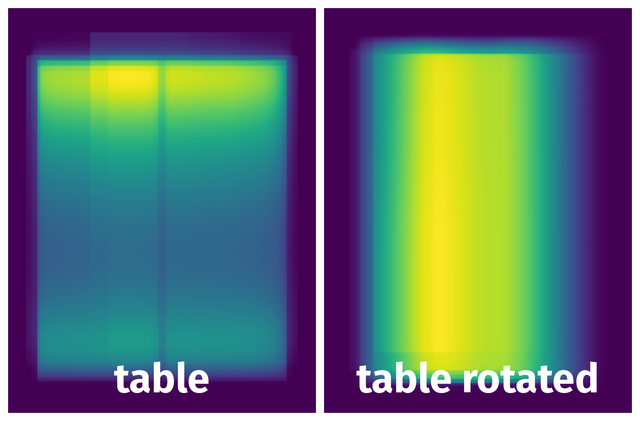
Spatial Heatmap #
The heatmaps below give the spatial distributions of all objects for every class. These visualizations provide insights into the most probable and rare object locations on the image. It helps analyze objects' placements in a dataset.
Objects #
Table contains all 99779 objects. Click a row to preview an image with annotations, and use search or pagination to navigate. Sort columns to find outliers in the dataset.
Object ID ㅤ | Class ㅤ | Image name click row to open | Image size height x width | Height ㅤ | Height ㅤ | Width ㅤ | Width ㅤ | Area ㅤ |
|---|---|---|---|---|---|---|---|---|
1➔ | table rectangle | PMC4520098_3.jpg | 1000 x 750 | 63px | 6.3% | 609px | 81.2% | 5.12% |
2➔ | table rectangle | PMC6344103_5.jpg | 1000 x 773 | 90px | 9% | 598px | 77.36% | 6.96% |
3➔ | table rectangle | PMC6344103_5.jpg | 1000 x 773 | 60px | 6% | 448px | 57.96% | 3.48% |
4➔ | table rectangle | PMC4896953_3.jpg | 1000 x 764 | 501px | 50.1% | 646px | 84.55% | 42.36% |
5➔ | table rectangle | PMC5016870_2.jpg | 1000 x 753 | 218px | 21.8% | 296px | 39.31% | 8.57% |
6➔ | table rectangle | PMC3432106_8.jpg | 1000 x 774 | 103px | 10.3% | 276px | 35.66% | 3.67% |
7➔ | table rectangle | PMC3432106_8.jpg | 1000 x 774 | 56px | 5.6% | 270px | 34.88% | 1.95% |
8➔ | table rectangle | PMC6192402_3.jpg | 1000 x 761 | 168px | 16.8% | 293px | 38.5% | 6.47% |
9➔ | table rectangle | PMC6192402_3.jpg | 1000 x 761 | 181px | 18.1% | 294px | 38.63% | 6.99% |
10➔ | table rectangle | PMC4725835_6.jpg | 1000 x 761 | 92px | 9.2% | 374px | 49.15% | 4.52% |
License #
PubTables-1M: Towards Comprehensive Table Extraction from Unstructured Documents (Detection) is under CDLA Permissive 2.0 license.
Citation #
If you make use of the PubTables-1M: Detection data, please cite the following reference:
@article{NESTERUK2023105414,
@InProceedings{Smock_2022_CVPR,
  author    = {Smock, Brandon and Pesala, Rohith and Abraham, Robin},
  title     = {PubTables-1M: Towards Comprehensive Table Extraction From Unstructured Documents},
  booktitle = {Proceedings of the IEEE/CVF Conference on Computer Vision and Pattern Recognition (CVPR)},
  month     = {June},
  year      = {2022},
  pages     = {4634-4642}
}
If you are happy with Dataset Ninja and use provided visualizations and tools in your work, please cite us:
@misc{ visualization-tools-for-pubtables-1m-dataset,
  title = { Visualization Tools for PubTables-1M: Detection Dataset },
  type = { Computer Vision Tools },
  author = { Dataset Ninja },
  howpublished = { \url{ https://datasetninja.com/pubtables-1m } },
  url = { https://datasetninja.com/pubtables-1m },
  journal = { Dataset Ninja },
  publisher = { Dataset Ninja },
  year = { 2026 },
  month = { jul },
  note = { visited on 2026-07-19 },
}
Download #
Dataset PubTables-1M: Detection can be downloaded in Supervisely format:
As an alternative, it can be downloaded with dataset-tools package:
pip install --upgrade dataset-tools
… using following python code:
import dataset_tools as dtools

dtools.download(dataset='PubTables-1M: Detection', dst_dir='~/dataset-ninja/')
Make sure not to overlook the python code example available on the Supervisely Developer Portal. It will give you a clear idea of how to effortlessly work with the downloaded dataset.
The data in original format can be downloaded here:
- PubTables-1M-Detection_Annotations_Test.tar.gz
- PubTables-1M-Detection_Annotations_Train.tar.gz
- PubTables-1M-Detection_Annotations_Val.tar.gz
- PubTables-1M-Detection_Filelists.tar.gz
- PubTables-1M-Detection_Images_Test.tar.gz
- PubTables-1M-Detection_Images_Train_Part1.tar.gz
- PubTables-1M-Detection_Images_Train_Part2.tar.gz
- PubTables-1M-Detection_Images_Val.tar.gz
- PubTables-1M-Detection_Page_Words.tar.gz
Disclaimer #
Our gal from the legal dep told us we need to post this:
Dataset Ninja provides visualizations and statistics for some datasets that can be found online and can be downloaded by general audience. Dataset Ninja is not a dataset hosting platform and can only be used for informational purposes. The platform does not claim any rights for the original content, including images, videos, annotations and descriptions. Joint publishing is prohibited.
You take full responsibility when you use datasets presented at Dataset Ninja, as well as other information, including visualizations and statistics we provide. You are in charge of compliance with any dataset license and all other permissions. You are required to navigate datasets homepage and make sure that you can use it. In case of any questions, get in touch with us at hello@datasetninja.com.