

Introduction #
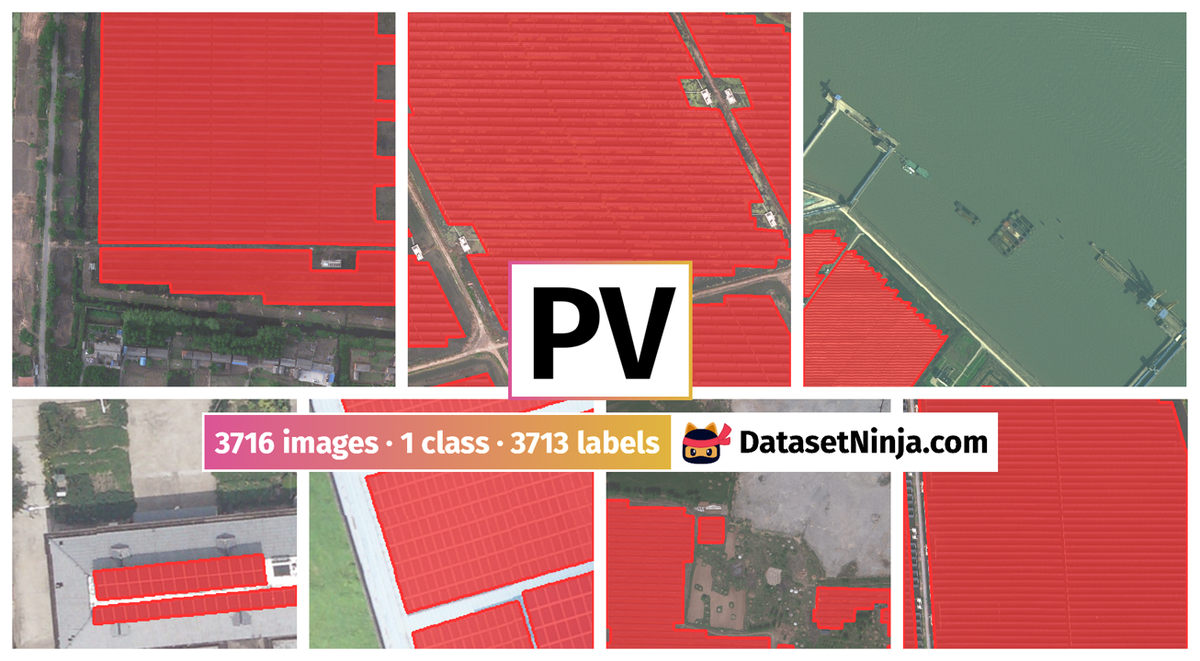
The authors established a PV (PhotoVoltaic) dataset using satellite and aerial images with spatial resolutions of 0.8, 0.3, and 0.1 m, which focus on concentrated PVs, distributed ground PVs, and fine-grained rooftop PVs, respectively. The dataset contains 3716 samples of PVs installed on shrubland, grassland, cropland, saline–alkali land, and water surfaces, as well as flat concrete, steel tile, and brick roofs. The dataset is used to examine the model performance of different deep networks on PV segmentation.

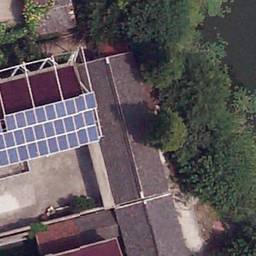
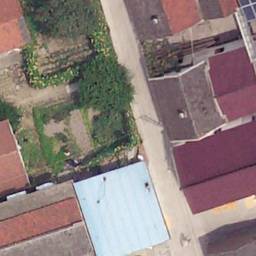
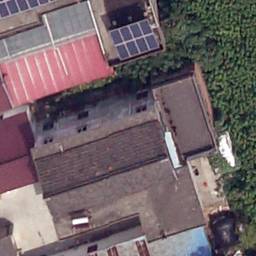
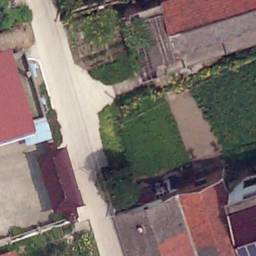
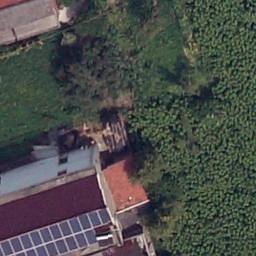
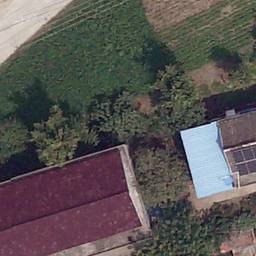
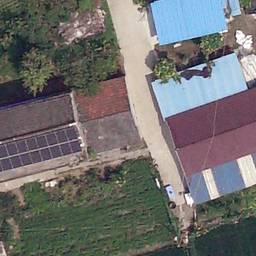
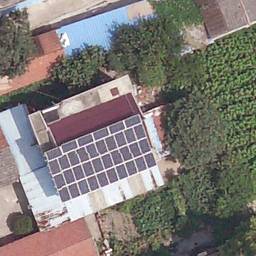
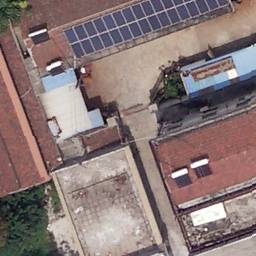
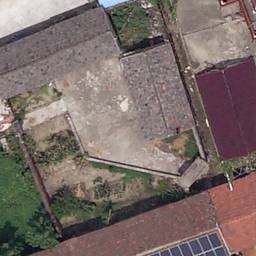
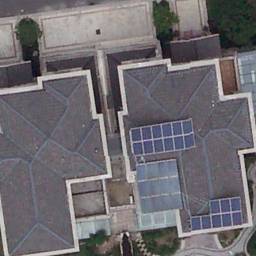
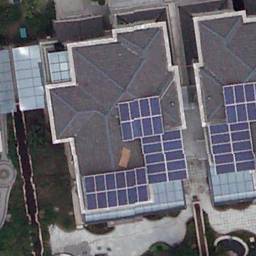
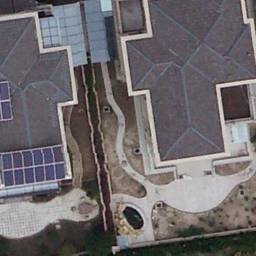
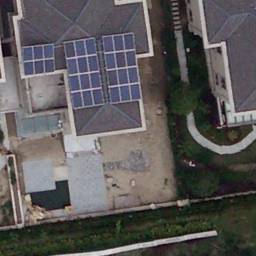
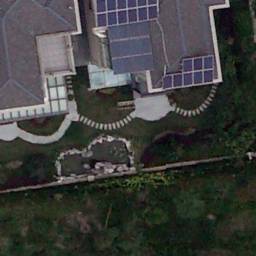
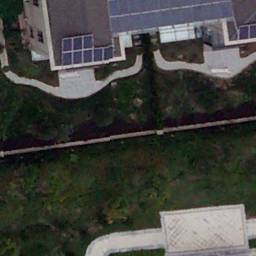
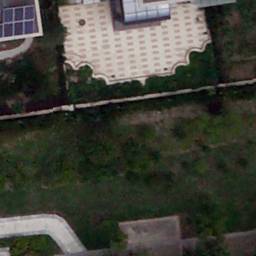
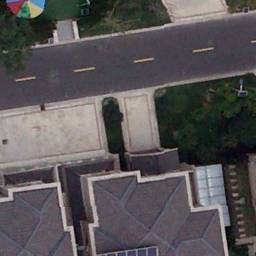
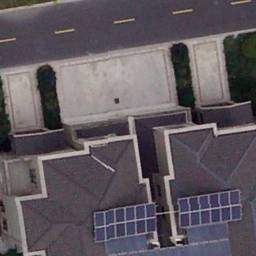
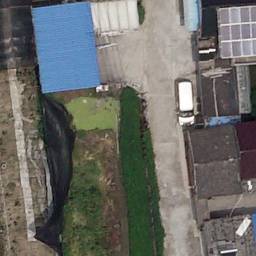
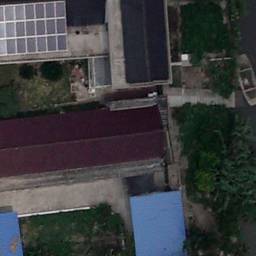
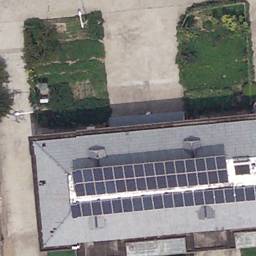
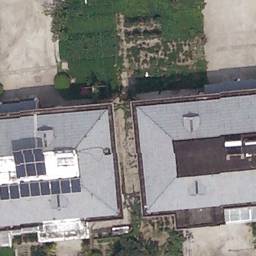
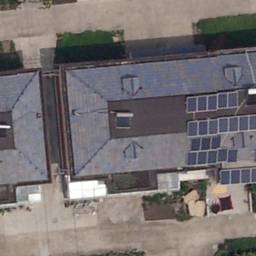
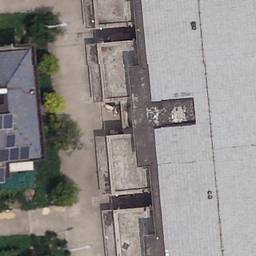
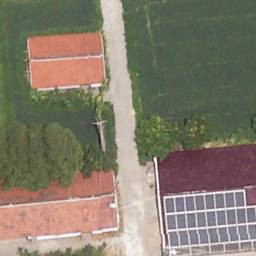
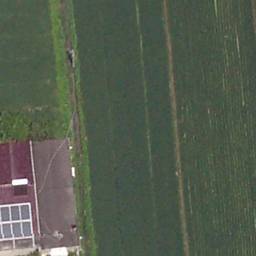
Map of the study area and data sources. (a) The location of Jiangsu Province; (b) spatial distribution of all sampling areas; © Gaofen-2 satellite image with a spatial resolution of 0.8 m; (d) image from aerial photography with a spatial resolution of 0.3 m; and (e) image from unmanned aerial vehicle with a spatial resolution of 0.1 m. The yellow boxes in panels (c–e) represent the same rooftop PVs.
All PV samples are collected in Jiangsu Province, China, covering a total area of 107 200 km² (Fig. above a). Located in the lower reaches of the Yangtze River and Huaihe River, the province is very flat, averaging only 12.3 m above sea level. The land terrain is mostly made up of lowlands and flat plains, with hills and mountains in the southwest and north (Fig. above b).
Due to the shortage of land resources, most of the installed PVs in Jiangsu Province are distributed in areas where land competition is not fierce (e.g., sparse shrubs, low-density grasslands, reservoirs, ponds, saline–alkali lands, and rooftops), which makes it convenient to collect various PVs with different backgrounds.
The sizes of distributed PVs typically vary from a few panels to several hectares depending on the area of available background land. It is difficult to identify all these PVs from a single data source; hence, the authors used satellite and aerial images with different spatial resolutions to collect PV samples at various scales. Gaofen-2 and Beijing-2 satellite images are used to prepare samples of large-scale PVs. Gaofen-2 is part of the CHEOS (China High-Resolution Earth Observation System) family and is capable of acquiring images with a ground sampling distance (GSD) of 0.81 m in panchromatic and 3.24 m in multispectral bands. The Beijing-2 satellite constellation consists of three satellites and can provide images with a GSD of 0.80 m in the panchromatic band and 3.2 m in the blue, green, red, and near-infrared bands. Aerial imagery with a GSD of 0.3 m is used to collect samples of distributed ground PVs. The aerial photography was conducted by the Provincial Geomatics Center of Jiangsu in 2018, covering the whole of Jiangsu Province. UAV images are used to collect rooftop PV samples. The UAV flight was carried out in Hai’an County (yellow box in Fig. above b), where the development of rooftop PVs is relatively advanced. Ground control point (GCP) data obtained by continuous operating reference stations were used for georeferencing. The final orthophotos have a GSD of 0.1 m and a location accuracy of approximately 0.02 m. Figure above (c,d) illustrates the appearance of two rooftop PVs in different images. In the Gaofen-2 image, the PVs take up only a dozen pixels that are mixed with surrounding rooftops (Fig. above c). It is difficult to distinguish the PVs from the background, let alone get their exact position and size. In contrast, PV detection becomes slightly easier in the aerial photograph, but obtaining accurate PV boundaries is still difficult. In the UAV image, authors can clearly recognize the PVs, obtain their boundaries, and even count how many panels each PV is composed of.
| Dataset | Category | Spatial resolution | Code | Size | No. |
|---|---|---|---|---|---|
| PV08 | PV08_Rooftop | ∼ 0.8 m | 11 | 1024 × 1024 | 90 |
| PV08_Ground | ∼ 0.8 m | 12 | 1024 × 1024 | 673 | |
| PV03 | PV03_Rooftop | ∼ 0.3 m | 111 | 1024 × 1024 | 236 |
| PV03_Ground_Shrubwood | ∼ 0.3 m | 121 | 1024 × 1024 | 119 | |
| PV03_Ground_Grassland | ∼ 0.3 m | 122 | 1024 × 1024 | 117 | |
| PV03_Ground_Cropland | ∼ 0.3 m | 123 | 1024 × 1024 | 859 | |
| PV03_Ground_SalineAlkali | ∼ 0.3 m | 124 | 1024 × 1024 | 352 | |
| PV03_Ground_WaterSurface | ∼ 0.3 m | 125 | 1024 × 1024 | 625 | |
| PV01 | PV01_Rooftop_FlatConcrete | ∼ 0.1 m | 211 | 256 × 256 | 413 |
| PV01_Rooftop_SteelTile | ∼ 0.1 m | 212 | 256 × 256 | 94 | |
| PV01_Rooftop_Brick | ∼ 0.1 m | 213 | 256 × 256 | 138 |
Organizational structure of the PV dataset.
The PV dataset includes three groups of PV samples collected at different spatial resolutions, namely PV08 from Gaofen-2 and Beijing-2 imagery, PV03 from aerial photography, and PV01 from UAV orthophotos. PV08 contains rooftop and ground PV samples. Ground samples in PV03 are divided into five categories according to their background land use type: shrubland, grassland, cropland, saline–alkali land, and water surface. Rooftop samples in PV01 are divided into three categories according to their background roof type: flat concrete, steel tile, and brick.
 Homepage
 Research Paper
Summary #
PV: Multi-resolution Dataset for Photovoltaic Panel Segmentation From Satellite and Aerial Imagery is a dataset for a semantic segmentation task. It is used in the urban planning, energy, environmental, and urban planning industries.
The dataset consists of 3716 images with 3713 labeled objects belonging to 1 single class (photovoltaic_panel).
Images in the PV dataset have pixel-level semantic segmentation annotations. There are 3 (0% of the total) unlabeled images (i.e. without annotations). There are no pre-defined train/val/test splits in the dataset. The dataset contatins dataset (PV01, PV08, PV03) and category tags. The dataset was released in 2021 by the Chinese Academy of Sciences, Southern Marine Science and Engineering Guangdong Laboratory, Nanjing Normal University, and China Provincial Geomatics Center of Jiangsu.
Explore #
PV dataset has 3716 images. Click on one of the examples below or open "Explore" tool anytime you need to view dataset images with annotations. This tool has extended visualization capabilities like zoom, translation, objects table, custom filters and more. Hover the mouse over the images to hide or show annotations.


Class balance #
There are 1 annotation classes in the dataset. Find the general statistics and balances for every class in the table below. Click any row to preview images that have labels of the selected class. Sort by column to find the most rare or prevalent classes.

Class ㅤ | Images ㅤ | Objects ㅤ | Count on image average | Area on image average |
|---|---|---|---|---|
photovoltaic_panel➔ mask | 3713 | 3713 | 1 | 25.13% |
Images #
Explore every single image in the dataset with respect to the number of annotations of each class it has. Click a row to preview selected image. Sort by any column to find anomalies and edge cases. Use horizontal scroll if the table has many columns for a large number of classes in the dataset.
Object distribution #
Interactive heatmap chart for every class with object distribution shows how many images are in the dataset with a certain number of objects of a specific class. Users can click cell and see the list of all corresponding images.
Class sizes #
The table below gives various size properties of objects for every class. Click a row to see the image with annotations of the selected class. Sort columns to find classes with the smallest or largest objects or understand the size differences between classes.
Class | Object count | Avg area | Max area | Min area | Min height | Min height | Max height | Max height | Avg height | Avg height | Min width | Min width | Max width | Max width |
|---|---|---|---|---|---|---|---|---|---|---|---|---|---|---|
photovoltaic_panel mask | 3713 | 25.13% | 95.1% | 0% | 1px | 0.2% | 1024px | 100% | 521px | 59.55% | 1px | 0.1% | 1024px | 100% |
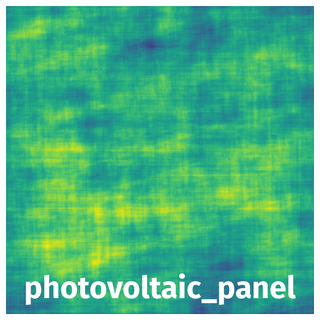
Spatial Heatmap #
The heatmaps below give the spatial distributions of all objects for every class. These visualizations provide insights into the most probable and rare object locations on the image. It helps analyze objects' placements in a dataset.
Objects #
Table contains all 3713 objects. Click a row to preview an image with annotations, and use search or pagination to navigate. Sort columns to find outliers in the dataset.
Object ID ㅤ | Class ㅤ | Image name click row to open | Image size height x width | Height ㅤ | Height ㅤ | Width ㅤ | Width ㅤ | Area ㅤ |
|---|---|---|---|---|---|---|---|---|
1➔ | photovoltaic_panel mask | PV03_319670_1191271.bmp | 1024 x 1024 | 380px | 37.11% | 113px | 11.04% | 1.39% |
2➔ | photovoltaic_panel mask | PV03_333293_1180877.bmp | 1024 x 1024 | 16px | 1.56% | 32px | 3.12% | 0.05% |
3➔ | photovoltaic_panel mask | PV01_325190_1204156.bmp | 256 x 256 | 256px | 100% | 256px | 100% | 42.46% |
4➔ | photovoltaic_panel mask | PV03_338785_1199913.bmp | 1024 x 1024 | 916px | 89.45% | 417px | 40.72% | 13.98% |
5➔ | photovoltaic_panel mask | PV03_319381_1193937.bmp | 1024 x 1024 | 1023px | 99.9% | 531px | 51.86% | 46.8% |
6➔ | photovoltaic_panel mask | PV01_325555_1204580.bmp | 256 x 256 | 78px | 30.47% | 92px | 35.94% | 8.15% |
7➔ | photovoltaic_panel mask | PV03_346052_1193583.bmp | 1024 x 1024 | 211px | 20.61% | 127px | 12.4% | 1.19% |
8➔ | photovoltaic_panel mask | PV08_325287_1210561.bmp | 1024 x 1024 | 524px | 51.17% | 574px | 56.05% | 14.12% |
9➔ | photovoltaic_panel mask | PV03_346804_1190091.bmp | 1024 x 1024 | 533px | 52.05% | 1024px | 100% | 43.28% |
10➔ | photovoltaic_panel mask | PV03_327838_1209228.bmp | 1024 x 1024 | 1024px | 100% | 1024px | 100% | 85.97% |
License #
Citation #
If you make use of the PV data, please cite the following reference:
@dataset{jiang_hou_2021_5171712,
  author = {Jiang Hou and Yao Ling and Liu Yujun},
  title = {{Multi-resolution dataset for photovoltaic panel segmentation from satellite and aerial imagery}},
  month = aug,
  year = 2021,
  note = {{Data document can refer to the preprint https://essd.copernicus.org/preprints/essd-2021-270/}},
  publisher = {Zenodo},
  version = {v1.0},
  doi = {10.5281/zenodo.5171712},
  url = {https://doi.org/10.5281/zenodo.5171712}
}
If you are happy with Dataset Ninja and use provided visualizations and tools in your work, please cite us:
@misc{ visualization-tools-for-pv-dataset,
  title = { Visualization Tools for PV Dataset },
  type = { Computer Vision Tools },
  author = { Dataset Ninja },
  howpublished = { \url{ https://datasetninja.com/pv } },
  url = { https://datasetninja.com/pv },
  journal = { Dataset Ninja },
  publisher = { Dataset Ninja },
  year = { 2026 },
  month = { jul },
  note = { visited on 2026-07-29 },
}
Download #
Dataset PV can be downloaded in Supervisely format:
As an alternative, it can be downloaded with dataset-tools package:
pip install --upgrade dataset-tools
… using following python code:
import dataset_tools as dtools

dtools.download(dataset='PV', dst_dir='~/dataset-ninja/')
Make sure not to overlook the python code example available on the Supervisely Developer Portal. It will give you a clear idea of how to effortlessly work with the downloaded dataset.
Disclaimer #
Our gal from the legal dep told us we need to post this:
Dataset Ninja provides visualizations and statistics for some datasets that can be found online and can be downloaded by general audience. Dataset Ninja is not a dataset hosting platform and can only be used for informational purposes. The platform does not claim any rights for the original content, including images, videos, annotations and descriptions. Joint publishing is prohibited.
You take full responsibility when you use datasets presented at Dataset Ninja, as well as other information, including visualizations and statistics we provide. You are in charge of compliance with any dataset license and all other permissions. You are required to navigate datasets homepage and make sure that you can use it. In case of any questions, get in touch with us at hello@datasetninja.com.