

Introduction #
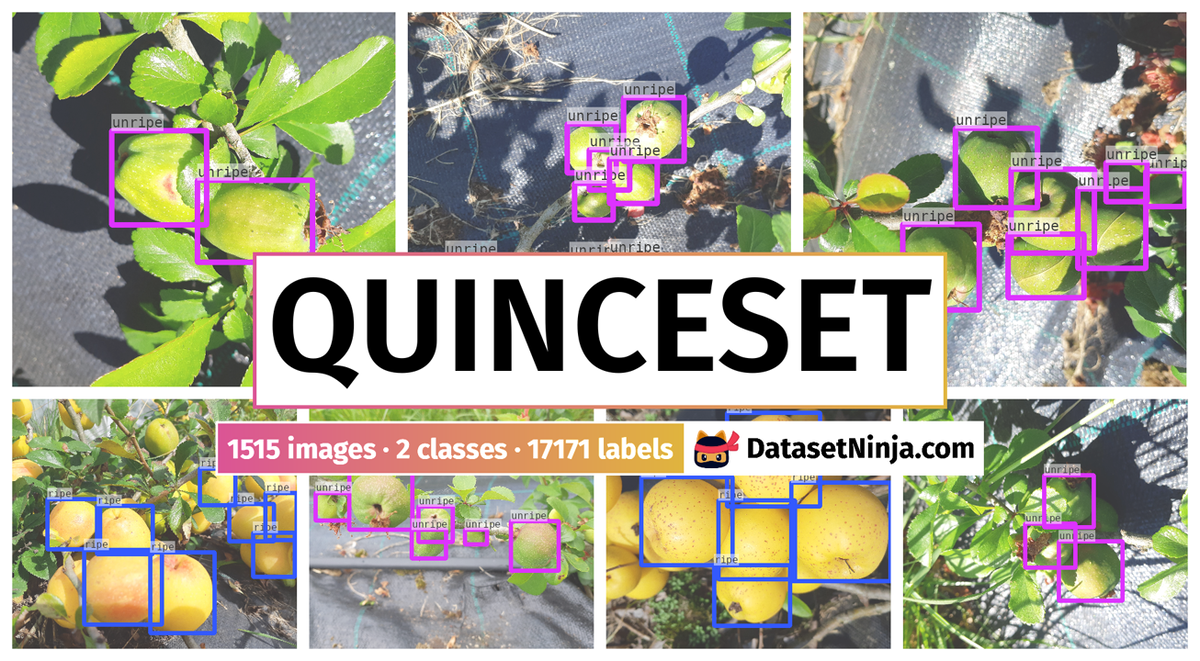
The authors of the QuinceSet: Dataset of Annotated Japanese Quince Images for Object Detection dataset address the pressing need for ecologically adaptable fruit varieties due to long-term temperature and weather fluctuations. The presented dataset comprises 1515 high-resolution RGB .jpg images, each measuring 3456×3456 pixels. Each image is associated with an annotated .txt file in YOLO format, marking the ground truth regions of interest (ROIs) for individual Japanese quince fruits. This annotation is meticulously performed with a total of 17,171 annotations provided by domain experts.
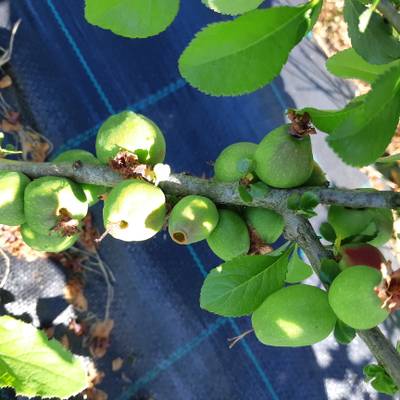
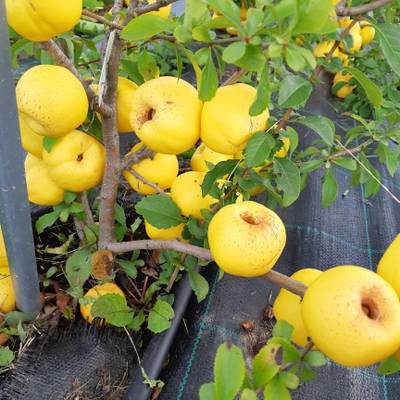
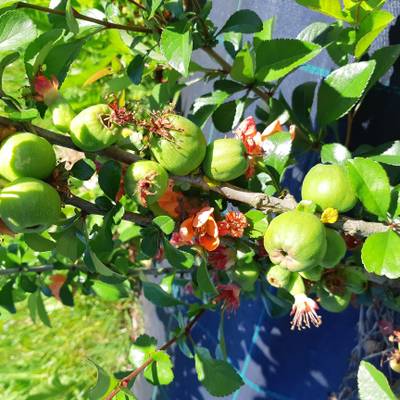
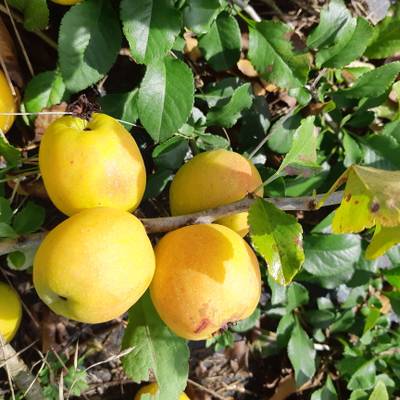
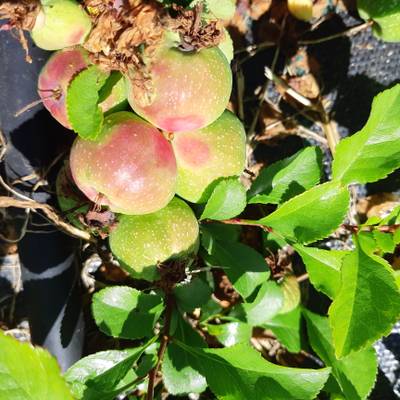
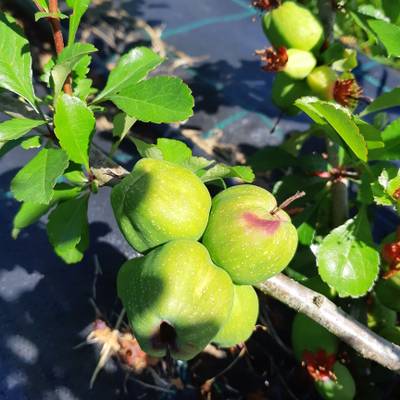
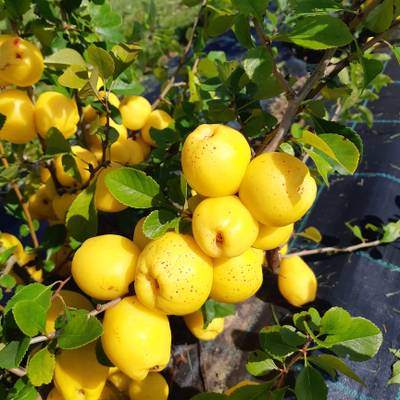
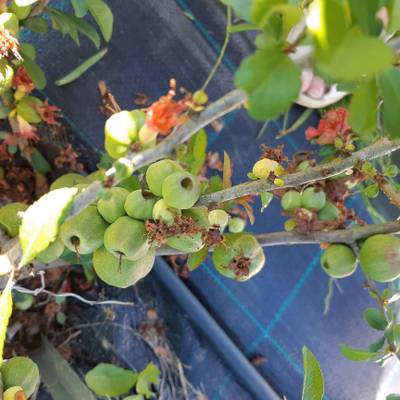
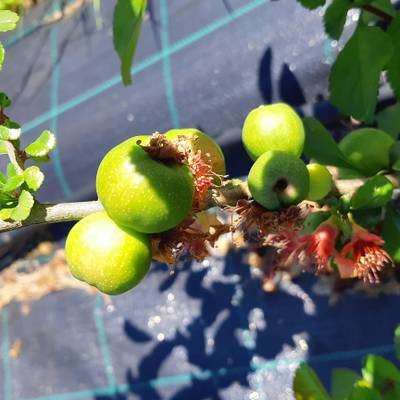
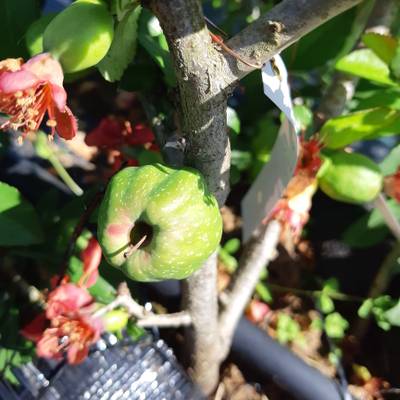
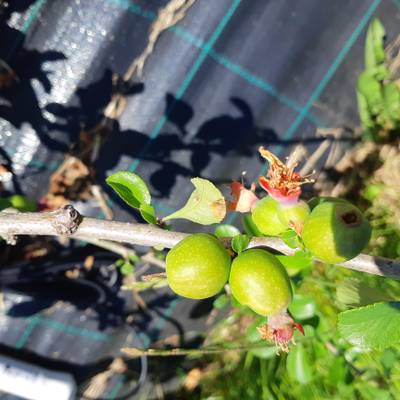
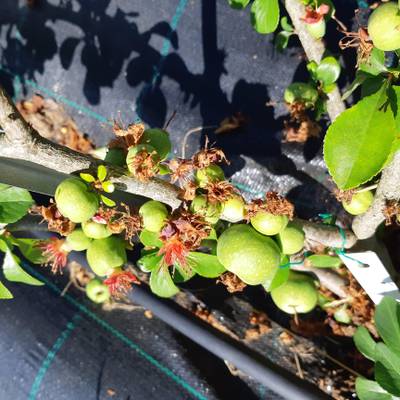
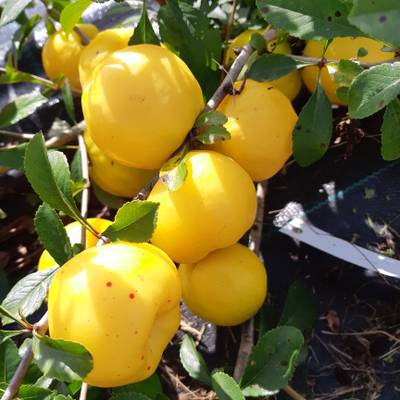
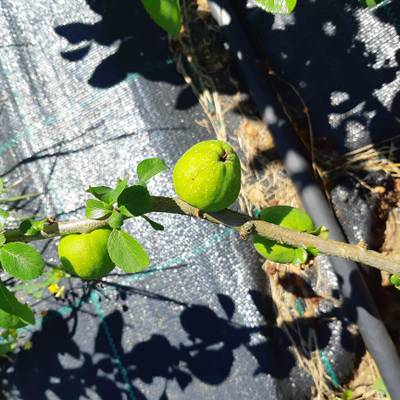
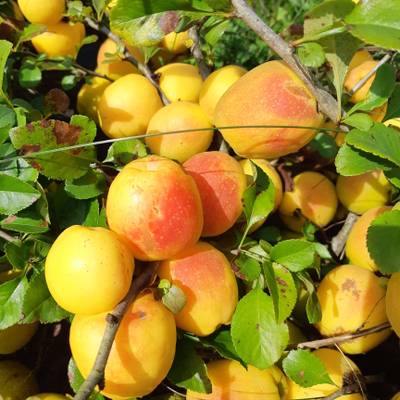
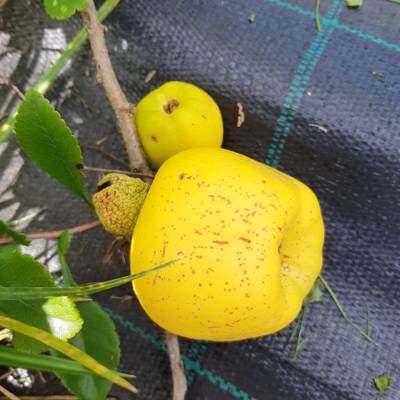
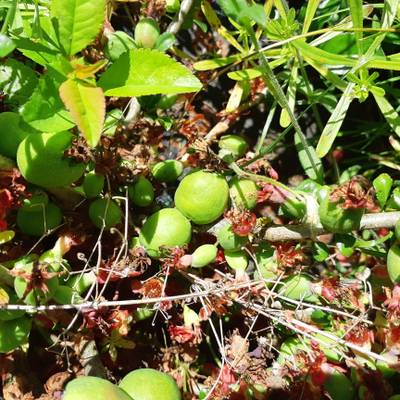
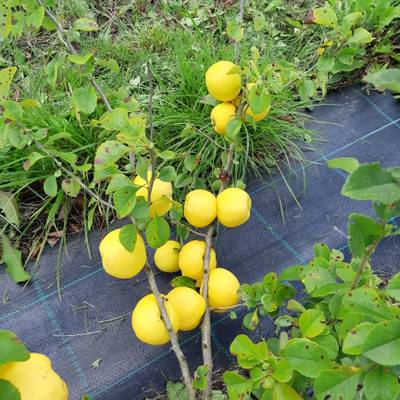
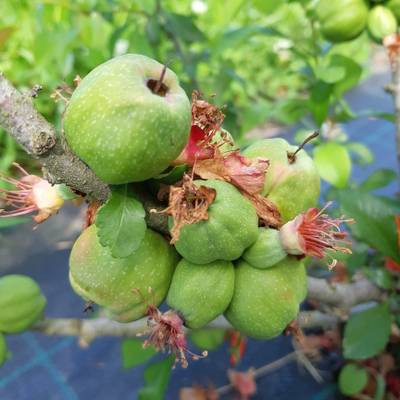
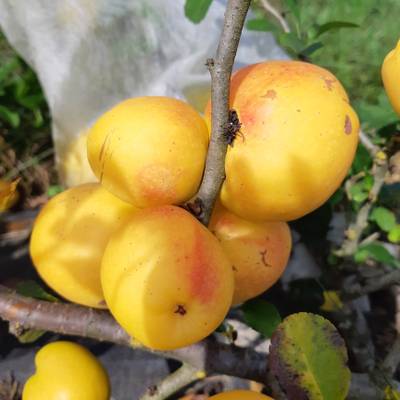
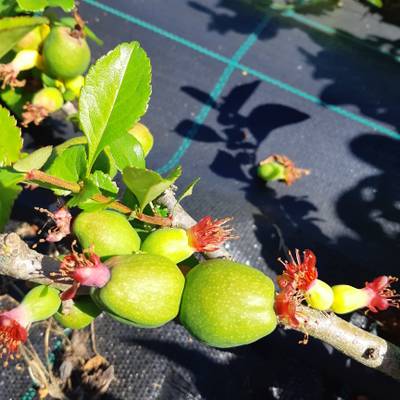
The authors highlight the significance of visually describing and evaluating fruit set characteristics at different growth stages for fruit breeding selection and yield predictions. This conventional approach, however, is labor-intensive and time-consuming, requiring both human expertise and effort. To overcome these challenges, the authors introduce the QuinceSet dataset, which comprises images of Japanese quince (Chaenomeles japonica) fruits annotated for detection and phenotyping across two phenological developmental stages: post-flowering when the fruit reaches 30-50% of its final size and ripening stage just prior to yielding.
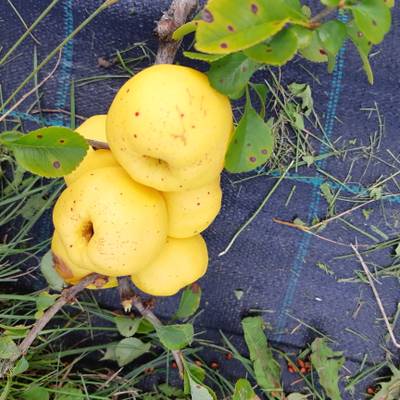
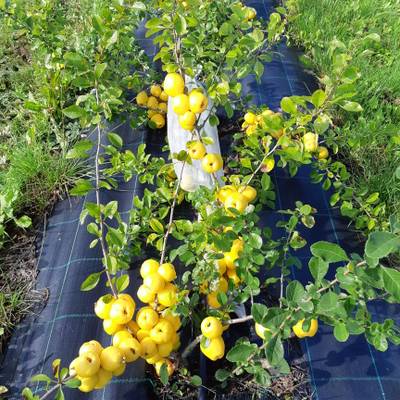
The dataset is collected from the Institute of Horticulture in Dobele, Latvia, capturing images of both fully visible quinces and those partially obscured by leaves. To ensure data reliability and quality, images are homogenized under varying weather conditions, different times of day, and various angles of capture. The images were collected in field conditions from different Japanese quince genotypes, characterized by distinct shrub forms and fruit shapes. Captured with a Samsung Galaxy A8 cell phone, the images were taken from an orchard plot at the Institute of Horticulture.
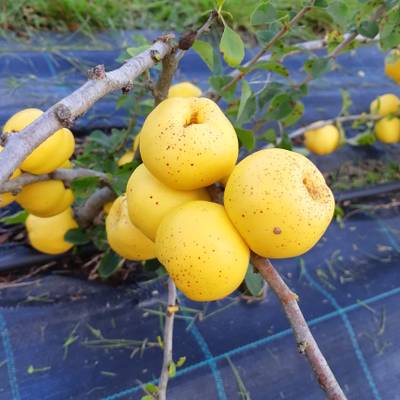
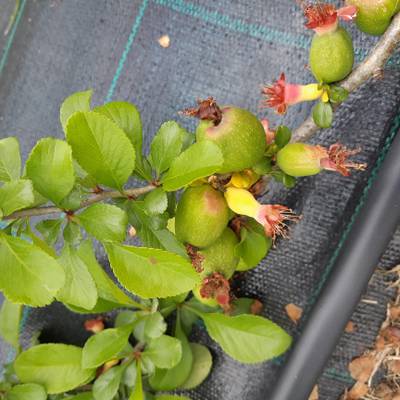
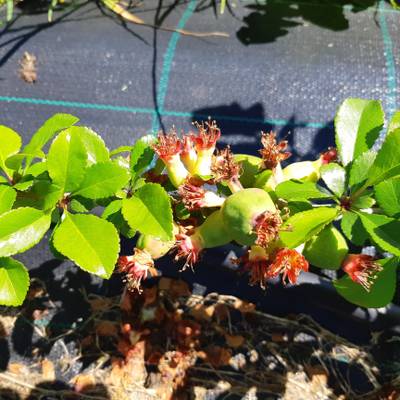
Prior to image capture, experts from the Institute of Horticulture evaluated breeding conditions and optimal imaging timing for Japanese quince. Images were acquired under diverse weather conditions, varying distances, and angles. The dataset is divided into two phenological stages: unripe and ripe quinces. The former is captured post-flowering, once the second fruit fall is complete and the fruit reaches 30-50% of its final size. The latter corresponds to the ripening stage just before fruit yield, with data collected at varying times to account for genotype differences.
| Date | Class | No. of images | Air``temperature, °C | Humidity, % | Soil``temperature, °C | Soil moisture content, % | PPFD, µmol/m2/s |
|---|---|---|---|---|---|---|---|
| 14.06.2021. | Unripe | 449 | 24.9 | 35.9 | 24.0 | 19.0 | 1748.6 |
| 15.06.2021. | Unripe | 440 | 23.6 | 45.9 | 22.9 | 16.8 | 1380.8 |
| 16.08.2021. | Ripe | 46 | 24.2 | 57.3 | 21.5 | 21.6 | 958.2 |
| 20.08.2021. | Ripe | 464 | 21.3 | 56.5 | 19.3 | 28.9 | 906.4 |
| 23.08.2021. | Ripe | 140 | 22 | 43.5 | 20.2 | 19.7 | 1205.6 |
Image annotation was meticulously executed using LabelImg software, associating each image with its corresponding class and class-specific bounding box coordinates in YOLO format. Annotations were performed to encompass the entire quince fruit, occasionally leading to overlapping annotations to ensure comprehensive coverage. The authors’ dataset contributes to more efficient breeding processes, robust yield estimation, and enhanced phenotyping of quinces, while potentially offering insights for the breeding of other crops as well.
 Homepage
 Research Paper
Summary #
QuinceSet: Dataset of Annotated Japanese Quince Images for Object Detection is a dataset for an object detection task. It is used in the agricultural industry.
The dataset consists of 1515 images with 17171 labeled objects belonging to 2 different classes including unripe and ripe.
Images in the QuinceSet dataset have bounding box annotations. All images are labeled (i.e. with annotations). There are no pre-defined train/val/test splits in the dataset. Additionaly, the dataset contains information about air temperature, °C, humidity, %, soil temperature, °C, soil moisture content, %, and PPFD, µmol/m2/s. The dataset was released in 2022 by the Institute of Horticulture, Latvia and Institute of Electronics and Computer Science, Latvia.
Explore #
QuinceSet dataset has 1515 images. Click on one of the examples below or open "Explore" tool anytime you need to view dataset images with annotations. This tool has extended visualization capabilities like zoom, translation, objects table, custom filters and more. Hover the mouse over the images to hide or show annotations.


Class balance #
There are 2 annotation classes in the dataset. Find the general statistics and balances for every class in the table below. Click any row to preview images that have labels of the selected class. Sort by column to find the most rare or prevalent classes.

Class ㅤ | Images ㅤ | Objects ㅤ | Count on image average | Area on image average |
|---|---|---|---|---|
unripe➔ rectangle | 869 | 7565 | 8.71 | 16.52% |
ripe➔ rectangle | 646 | 9606 | 14.87 | 23.59% |
Co-occurrence matrix #
Co-occurrence matrix is an extremely valuable tool that shows you the images for every pair of classes: how many images have objects of both classes at the same time. If you click any cell, you will see those images. We added the tooltip with an explanation for every cell for your convenience, just hover the mouse over a cell to preview the description.
Images #
Explore every single image in the dataset with respect to the number of annotations of each class it has. Click a row to preview selected image. Sort by any column to find anomalies and edge cases. Use horizontal scroll if the table has many columns for a large number of classes in the dataset.
Object distribution #
Interactive heatmap chart for every class with object distribution shows how many images are in the dataset with a certain number of objects of a specific class. Users can click cell and see the list of all corresponding images.
Class sizes #
The table below gives various size properties of objects for every class. Click a row to see the image with annotations of the selected class. Sort columns to find classes with the smallest or largest objects or understand the size differences between classes.
Class | Object count | Avg area | Max area | Min area | Min height | Min height | Max height | Max height | Avg height | Avg height | Min width | Min width | Max width | Max width |
|---|---|---|---|---|---|---|---|---|---|---|---|---|---|---|
ripe rectangle | 9606 | 1.76% | 29.24% | 0% | 4px | 0.12% | 1844px | 53.36% | 388px | 11.24% | 1px | 0.03% | 1894px | 54.8% |
unripe rectangle | 7565 | 2.07% | 18.58% | 0% | 26px | 0.75% | 1467px | 42.45% | 454px | 13.14% | 1px | 0.03% | 1520px | 43.98% |
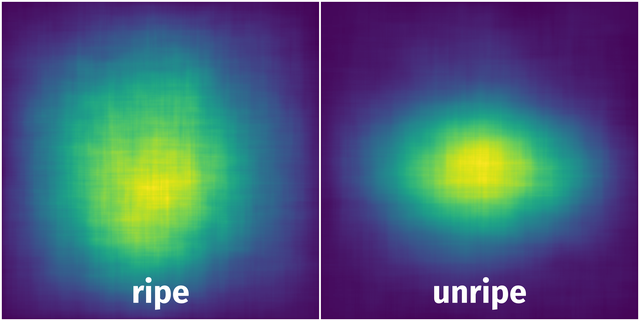
Spatial Heatmap #
The heatmaps below give the spatial distributions of all objects for every class. These visualizations provide insights into the most probable and rare object locations on the image. It helps analyze objects' placements in a dataset.
Objects #
Table contains all 17171 objects. Click a row to preview an image with annotations, and use search or pagination to navigate. Sort columns to find outliers in the dataset.
Object ID ㅤ | Class ㅤ | Image name click row to open | Image size height x width | Height ㅤ | Height ㅤ | Width ㅤ | Width ㅤ | Area ㅤ |
|---|---|---|---|---|---|---|---|---|
1➔ | ripe rectangle | 20210823_154949.jpg | 3456 x 3456 | 1219px | 35.27% | 1219px | 35.27% | 12.44% |
2➔ | ripe rectangle | 20210823_154949.jpg | 3456 x 3456 | 951px | 27.52% | 1075px | 31.11% | 8.56% |
3➔ | ripe rectangle | 20210823_154949.jpg | 3456 x 3456 | 918px | 26.56% | 980px | 28.36% | 7.53% |
4➔ | ripe rectangle | 20210823_154949.jpg | 3456 x 3456 | 911px | 26.36% | 905px | 26.19% | 6.9% |
5➔ | ripe rectangle | 20210823_154949.jpg | 3456 x 3456 | 1119px | 32.38% | 1090px | 31.54% | 10.21% |
6➔ | ripe rectangle | 20210823_154949.jpg | 3456 x 3456 | 887px | 25.67% | 791px | 22.89% | 5.87% |
7➔ | ripe rectangle | 20210820_114231.jpg | 3456 x 3456 | 1081px | 31.28% | 1047px | 30.3% | 9.48% |
8➔ | ripe rectangle | 20210820_114231.jpg | 3456 x 3456 | 994px | 28.76% | 993px | 28.73% | 8.26% |
9➔ | ripe rectangle | 20210820_114231.jpg | 3456 x 3456 | 700px | 20.25% | 780px | 22.57% | 4.57% |
10➔ | ripe rectangle | 20210820_114231.jpg | 3456 x 3456 | 880px | 25.46% | 694px | 20.08% | 5.11% |
License #
Citation #
If you make use of the QuinceSet data, please cite the following reference:
@article{kaufmane_edite_2022_6402251,
  author       = {Kaufmane, Edīte and
                  Sudars, Kaspars and
                  Namatēvs, Ivars and
                  Kalniņa, Ieva and
                  Judvaitis, Jānis and
                  Balašs, Rihards and
                  Strautiņa, Sarmīte},
  title        = {{QuinceSet: Dataset of Annotated Japanese Quince
                   Images for Object Detection}},
  journal      = {Data in Brief},
  year         = 2022,
  month        = mar,
  doi          = {10.5281/zenodo.6402251},
  url          = {https://doi.org/10.5281/zenodo.6402251}
}
If you are happy with Dataset Ninja and use provided visualizations and tools in your work, please cite us:
@misc{ visualization-tools-for-quince-set-dataset,
  title = { Visualization Tools for QuinceSet Dataset },
  type = { Computer Vision Tools },
  author = { Dataset Ninja },
  howpublished = { \url{ https://datasetninja.com/quince-set } },
  url = { https://datasetninja.com/quince-set },
  journal = { Dataset Ninja },
  publisher = { Dataset Ninja },
  year = { 2026 },
  month = { jul },
  note = { visited on 2026-07-23 },
}
Download #
Dataset QuinceSet can be downloaded in Supervisely format:
As an alternative, it can be downloaded with dataset-tools package:
pip install --upgrade dataset-tools
… using following python code:
import dataset_tools as dtools

dtools.download(dataset='QuinceSet', dst_dir='~/dataset-ninja/')
Make sure not to overlook the python code example available on the Supervisely Developer Portal. It will give you a clear idea of how to effortlessly work with the downloaded dataset.
The data in original format can be downloaded here.
Disclaimer #
Our gal from the legal dep told us we need to post this:
Dataset Ninja provides visualizations and statistics for some datasets that can be found online and can be downloaded by general audience. Dataset Ninja is not a dataset hosting platform and can only be used for informational purposes. The platform does not claim any rights for the original content, including images, videos, annotations and descriptions. Joint publishing is prohibited.
You take full responsibility when you use datasets presented at Dataset Ninja, as well as other information, including visualizations and statistics we provide. You are in charge of compliance with any dataset license and all other permissions. You are required to navigate datasets homepage and make sure that you can use it. In case of any questions, get in touch with us at hello@datasetninja.com.